monitoring system based on a flow injection analysis apparatus. The monitoring system shows interesting performances concerning signal stability, extended ...
18/08/13
On line glucose monitoring
Anal.Lett. 27,5(94)
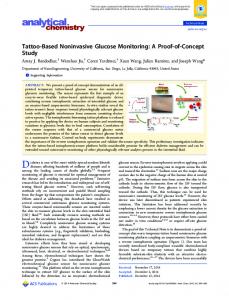
ENTIRELY AUTOMATED GLUCOSE MONITORING SYSTEM BASED ON A FLOW INJECTION ANALYSIS APPARATUS Keywords: amperometric glucose sensor, flow injection analysis, process monitoring, analysis automation, hollow fiber membrane enzyme reactor, lactose hydrolysis R.Pilloton, G.Mignogna, A.Fortunato. ENEA, CRE Casaccia, Technological Innovation Dept., Biotechnology and Agriculture Sector, SP 008 Via Anguillarese 301, 00060 Rome, Italy ABSTRACT A process for waste whey treatment, fully based on membrane technologies, has been studied and developed in a pilot plant scale, with the aim to recover chemicals from farm wastes (fats, whey proteins, lactose, salts and water). This process, described in its essential steps, includes a hollow fibre membrane reactor for the hydrolysis of lactose with an immobilised b-galactosidase. The bioreactor performances are studied, in a lab scale, with an entirely automated glucose monitoring system based on a flow injection analysis apparatus. The monitoring system shows interesting performances concerning signal stability, extended linearity (up to 150 mmol l-1) and long term monitoring (up to 3 months without manual operations). The performances of the glucose monitoring system are described. Introduction Cheese-whey is the liquid separated after milk coagulation. It represents about 90% of the initial milk volume. Whey represents a serious environmental problem because of its high pollutant content (COD of about 70.000 ppm). Because of the high production level and dispersion of farms, the treatment of this waste is a serious problem in Italy that cannot be resolved with a traditional depuration treatment. Membrane technologies offer the opportunity to recover the whey chemicals (whey proteins, fats, lactose, mineral salts, purified water) reducing, at the same time, its environmental impact. A process, fully based on cross-flow membrane technologies, such as microfiltration (MF), ultrafiltration (UF), and reverse osmosis (RO) has been studied and developed in a pilot plant scale to separate and recover all the components of the waste whey (fats, whey proteins, lactose, salts and water) (see figure 1) 1.
www.biosensing.net/EBLA/biotxt.htm
1/11
18/08/13
On line glucose monitoring
Figure 1: Flow sheet of the depuration process of waste whey Lactose can be enzymatically hydrolysed to more digestible, sweet and soluble sugars (glucose and galactose) which can be used in the farm to produce cheese or milk based specialities2. The enzymatic hydrolysis step is performed with a hollow-fibre membrane enzyme reactor3-7 (HFMER) on which b-galactosidase, the enzyme responsible of the b(1-4)glycoside breaking, is immobilised on the membrane support. All the steps of the process require the on line control of temperature, pressure, pH, flow rate. The b-galactosidase HFMER also requires the on line monitoring of the hydrolytic yield. Biosensors9-21 were recently used in process monitoring, in clinical9,12,19, environmental17-18 and food19-21 analyses. Recently the study of the same kind of HFMER7 was performed using a Yellow Spring Instruments Glucose Analyzer. A b-galactosidase plug flow reactor based on polyphenolformaldheyde beads8, packed in a column, was also studied using a Beckman Glucose analyser. Batch analyses were performed in both cases requiring sample dilution and pH adjustment. A continuous analyzer, based on an amperometric glucose biosensor, on the HFMER permeate flow stream is reported in this work for the lab scale preliminary studies of the hydrolytic step and for monitoring the pilot plant. The biosensor is assembled in a flow injection analysis (FIA) apparatus to obtain larger linearity range, quick response time, precision and accuracy required by the process.
Materials and Methods Lab Scale b-Galactosidase HFMER A polysulphone hollow fibre membrane (AMICON VitaFiber IIP30), was used to immobilise the bgalactosidase enzyme (EC 3.2.1.23, from Aspergillus oryzae, grade XI, 5.0+0.3 U/mg using lactose as substrate, SIGMA). The immobilisation of the enzyme was performed with bovine serum albumin(BSA)-glutaraldehyde procedure. This procedure was optimised considering the effects of the concentration of the glutaraldehyde (0.1-1.0% in citrate buffer 0.1 mol l-1), of the reaction time www.biosensing.net/EBLA/biotxt.htm
2/11
18/08/13
On line glucose monitoring
(0-24 hours) and of washing solutions on the enzyme activity (b-galactosidase) in batch conditions. 500 ml of a b-galactosidase solution (1 g l-1), 0.1% glutaraldehyde, BSA (0.5 g l-1), in citrate buffer (pH=4.5, 25 mmol l-1), was pumped (flow rate 1 ml min-1), using a backflusfhing configuration, into the hollow fibre membrane module (HFMM) recycling the permeate. After 6 hours the enzyme was completely retained in the HFMM because no activity was recovered in the permeate. In fact, in previous batch tests performed in the same conditions, no enzyme denaturation was observed. Therefore, the macromolecular cross-linked aggregates were physically entrapped in the external porous sponge of the polysulphone membrane (30,000 MWCO). Finally a washing solution of glycine (30 mmol l-1 in citrate buffer 25 mmol l-1, pH=4.5) was pumped into the HFMER to eliminate the excess of free glutaraldehyde and to quench the cross-linking reaction. With the obtained HFMER both standard solutions (lactose 4.75% in citrate buffer 25 mmol l-1, pH=4.5) and real samples (ultrafiltered whey with HFMM, MWCO=30,000 dalton) were used with a backflushing configuration. The composition of the ultrafiltered whey used is given in Table 1. Table 1: Selected whey components before and after MF and UF treatments Method
Before treat.
After treat.
Lactose
Biosensor
4.50% w/v
4.40% w/v
Fats
Rose-Gottlieb1
0.10% w/v
0.00% w/v
Proteins
Biuret
0.80% w/v
0.02% w/v
Free Calcium ion
Potentiometric, ISE2
n.d.
346 ppm
Total Calcium ion
Potentiometric, ISE3
n.d.
670 ppm
pH
Potentiometric
n.d.
4.600
1Gravimetric method with previous extraction in (C2H5)2O 2determined at pH=4.60 3determined at pH=2.25
Glucose Monitoring Apparatus An essential scheme of the apparatus is shown in figure 2.
www.biosensing.net/EBLA/biotxt.htm
3/11
18/08/13
On line glucose monitoring
Figure 2: Scheme of the Flow Injection Analysis (FIA) apparatus: 1.batch of buffer regeneration, 2.biosensor, 3.carrier buffer, 4.carrying circuit pump, 5.sampling loop (10 ml), 6.Rheodyne valve, 7.sampling circuit pump, 8.fraction collector, 9.feed (whey), 10.sample/standard switch, 11.standard, 12.bioreactor The glucose biosensor was obtained by coupling an amperometric H2O2 sensor (supplied by Idronaut, Brugherio, MI, Italy) with glucose oxidase enzyme (GOD, EC 1.1.3.4, from Aspergillus Niger, 125 U/mg, type V, SIGMA). The platinum electrode was polarised at +650 mV vs Ag/AgCl and covered by a cellulose acetate membrane (MWCO=100 dalton22) and a polycarbonate membrane (pore size=0.03 mm) on which the glucose oxidase enzyme was immobilised with the BSA-glutaraldehyde procedure. 10 ml of phosphate buffer (0.1 mol l-1, pH=7.0) containing GOD (1mg) and BSA (1 mg) were put on a circular (d=15 mm) polycarbonate membrane. After 1 hour the enzymatic membrane was washed in the same phosphate buffer and clapped on the tip of the H2O2 sensor with an o-ring. The resulting current on the platinum electrode was measured with a voltamperometer (Metrohm 641, Herisau SW). The F.I.A. apparatus consisted of a two-channels peristaltic pump (Gilson MiniPulse II), an HPLC valve (Rheodyne) with a 10ml loop and a carrier phosphate buffer pH=7.0, 0.1 mol l-1, 0.01% w/v NaN3 (to prevent bacterial growth). The sample was injected every 90 s. A teflon tube (2 m length, 1mm i.d.), connecting the injection valve to the detector, was used. The carrier buffer (3l) was recycled, using a close circuit, to perform long term monitoring sessions without manual operations. The high glucose concentration (45-110 mmol l-1) obtained with the HFMER (using 1.90-4.75% lactose solutions or the ultrafiltered whey) determined the quick increase of the glucose concentration in the carrier buffer. To prevent this problem a little bioreactor was put in the carrier buffer tank. A dialysis tube (MWCO=12,400 dalton, SIGMA) with glucose oxidase and catalase (both 1,000 units) was inserted in the carrier buffer tank. With the first enzyme conversion of glucose (coming from sampling) to gluconic acid and hydrogen peroxide takes place. The last one is converted, by catalase, in water and oxygen. In this manner a complete recycling of the carrier buffer was performed because of the consumption of glucose by the first enzyme and of www.biosensing.net/EBLA/biotxt.htm
4/11
18/08/13
On line glucose monitoring
H2O2 by the second one. pH variation due to gluconic acid formation is buffered with phosphate (0.1 mol l-1, pH=7.00). A two-point calibration procedure was used. The first point was the buffer (glucose concentration=0), while the second one was a glucose solution 150 mmol l-1. A three-way electrovalve and a timer are used to automate the calibration procedure. The calibration was performed every five hours. To control the data acquisition, sampling and calibration procedures, a GWBASIC program was developed. A 386 AT computer was used with a multichannel serial interface (Gilson 712). A Glucose Analyzer II apparatus (Beckman) was used as reference method for glucose batch analyses. This method, based on the same enzymatic reaction, consists in the amperometric measurement of the oxygen consumption due to the enzymatic oxidation of glucose in the samples. The use of an oxygen electrode, with a gas permeable membrane (supplied by Beckman), has permitted to evaluate if any interferences on the hydrogen peroxide sensor were present in the real matrices used. Results and Discussion The use of a Flow Injection system coupled with an oxidase enzyme based biosensor allows to increase the upper limit of detection (up to about 30 times), which, for the amperometric glucose biosensor is limited (not more than 1-5 mmol l-1) by oxygen content in solution. Flow injection analysis is a pulse technique that not reaches the steady state. For this reason glucose concentration on the biosensor surface remains very little for a little period of time, and the enzyme consumes less oxygen than in a steady state based device. Many parameters affect the sensitivity of this technique: the enzyme amount immobilized on the membrane, membrane thickness, substrate diffusion, residence time of the sample in the enzyme proximity. In figure 3, the calibration curve for the glucose sensor assembled in the FIA apparatus is reported. The linearity range is extended up to 150 mmol l1 of glucose with respect to a glucose biosensor working on steady state measurements.
Figure 3: Calibration curve for the glucose sensor assembled in the FIA apparatus. Flow rate 4.5 ml min-1. r2=0.9998, sensitivity= 0.237 + 0.005 nA mmol-1 l, coefficient of variation C.V.=+2%. A response peak is shown in figure 4. The sensor reaches 100% of response in 20 s and after 60 s is ready for another sample. www.biosensing.net/EBLA/biotxt.htm
5/11
18/08/13
On line glucose monitoring
Figure 4: Concentration-time curve for the glucose sensor assembled in the FIA apparatus (glucose 100 mmol l-1, carrier flow rate= 4.5 ml.min-1) Dispersion of the element fluid of the sample (10 ml), in the tube from the injection valve to the detector, was observed. Experimental conditions influence the dispersion magnitude of the sample in the carrier and measure precision. Many models describing dispersion phenomena are available 23-24. In this work, the axially dispersed plug flow model, was adopted25. In this model only the axial dispersion of the sample is considered while the radial dispersion is neglected. The following differential equation (1) is the analytical expression of the model:
(1)
t= time (sec) tm = mean residence time (sec) q = t/tm c(q)= glucose concentration (mmol l-1) at the time q I(q )= current (nA) at the time q u = linear velocity of the carrier in the tube (cm sec-1) L = tube lenght (cm) X = axial cohordinate (dimensionless) www.biosensing.net/EBLA/biotxt.htm
6/11
18/08/13
On line glucose monitoring
D = axial dispersion coefficient (cm2 sec-1) The solution of eq.(1) is the following:
(2) It represents a parametric curve family in which the dimensionless parameter D/uL, called dispersion number, determines the peak width. For values of this parameter near to zero a little dispersion occurs (plug flow), while, for increasing values, the dispersion determines larger and lower peak shapes. The dispersion number is joined to typical parameters of the concentration-time curve (figure 4): the variance (s2 ) and the mean residence time (tm):
(3) Therefore, determinated s2 and tm (s2 =47.7 sec2, tm=20 sec) from the experimental curve (fig.4), D/uL=0.050 was obtained solving eq.(3). The value of D/uL obtained corresponds to an intermediate grade of dispersion. Moreover, at the flow rate of the system (2-5 ml min-1), the Reynolds number is about 100 wich means that the system is in laminar flow condition.
Figure 5: Comparison of experimental data with the calculated C curve. In figure 5, a comparison of the experimental and calculated from eq.(2) (with D/uL=0.050, tm=20 sec) concentration-time curves is shown. Since the used model describes well the experimental peak shape and since it does not consider the interaction of the sample with the detector, it can be concludeded that, in this system, the dispersion of the injected fluid element principally occurs into the teflon tube from the injection valve to the biosensor. The sample interaction with the detector (glucose biosensor) only influences the peak intensity (sensitivity) but does not contribute to the dispersion. In figures 6 baselines of the biosensor are reported in a 12 hours experimental session with or without www.biosensing.net/EBLA/biotxt.htm
7/11
18/08/13
On line glucose monitoring
regeneration of the carrier buffer (performed with glucose oxidase and catalase enzymes in the dyalisis tube). In curve a, the recycling of the carrier buffer was performed without the regeneration system. Glucose coming from the sample (10 ml of glucose solution 118 mmol l-1injected every 90s) reached the carrier buffer tank and therefore baseline value rapidly increases reaching the upper limit of detection of the glucose biosensor. A total loss of sensitivity of the sensor was observed. In curve b, the recycling and the regeneration of the carrier buffer was operated: the baseline remained pratically the same and no loss of sensitivity was observed.
Figure 6:Comparison of baselines obtained with (b) or without (a) regeneration of the recycled carrier buffer The sensitivity of the sensor remained very stable in long term experimental session with standard solutions and real matrices too as a consequence of the regeneration system, the little sample volume, the elimination of the microbial charge and the reduction of fat and protein concentration obtained in the MF and UF steps of the whey treatment process. In fact the macromolecular aggregates of fats and proteins generally have a large influence on biosensors sensitivity and lifetime because of a rapid fowling of the membranes and bacterial growth. In figure 7 a monitoring session of about 7 hours is reported. Calibrations performed every 5h can also be observed. Figure 8 shows the yield obtained with the HFMER in the hydrolysis of lactose with standard solution (lactose 1.9%) and ultrafiltered whey (lactose 4.4%) monitored with the automated glucose system using the same biosensor for approximately three months. The recorder output of the monitoring session (2,000 h) is reported together with the batch analyses performed with the reference method. The method was compared with the reference one obtaining about +1% accuracy.
www.biosensing.net/EBLA/biotxt.htm
8/11
18/08/13
On line glucose monitoring
Figure 7: Example of a monitoring session. HFMER feeding solution: lactose 4.75%, cytrate 25 mmol l-1, temp=30°C, feed flow rate=1 ml min-1. Higher peak are due to a standard solution of glucose. (150 mmol l-1) Figure 8:Yield of the HFMER monitored with the glucose system. Squares represent the results of the batch analyses with the reference method. Both standard solution of lactose (1.9%, in cytrate buffer 25 mmol.l-1, pH=4.5) and ultrafiltered whey (lactose 4.4%) were used as substrates to feed the HFMER (temp=30°C, feed flow rate=1 ml.min-1). Conclusions The availability of a reliable monitoring system for the hydrolysis step of the waste whey treatment is essential to control and modulate the hydrolysis yield. In this work a glucose biosensor has been assembled in a FIA optimized apparatus obtaining on line monitoring of a lab scale HFMER. With this device useful informations about HFMER behaviour were obtained. Results of this study had permitted to verify and experimentally confirm a mathematical model of the HFMER26. Following the promising results obtained at lab scale, the analytical system discussed in this work will be used to control the hydrolysis step in the pilot plant for waste whey treatment. The good performances of it can be attributed to the little dispersion of the fluid element of the sample in the carrier buffer. This result is important from an analytical point of view because of good measure precision (coefficient of www.biosensing.net/EBLA/biotxt.htm
9/11
18/08/13
On line glucose monitoring
variation C.V.=+2%), extended linearity (up to 150 mmol.l-1), quick response time (20 s), good analysis rate (40 samples/h), low sample consumption (10ml sample-1, 400ml h-1) and long term automatic monitoring sessions (three months) obtained. The last performance was due to the use of an original enzyme based regeneration of the carrier buffer in the FIA apparatus. The system could be expanded with additional sensors and used to control fermentation processes: studies on lactose and lactic acid are in progress. References 1. M.Pizzichini, L.Mentuccia, presented at "Convegno del gruppo scientifico Italiano Studi e Ricerche" Milan, February 11-14 (1992) 2. T.Sienkiewicz and C.L.Riedel. Whey and Whey Utilization, 2nd Ed. (1990), Publisher V.T.Mann, GelsenKirchen-Bur,Germany 3. M.Pizzichini, F.Beone, A.Fortunato and R.Pilloton. presented at ICOM 90 Chicago, August 1990 4. G.R. Belfort: Biotech.Bioeng., 33,1047-1066 (1989) 5. W. Marconi: Reactive polymers, Vol. 11, 1-19, (1989) 6. D.E. Kohlwey and M. cheryan: Enzyme Microb. Techn.,Vol.3, 64-68, (1981) 7. C.K.S.JONES, R.Y.K: YANG and E.T.WHITE: AIChE Journal Vol.34, 2, 293-304 (1988) 8. S.T. Yang, M.R. Okos: Biotech.Bioeng 33,873-885 (1989) 9. G.PALLESCHI.: pp. 5-18. Medical system, Genova (1989). 10. P. VADGAMA, and P. W. CRUMP: Analyst 117, 1657-1670 (1992). 11.J. JANATA: Analytical Chemistry, 64, 196R-219R (1992). 12.I. J. HIGGINS, G. HALL and A. SWAIN: Trends in analytical chemistry 8, 12-19 (1989). 13.J. E.FREW and H. A. O. HILL: Biochimica clinica, 13, 1209-1216 (1989). 14. G. G.GUILBAULT and J. H. LUONG: Selective electrode review 11, 3-6 (1989). 15.M. A.ARNOLD and M. E. MEYERHOFF: CRC Critical Review in Analytical Chemistry 20, 149-159 (1988). 16. J. M.KAUFFMANN, G. G. GUILBAULT: Bioanalytical Applications of Enzymes, Vol. 36, (ed. C. H. Suelter), pp. 63-113. John Wiley & Sons, Inc (1992). 17.B.MATTIASSON,:"BFE" 8, 740-745 (1991). 18. K. R.ROGERS, and J. N. LIN: Biosensors Bioelectronics 7, 317-321 (1992). 19. m.Mascini, D.Moscone, G.Palleschi and R.Pilloton, Anal.Chim.Acta 213 (1988)101-111 www.biosensing.net/EBLA/biotxt.htm
10/11
18/08/13
On line glucose monitoring
20.R.Pilloton., M.Mascini, I.G. Casella, M.R.Festa and E.Bottari, Anal. Lett. 20,(1987),1803 21.R.Pilloton and M.Mascini, Food Chemistry 36 (1990) 213-222 22.T.Tsuchida and K.Yoda, Clin.Chem. 29,135,(1983) 23.D.Betteridge, Anal Chem. 50-9 (1978) 832-846 24.R.DeLon Hull, R E.Malick and J.G.Dorsey, Anal Chim. Acta 267 (1992) 1-24 25.O.Levenspiel, Chemical Reaction Engineering, 2nd Ed., John Wiley & Sons Inc., N.Y. (1972) 26.A.Fortunato, G.Mignogna, R.Pilloton and M.Pizzichini: data to be published
www.biosensing.net/EBLA/biotxt.htm
11/11