CLINICAL CHEMISTRY, Vol. 29, No. 6, 1983 1127. 8. Fausa 0. Quantitative determination of serum bile acid using a purified 3a-hydroxysteroid dehydrogenase.
8. Fausa 0. Quantitative determination of serum bile acid using a purified 3a-hydroxysteroid dehydrogenase. Scand J Gastroenterol 10, 747-752 (1975). 9. Javitt NB, Budai K, Shan P-Y, Siskos DA, Cahill P. Enzymatic analysis of bile acids. In Biological Effects of Bile Acids, G Paumgartner, A Stiehi, W Gerok, Eds., MTP Press, Lancaster, U.K.,
1979, pp 267-271. 10. Murphy GM, Billing BH, Baron DN. A fluorimetric
and enzymatic method for the estimation of serum total bile acids. J Clin Pathol 23, 594-598 (1970). 11. Mashige F, Imai K, Osuga T. A simple and sensitive assay of total serum bile acids. C/in Chim Acta 70, 79-86 (1976). 12. Nicolas JC, Chaintreuil J, Descomps B. Enzymatic microassay of serum bile acids: Increased sensitivity with an enzyme amplifica-
tion technique. Anal Biochem 103, 170-175 (1980). 13. Lovgren T, Thore A, Lavi J, et al. Continuous monitoring of NADH converting reactions by bacterial bioluminescence. J Appi Biochem
4, 103-111 (1982).
14. Stanley PE. Quantitation of malate, oxaloacetate and malate dehydrogenase. In Methods in Enzymology 57, Bioluminescence and Chemiluminescence,
MA DeLuca, Ed., Academic
Press, New York,
NY, 1978, pp 181-188. 15. Brolin SE. Attempts to simplify the analytical performance in micro assay of metabolites with bacterial luciferase. Bioelectrochem Bioenerg 4, 257-262 (1977). 16. Haggerty C, Jablonski E, Stay L, DeLuca M. Continuous monitoring of reactions that produce NADH and NADPH using immobilized luciferase and oxidoreductases from Beneckea harveyi. Anal Bloc/rem 88, 162-173 (1978). 17. Agarwal DP, Stapelfeldt H, Meier-Tackmann D, Goedde 11W. A sensitive bioluminescent assay of alcohol dehydrogenase in human
CLIN. CHEM. 29/6, 1127-1131
serum and tissue extracts. Fresenius Z Anal C/rem 311-374(1982). 18. Carter TJN, Kricka U, Whitehead TP. The bioluminescent determination of substrates using NAD-dependent oxidoreductase enzymes. Protides Biol Fluids Proc Colloq 26,643-646(1979). 19. Ford J, DeLuca M. A new assay for picomole levels of androsterone and testosterone using co-immobilized luciferase, oxidoreductase and steroid dehydrogenase. Anal Bloc/rem 110, 43-48 (1981). 20. Steensland H. An automated method for the determination of total bile acids. Scand J Clin Lab Invest 38, 447-455 (1978). 21. Duane W, Hastings JW. Flavin mononucleotide reductase of luminous bacteria. Mol Cell Biochem 6, 53-64 (1975).
22. Siskos PA, Tzouwara SM, Philianos SM. Spectrofluorometric determination of kinetic parameters of bile acids with 3a-hydroxysteroid dehydrogenase from mutant Pseudomonas testosteroni. Anal Left 13 (B18), 1589-1606 (1980). 23. Lundin A, Styrelius I. Sensitive assay of creatine kinase isoenzymes in human serum using M subunit inhibiting antibody and firefly luciferase. Clin Chim Acta 87, 199-209 (1978). 24. Bjorkhem I, Amer P, Thore A, Ostman J. Sensitive kinetic bioluminescent assay of glycerol release from human fat cells. J Lipid Res 22, 1142-1147 (1981). 25. Sk#{226}lhegg BA. On the 3a-hydroxysteroid dehydrogenase from Pseudomonas testosteroni. Purification and properties. Eur J Bioc/rem 46, 117-125 (1974). 26. Barth CA, Wirthensohn K. Enzymatic determination of bile acids from liver cells with 3a-hydroxysteroid dehydrogenase-a warning. J Lipid Res 22, 1025-1027 (1981). 27. Roda A, Kricka U, DeLuca M, Hofmann AF. Bioluminescence measurement of primary bile acids using immobilized 7a-hydroxysteroid dehydrogenase: Application to serum bile acids. J Lipid Res
23, 1354-1361 (1982).
(1983)
Automated Particle-Counting Immunoassay of C-Reactive Protein and Its Application to Serum, Cord Serum, and Cerebrospinal Fluid Samples D. Collet-Cassart,1J. C. Mareschal,’
C. J. M. Sindic,1’2J. P. Tomasi,3 and P. L Masson1’4
The assay for C-reactive protein has been fully automated
as
a particle-counting immunoassay. For cerebrospinal fluid, cord serum, and adults’ serum its range of sensitivity extends from 1 ig/L to 300 mg/L, with a minimal sample dilution of twofold and a maximal
dilution of 50-fold being required.
This
range is so broad because free antibodies are added to the reaction medium. However, we have used Fab fragments rather than whole antibody to avoid too steep a standard curve and a decrease of agglutination at high concentrations of antigen. For 99 consecutive cord sera examined, the concentrations of C-reactive protein ranged from 7 g/L to 1.750 mg/L. The geometric mean was 50 g/L and the upper normal limit (geometric mean ± 2 SD of the log values) was established at 525 g/L. Additional Keyphrases: reference interval
Fab fragments
‘Unit of Experimental Medicine, International Institute of Cellular and Molecular Pathology, Avenue Hippocrate 75, B-1200 Brussels, Belgium. 2 Charg#{233} de Recherches au Fond National de la Recherche
Scientifique. Laboratory of Immunology, Hopital Universitaire Saint-Luc, 1200 Brussels, Belgium. 4 whom correspondence should be sent. Received Jan. 24, 1983; accepted March 28, 1983. #{176}
B-
We have described elsewhere (1) a highly sensitive nonisotopic, automated immunoassay based on latex agglutination. Called “PACIA” (Particle Counting ImmunoAssay), its unique features are: instrumental reading of agglutination by optical counting of residual nonagglutinated particles, and various procedures that have been incorporated to avoid interference by factors causing nonspecific agglutination or inhibition.5 For the determination of proteins, latex is coated with antibody and the antigen is assayed by virtue of its agglutinating activity. Here we report the use of PACIA to determine C-reactive protein (CRP), an application that illustrates how the range of sensitivity of PACLA may be extended for high concentrations. CRP is made up of five identical subunits, each with a relative molecular mass of 23 000, noncovalently associated in a disc-like configuration with cyclic pentameric symmetry (2). This protein has binding specificity for the phosphocholine determinant of cell wall C-polysaccharide from Streptococcus pneumoniae and various polycations. When bound to polysaccharides, CRP can activate the classical Nonstandard abbreviations: PACIA, particle-counting immunoassay; CRP, C-reactive protein; CSF, cerebrospinal fluid; GBS, glycine-buffered saline; IgG, E, and M, immunoglobulins G, E, and M; PEG, polyethylene glycol; DIAS, dilutor-incubator-agitator-
sampler module. CLINICAL CHEMISTRY, Vol. 29, No. 6, 1983 1127
pathway of complement (3) and favor their ingestion by leukocytes (4). This property may explain the protective role of CRP in response to certain bacterial infections (5). The concentration of CRP in the serum of healthy adults ranges from 0.07 to 8 mg/L (6, 7), but during inflammation its concentration can reach 500 mg/L in the acute-phase response (8). For measuring concentrations greater than 1 mgtL, immunoprecipitation (9) and usual latex agglutination techniques (10) are sensitive enough and therefore are suitable for routine measurements of CRP, to detect or monitor an inflammatory reaction. However, a more sensitive technique would certainly be interesting for some clinical investigations, and several authors have described radioimmunoassay of CRP (6, 11). One may envisage at least three applications in which sensitive assays would be useful:(a) in serum of children with recurrent infections, to detect a possible CRP deficiency (12); (b) in cord serum (7), to detect prenatal infection in situations such as premature delivery or rupture of membrane, when neonates are more exposed to infections; and (c) in cerebrospinal fluid (CSF), in which our preliminary studies indicate bacterial meningitis can be distinguished from other disorders of the central nervous system by a decrease in the ratio of CRP concentrations in CSF/serum. In cord serum the CRP concentration can be as low as 10 pg/L (7) and in the CSF, as we shall show, 2 fragments, or their F(ab) fragments. CRP standards: Contents of reference sera from Behringwerke (lot 042013D) and Hyland (LAS-R multiparameter reference serum B, lot OBO3A01C) containing, respectively, 80 and 40 mg of CRP per liter were found to agree with their stated values and hence were used interchangeably. Standards were prepared by dilutions of the reference serum in
GBS-.bovine serum albumin. However, for the assay in CSF, the diluent contained less bovine serum albumin, 0.1 g/L instead of 10 g/L, because of the low protein concentration of CSF. Equipment The equipment consists of a special module called DIAS (Dilutor-Incubator-Agitator-Sampler), a proportioning pump, an optical cell counter electronically modified to count only unagglutinated particles, and a recorder-all from Technicon Instruments Corp. However, further development and commercialization of the technique will be undertaken by Acade, s.a., B-1200 Brussels, Belgium. The basic equipment, described elsewhere (1, 13, 14), has recently been modified to permit automated pretreatment of samples for the determination of haptens and additional predilution steps (Figure 1). Moreover, a minicomputer (HP 85; Hewlett-Packard, Brussels, Belgium) now controls all operational parameters on DLAS, monitors performance, and prints out the concentration values automatically. Samples Serum samples (50-100 pL), centrifuged for 5 mm at 5000 rpm to remove any large particulate material, were poured into cups put into the inner row of DIAS and diluted automatically with GBS-PEG, either 50-fold for sera from adults or 10-fold for cord-blood sera. The cups containing CSF samples, which were used without centrifugation, were put into the middle row of DIAS, which diluted the samples twofold with GBS-PEG. The rest of the analytical procedure was as detailed in the manufacturer’s instructions.
Results Calibration
I
0 I
50
40 30 20 COP
irnqIL)
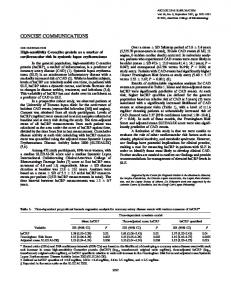
Fig. 2. Calibration curves of the assay of CRP by PACIAin the presence of anti-CRP IgG with (C)) or without (#{149}) papain treatment Two concentrationsof whole lgG and papain-digestedlgG. 15 mg (left curve of each pairof curves)and 23 mg (rightcurve) per milliliter of additive, were used. The curvewith open circleswas obtainedwithoutadditionof free antibodies
tionally high value in clinical settings, while the small loss of maximum agglutinability did not affect markedly the dynamic range (Figure 2). The difference between the results obtained with whole antibody or with the Fab fragments of the antibody was probably related to the monovalency of the fragments rather than to the loss of the Fe fragment, because addition of bivalent fragments [F(ab’)2 fragments] had the same effect as that produced by whole antibody.
Assay of CRP in Serum Serum samples were assayed at 10-fold dilution (for cordand 50-fold dilution (for serum from adults). For cord sera the reaction medium was devoid of anti-CRP Fab-fragments, whereas the additive for the assay in adult sera was supplemented with the monovalent antibodies (equivalent of 28 mg of IgG per liter of additive). Analytical recovery: CRP was assayed in 10 cord sera with concentrations lower than 40 g/L. The samples were then supplemented with 20, 50, and 100 g of CRP per liter. Analytical recoveries were 91.5, 100.2, and 100.7% for thes three groups of samples (Table 1). Correlation with immunonephelometry. Patients’ sera were assayed both by PACIA (y) and by immunonephelometry (x) (Disc 120; Travenol International Services Inc., Brussels, Belgium). The correlation coefficient (r) for 105 samples containing CRP in concentrations ranging from 10 to 250 mg!L was 0.97; the regression equation was y =
blood serum)
-9.34 + 1.04x (Figure 3). Results for CRP in cord serum. For 99 consecutive samples of cord serum, CRP concentrations ranged from 7 ig/L
curves
A plot of peak heights or number of free particles vs the log of CRP concentration formed a decreasing sigmoidal curve, extending from 1 to 100 1u.gfL, beyond which the curve was too flat to be usable (Figure 2). To extend the range of sensitivity, we added anti-CRP IgG antibodies to the additive. As a result (Figure 2), the curve was shifted to higher antigen concentrations, and at maximal agglutination the number of residual free particles was substantially lower than in the absence of free anti-CRP antibodies. However, the slope of the curve was steeper and the antigen excess caused a decrease of agglutination with lower concentrations of CRP. When Fab-fragments of the IgG antibodies were used in place of the whole IgG, the curves were also shifted to higher concentrations of CRP, but they remained essentially parallel to those obtained without free antibody. The decrease of agglutination due to antigen excess occurred when concentrations of CRP exceeded 400 mgfL, an excep-
Table 1. Analytical Recovery of C-Reactive Protein CRP
concn, pqIL Mean(and SD)
No. samples
Added
Cerebrospinal fluid 15 15
15
Recovered
Mean(and SD) % recovery
7
7.2 (1.2)
102.8 (17.4)
8
8.6
108
31
(1.6)
35.2 (1.9)
(18.7)
113.5 (5.5) 124.0 (10.4)
15 34 42.3 (4.4) Cord sera 10 20 18.30 (3.85) 91.5 (21) 10 50 50.10 (4.97) 100.2 (9.9) 10 100 100.70 (8.83) 100.7 (8.8) One volumeof the diluted CAP reference serum was added to one volume of CSF or to nine volumes of cord serum. The initial concentrationsof CAP varied from