Automated Site Plan Extraction from TLS Point Clouds Carmen MÜLLER, Tobias K. KOHOUTEK and Pascal W. THEILER, ETH Zurich, Switzerland
Key words: Engineering surveying; Geographic information system/GIS; Implementation of plans; Laser scanning; cultural heritage
SUMMARY Laser scanning is an efficient method to document archaeological sites. However, tools for processing geo data like GIS or CAD often cannot handle the huge amount of resulting points. Our presented approach shows how point clouds can be processed automatically to reduce the amount of data and obtain an optimal input of the object of interest for GIS analysis. Furthermore, our algorithm allows the automated detection of the main site geometries. The obtained results depend strongly on the surroundings of the respective site. Different point clouds were processed with the conclusion that some implemented parameters cannot be assigned generally. The user can adapt the parameters within the software implementation to the respective site and optimize the result. In areas without disruptive objects, constructions are determined with a precision of a few centimeters. Our approach is based on the fact that in a two dimensional, horizontal histogram the amount of points lying in a histogram bin is higher on vertical planes than on horizontal ones. Due to the fact that the objects of interest consist mainly of vertical elements, this circumstance can be exploited. The histogram image is transformed into a binary image using a variable threshold. This step eliminates all locations with a low point density. Nevertheless, some objects like plants also appear in the image, due to their high density in vertical dimension. Relevant constructions appear as straight or curved lines in the horizontal image and can be filtered out with respect to their geometrical characteristics. The result is further improved and then converted into a shapefile.
TS09D - Laser Scanners III, 5655 Carmen Müller, Tobias K. Kohoutek and Pascal W. Theiler, ETH Zurich Automated Site Plan Extraction from TLS Point Cloud FIG Working Week 2012 Knowing to manage the territory, protect the environment, evaluate the cultural heritage Rome, Italy, 6-10 May 2012
1/1
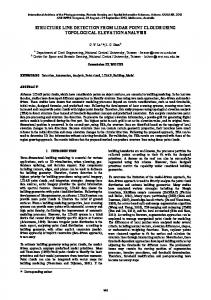
1. INTRODUCTION The main objective of archaeological survey is a precise and detailed documentation of the status quo of the surveyed scene, like the archaeological site and objects. The documentation constitutes the base for its maintenance and administration, as well as to undertake any type of measurement or intervention to preserve, protect and restore or present it to the general public (Drap et al. 2003, Mancera-Taboada et al. 2009). The archeologists’ qualification, interest and condition influence very often the quality of the conventional recording of an archaeological site (Sulaiman et al. 2011). Three dimensional data is getting cheaper and is becoming more and more an important information source for decision making. Laser scanning has become an efficient and affordable measuring method for obtaining 3D information. Acquired 3D models from laser scans and GIS techniques play a major role for archaeological documentation and preservation. The high point density, the short acquisition time and the achievable accuracy allow a detailed documentation of objects. Neubauer et al. (2008) see the laser scanner becoming a tool for high resolution 3D recording of excavations. In combination with digital photography (Ressl 2007, Gruen 2009, Ergun 2010, Sulaiman 2011) a high level of detail for texture can be obtained, which is also an important property for archaeological applications. However, data post-processing is a relatively time-consuming and complicated procedure (e.g. in Schaich 2007). This work shows how acquired point clouds can be processed automatically to reduce the amount of data and obtain an ideal input for GIS analysis. It is part of achieving a workflow enabling the integration of laser scanning data into a 3D GIS for the documentation of an archaeological site. GIS in combination with databases give the possibility to visualize and organize the data directly and perform queries in respect to geometry or other attributes. GIS technology will show the exact location of the archaeological site and all the monuments and their distribution within the site (Al-Hanbali et al. 2006). Maps can be created and examined, upcoming questions can be solved regarding the data and new questions can be formulated. A GIS supports the development of new knowledge of the excavation (Valenti 2000). In addition, CAD software enables 3D views. Getting a good impression of the archeological site raster as well as vector and 3D data should be visualized commonly. 3D GIS allow the visualization of these data types and provide functions for additional analysis (Kirch 2010). Our test object (shown in Figure 1) was scanned completely with a terrestrial laser scanner at cm resolution. The building consists of several elements of different age and geometry. Ancient rectangular and circle structures are connected with modern walls.
TS09D - Laser Scanners III, 5655 Carmen Müller, Tobias K. Kohoutek and Pascal W. Theiler, ETH Zurich Automated Site Plan Extraction from TLS Point Cloud FIG Working Week 2012 Knowing to manage the territory, protect the environment, evaluate the cultural heritage Rome, Italy, 6-10 May 2012
2/2
Figure 1: Aerial Image Showing the Archeological Site
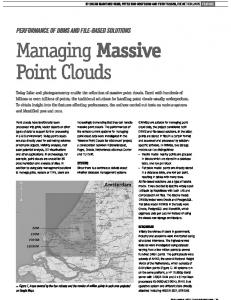
2. APPROACH Schleinkofer et al. (2006) describe an automated process resulting in product models of buildings for modification and retrofit. The authors developed a procedure to extract vertical elements automatically out of a laser scanning point cloud. The approach is based on the fact that in a two dimensional, horizontal histogram the amount of points lying in a histogram bin is higher on vertical planes than on horizontal ones. A similar approach is used in this work to extract structures for cultural heritage. The point cloud needs to be georeferenced (e.g. using GNSS) for spatial analysis in GIS. Out of this georeferenced point cloud a site plan is extracted as an input for further GIS analysis. 2.1 Preparation of the Histogram The georeferenced point cloud is provided in a text file. For efficient handling the point cloud density should be reduced considering the 3D distance of neighboring points. The following steps were carried out using three different point sampling distances (2.5, 5 and 10 cm). The optimal value for point density is evaluated. For our application height values can be ignored because only horizontal coordinates are of interest. For easier processing every 2D point coordinate is saved as a complex number with real part X and imaginary part Y. An empty matrix is initialized to serve as a density image with complex indices. For each point in the point cloud the respective pixel in the density image is evaluated. To minimize aliasing effects the distance between the points and midpoints of all pixels, belonging to a neighborhood with variable size, is calculated. The values of the weight matrix are computed in such a way that they are inversely proportional to the distances and normalized to the value 1. If a measured point is situated in the middle of a pixel, its full weight flows into that pixel. For comparison, the density image is computed with a resolution of 1 cm and 10 cm. The resulting grey value image is scaled by a multiple of the standard deviation for better visibility. Figure 2 shows an overview of the different results, depending on point sampling distance and resolution of the density image. TS09D - Laser Scanners III, 5655 Carmen Müller, Tobias K. Kohoutek and Pascal W. Theiler, ETH Zurich Automated Site Plan Extraction from TLS Point Cloud FIG Working Week 2012 Knowing to manage the territory, protect the environment, evaluate the cultural heritage Rome, Italy, 6-10 May 2012
3/3
Point Sampling Distance 10 cm
1 cm
5 cm
10 cm
Resolution of the Density Image
2.5 cm
Figure 2: Density Images with Different Inputs
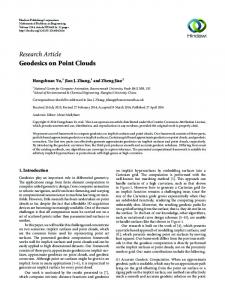
Density images with a resolution of 1 cm show many small structures, coherent lines are missing. When increasing the resolution to 10 cm coherent areas become visible and the computing time shortens. The authors found that a point sampling distance of 5 cm and an image resolution of 10 cm lead to optimal results. Boundaries are represented sharply and vertical elements are clearly visible. This image is the basis for the following steps (Figure 3). 2.2 Extraction of Elements Important elements are filtered out using segmentation algorithms. For the segmentation a criterion of homogeneity has to be specified. In this work coherent white pixels are connected to regions and therefore the grey value image has to be transformed into a binary image using a threshold (Figure 4).
TS09D - Laser Scanners III, 5655 Carmen Müller, Tobias K. Kohoutek and Pascal W. Theiler, ETH Zurich Automated Site Plan Extraction from TLS Point Cloud FIG Working Week 2012 Knowing to manage the territory, protect the environment, evaluate the cultural heritage Rome, Italy, 6-10 May 2012
4/4
In addition to elements belonging to the man-made structure, some other items with high vertical point density remain in the binary image (e.g. plants). For the extraction of the regions belonging to an object of interest, three criteria are defined which are based on common properties of buildings. • • •
Small sized regions are ignored. The area of curved walls is much smaller than the corresponding bounding box area. The major axis of the best-fit-ellipse of straight walls is much longer than the minor axis.
For every region these characteristics are computed and if the region is too small or does not fulfill the criterion for straight or curved walls it is discarded. The result depends strongly on the used threshold for creating the binary image. That is why this step is iteratively applied on binary images with different thresholds. The results of the iterations are combined. Consequently the result is improved and constraints can be set more rigorous.
Figure 3: Density Image
Figure 4: Binary Image
Figure 5: Filtered Binary Image
The resulting binary image (Figure 5) shows mainly elements of the site plan. The main geometry is obvious but disturbed by fragments of plants. Furthermore, interior and exterior TS09D - Laser Scanners III, 5655 Carmen Müller, Tobias K. Kohoutek and Pascal W. Theiler, ETH Zurich Automated Site Plan Extraction from TLS Point Cloud FIG Working Week 2012 Knowing to manage the territory, protect the environment, evaluate the cultural heritage Rome, Italy, 6-10 May 2012
5/5
walls are not connected (Figure 6). With the morphological operation of closing (dilatation followed by erosion) these two parts can be connected (Figure 7). The interpretation of the site geometry is thereby simplified, which is important for a follow-up GIS analysis.
Figure 6: Result before Closing
Figure 7: Result after Closing
Remaining holes in the walls can be filled automatically using closing operations. The site plan can be converted in to vector format by tracing the boundaries of the white areas and combining boundary points to a vector.
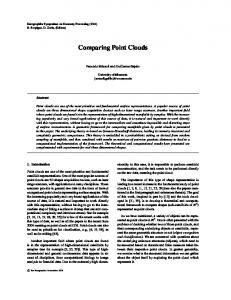
3. RESULTS Regarding our test data set only areas containing a part of a wall are left in the site plan. The main geometry is obvious but disturbed by fragments of plants. Based on five user-definable parameters, our software implementation is able to handle different surrounding conditions. Historical well defined walls can be extracted with an accuracy of 1 cm to 10 cm. Other less well defined walls can be extracted with an accuracy of 10 cm to 20 cm.
TS09D - Laser Scanners III, 5655 Carmen Müller, Tobias K. Kohoutek and Pascal W. Theiler, ETH Zurich Automated Site Plan Extraction from TLS Point Cloud FIG Working Week 2012 Knowing to manage the territory, protect the environment, evaluate the cultural heritage Rome, Italy, 6-10 May 2012
6/6
Figure 8: Comparison of Density Image, Automated Extraction (green) and Manual Interpretation (red)
Small walls with a height of just a few centimeters cannot be extracted automatically. The difference in vertical point density between these low walls and their surroundings is too small. In addition, parts of the vegetation cover cannot be eliminated automatically. Branches form dense networks and lie in intersection with the wall in the histogram image. For cleansed objects the described procedure results in correct site plans as illustrated in Figure 9 and Figure 10 that show an example of scanned interior rooms. In this case, the final result is a site plan that does not need further manual correction. No disruptive objects disturb the geometry of the rooms.
Figure 9: Mesh of Point Cloud Showing the Situation
Figure 10: Site Plan of an Interior Space
TS09D - Laser Scanners III, 5655 Carmen Müller, Tobias K. Kohoutek and Pascal W. Theiler, ETH Zurich Automated Site Plan Extraction from TLS Point Cloud FIG Working Week 2012 Knowing to manage the territory, protect the environment, evaluate the cultural heritage Rome, Italy, 6-10 May 2012
7/7
4. CONCLUSION The results show that this procedure is suitable for the automatic generation of a site plan under the condition that the relevant object consists of structures with vertical walls. All independent objects which do not belong to the main structure are eliminated. The main geometry is clearly visible in the result. External objects which are spatially connected with the structure cannot be removed automatically by the current implementation. Several tests proved that this procedure works in cleansed areas and with sufficiently high walls. For starting this procedure no initial work has to be done. Georeferenced scans just need to be thinned out, which can be done automatically. The resulting object boundaries can be exported as a shapefile and imported into GIS for further analysis. The extracted site plan can be extruded for possible height reconstruction purposes. The raw data of the laser scanner can also be used to generate 3D models of the actual state of the finding spot. This information in combination with the site plan can be used to visualize the present situation and reconstruct the original state of the finding spot. Furthermore this work shows that laser scanning data offers products of value for archaeology. With our approach archaeologists are able to more efficiently exploit the advantages of laser scanners as well as GIS. Laser scanning contactless digitizes objects in high resolution and with texture. On the other hand, GIS offers the possibility to organize, visualize and analyze the data and thus new information can be gained.
REFERENCES Al-Hanbali, N., Al Bayari, O., Saleh, B., Almasri, H., Baltsavias, E., 2006, “Macro to Micro Archaeological Documentation: Building a 3D GIS Model for Jerash City and the Artemis Temple”, Innovations in 3D Geo Information Systems, Lecture Notes in Geoinformation and Cartography, Part 6, 447-468 Drap, P., Sgrenzaroli, M., Canciani, M., Cannata, G., Seinturier, J., 2003, “Laser scanning and close range photogrammetry: Towards a single measuring tool dedicated to architecture and archaeology”, CIPA XIXth International Symposium, Turkey Ergun, B., Sahin, C., Baz, I., Ustuntas, T., 2010, “A case study on the historical peninsula of Istanbul based on three-dimensional modeling by using photogrammetry and terrestrial laser scanning”, Environmental Monitoring and Assessment, Vol. 165, Numbers 1-4, 595-601 Gruen, A., 2009, “Virtual Archaeology – New Methods of Image-Based 3D Modeling”, New Technologies for Archaeology, Natural Science in Archaeology, Part V, 287-305 Kirch, S., 2010, “Archäoinformatik - Digitale Archäologie, Informationstechnologien und Visualisierungstechniken in der Archäologie“, Seminar Digital Humanities, University of Duisburg, Germany TS09D - Laser Scanners III, 5655 Carmen Müller, Tobias K. Kohoutek and Pascal W. Theiler, ETH Zurich Automated Site Plan Extraction from TLS Point Cloud FIG Working Week 2012 Knowing to manage the territory, protect the environment, evaluate the cultural heritage Rome, Italy, 6-10 May 2012
8/8
Mancera-Taboada, J., Rodríguez-Gonzálvez, P., González-Aguilera, D., 2009, “Turning Point Clouds into 3d Models: The Aqueduct of Segovia”, Computational Science and Its Applications – ICCSA, Lecture Notes in Computer Science, Vol. 5592/2009, 520-532 Neubauer, W., Doneus, M., 2008, ” Digital recording of stratigraphic archaeological excavations using terrestrial 3D laser scanners”, VIAVIAS, Vol. 2, 45-52 Ressl, C., 2007, “Reconstruction of the Pegasus Statue on Top of the State Opera House in Vienna using Photogrammetry and Terrestrial and Close-Range Laser Scanning”, Lasers in the Conservation of Artworks, Springer Proceedings in Physics, Vol. 116/VI, 535-542 Schaich, M., 2007, “From 3D Scanning to Analytical Heritage Documentation”, Lasers in the Conservation of Artworks, Springer Proceedings in Physics, Vol. 116/VI, 463-471 Schleinkofer, M., Schäfer, T., van Treeck, C., Rank, E., 2006, “Vom Laserscan zum planungstauglichen Produktmodell“, 17th International Conference on the application of Computer Science and Mathematics in Architecture and Civil Engineering, Weimar, Germany Sulaiman, N.S.B., Bin Majid , Z., Bin Setan , H., 2011, “Innovation in archaeological documentation methods”, Coordinates, Vol. VII/10, 27-34 Valenti M., 2000, “La piattaforma GIS dello scavo. Filosofia di lavoro e provocazioni, modello dei dati e soluzione GIS“, Archeologia e Calcolatori, Vol. 11/2000
BIOGRAPHICAL NOTES Carmen Müller was working on the automated extraction of archaeological sites during her master thesis in Geomatics and Planning at the ETH Zurich. The scientific researchers Tobias K. Kohoutek and Pascal W. Theiler of the Institute of Geodesy and Photogrammetry supported her.
CONTACTS Institute of Geodesy and Photogrammetry (IGP) ETH Zurich Wolfgang-Pauli-Str. 15 8093 Zürich SWITZERLAND Tel. +41 44 633 24 85 Fax +41 44 633 11 01 Email:
[email protected],
[email protected],
[email protected] Web site: http://www.igp.ethz.ch/ TS09D - Laser Scanners III, 5655 Carmen Müller, Tobias K. Kohoutek and Pascal W. Theiler, ETH Zurich Automated Site Plan Extraction from TLS Point Cloud FIG Working Week 2012 Knowing to manage the territory, protect the environment, evaluate the cultural heritage Rome, Italy, 6-10 May 2012
9/9