INTERNATIONAL JOURNAL OF OPTIMIZATION IN CIVIL ENGINEERING Int. J. Optim. Civil Eng., 2013; 3(2): 209-221
AUTOMATED SIZING OF TRUSS STRUCTURES USING A COMPUTATIONALLY IMPROVED SOPT ALGORITHM O. Hasançebia,,†, S. Kazemzadeh Azada, and S. Kazemzadeh Azadb Middle East Technical University, Department of Civil Engineering, Ankara, Turkey b Amirkabir University of Technology, Dept. of Civil and Env. Engineeing, Tehran, Iran a
ABSTRACT The present study attempts to apply an efficient yet simple optimization (SOPT) algorithm to optimum design of truss structures under stress and displacement constraints. The computational efficiency of the technique is improved through avoiding unnecessary analyses during the course of optimization using the so-called upper bound strategy (UBS). The efficiency of the UBS integrated SOPT algorithm is evaluated through benchmark sizing optimization problems of truss structures and the numerical results are reported. A comparison of the numerical results attained using the SOPT algorithm with those of modern metaheuristic techniques demonstrates that the employed algorithm is capable of locating promising designs with considerably less computational effort. Received: 15 January 2013; Accepted: 20 March 2013
KEY WORDS: structural design optimization; sizing optimization; truss structures; SOPT algorithm; metaheuristic techniques; upper bound strategy
1. INTRODUCTION Truss structures are distinguished as one of the most frequently used structural systems in practical applications. Wide industrial applications of trusses arise the need for optimum design of such structural systems using efficient structural optimization techniques. In general, optimum design of truss structures can be divided into three main categories as sizing, geometry, and topology optimization. In sizing optimization the cross-sectional areas
Corresponding author: O. Hasançebi, Department of Civil Engineering, Middle East Technical University, 06800, Ankara, Turkey † E-mail address:
[email protected]
210
O. Hasançebi, S. Kazemzadeh Azad and S. Kazemzadeh Azad
of structural members are considered as design variables. In geometry (or shape) optimization, the best positions of a selected group of joints in a structure are determined. In both the aforementioned optimization categories topology of a structure is assumed to be fixed. However, it is sometimes more expedient to search for the optimum topology of a structure, which entails considering the presence or absence of structural components, such as elements and nodes. The present study covers sizing optimization problems of truss structures under stress and displacement design constraints. During the past decades, stochastic search techniques or metaheuristics, such as genetic algorithms [1], simulated annealing [2], particle swarm optimization [3], ant colony optimization [4, 5], harmony search method [6], etc., have received increasing attention and found plenty of applications in structural optimization field. The rising popularity of these techniques arises from (i) the lack of dependency on gradient information; (ii) inherent capability to deal with both discrete and continuous design variables; and (iii) automated global search features to produce reasonable solutions for complicated problems. These advantageous features of metaheuristics make it possible to avoid cumbersome formulations frequently encountered with traditional optimization techniques, such as mathematical programming [7] and optimality criteria [8, 9] approaches. The state-of-the-art reviews of metaheuristics are outlined in Refs. [10, 11] considering their applications in the structural design optimization. In spite of many advantageous characteristics of the metaheuristic algorithms, the slow rate of convergence towards the optimum and the need for a high number of structural analyses are conceived as the downside of the search features of these techniques in structural optimization applications. It is generally known that response computations of designs sampled during a search process usually occupies 85-95% workload of a metaheuristic technique [12], and thus large number of structural analyses substantially increases the total computing time. Here, one solution to this is to reduce the total computational time by taking advantage of high performance computing methods, such as parallel or distributed computing techniques. The idea in this approach is to distribute the total workload of the optimization algorithm amongst multiprocessors of a single computer or within a cluster of computers connected to each other via local area network. In Hasançebi et al. [12] it is demonstrated that a maximum speedup ratio between 12.2 and 16.8 can be achieved for three design optimization instances solved using a cluster computing system consisting of 32 processors. Another approach, which is more straightforward and easier to apply, is to develop efficient strategies for diminishing the number of structural analyses required in the optimization process. The latter, can be performed through developing efficient optimization techniques capable of locating reasonable solutions using less computational effort. Recently, an upper bound strategy (UBS) is proposed in Kazemzadeh Azad et al. [13], where unnecessary structural analyses are avoided during the course of optimization through a simple and efficient mechanism. The key issue in the UBS is to identify those candidate solutions which have no chance to improve the search during the iterations of the optimum design process. After identifying those non-improving solutions, they are directly excluded from the design population without any structural analysis performed, resulting in a significant saving in computational effort.
AUTOMATED SIZING OF TRUSS STRUCTURES USING A ...
211
Besides the wide development of modern metaheuristic algorithms for structural optimization purposes, still there exists a great demand for easily understandable yet efficient optimization algorithms for practical applications. This is due to the fact that, in general, design engineers may not be very familiar with theoretical aspects of the available advanced metaheuristic algorithms in detail. Hence, simple optimization algorithms that are capable of locating solutions in an acceptable level of conformity with those of modern metaheuristics are beneficial for facilitating the wide use of optimization tools in real world structural design applications. In this regard, recently, an efficient yet simple optimization (SOPT) algorithm with two main steps, namely exploration and exploitation, is developed by the authors for engineering design optimization applications [14]. Besides the reasonable convergence speed of the algorithm, ease of understanding/implementation and less number of parameters required to execute the algorithm are among advantageous characteristics of the SOPT algorithm. In Ref. [14] efficiency of the SOPT algorithm is shown using two wellknown benchmark engineering optimization instances; namely optimum design of a welded beam and a pressure vessel. The present study attempts to apply the SOPT algorithm to optimum design of truss structures under stress and displacement design constraints. Furthermore, the computational efficiency of the technique is improved through avoiding unnecessary analyses during the course of optimization based on the recently proposed UBS. The efficiency of the UBS integrated SOPT algorithm is evaluated through several benchmark sizing optimization problems of truss structures and the numerical results are reported. A comparison of numerical results with those of modern metaheuristic techniques demonstrates that the SOPT algorithm is capable of locating promising designs with considerably less computational effort. The remaining sections of the paper are organized as follows. The second section provides the formulation of the design optimization problem. In the third section the SOPT algorithm is described in detail. The fourth section describes integration of the UBS with SOPT for reducing the computational effort in the design optimization process. The efficiency of the algorithm is investigated in the fifth section using some benchmark optimization examples of planar truss structures. A brief conclusion of the study is presented in the last section.
2. STATEMENT OF THE SIZING OPTIMIZATION PROBLEM The sizing optimization problems of steel trusses can be formulated as follows [15]: Find
X v1 , v2 ,..., v D , vmin,n vn vmax,n To minimize
Subject to
g i ( X)
n 1,2,..., D
(1)
f (X) W (X) (X)
(2)
i 1 0 i 1,2,..., NM ai
(3)
212
O. Hasançebi, S. Kazemzadeh Azad and S. Kazemzadeh Azad
d j ( X)
j 1 0 aj
j 1,2,..., ND
(4)
In Eq. 1, X is a candidate design, νmin,n and νmax,n are the lower and upper bounds of the n-th design variable νn and D is the total number of design variables. In Eq. 2, f(X) is the objective function (penalized weight of the structure), W(X) is the net weight of the structure, which is simply calculated by multiplying the volume of a structure by the density of constructional material, and Φ(X) is the penalty function employed for handling the constraints. In Eqs. 3 and (4), gi(X) and dj(X) are the stress and displacement constraints respectively, σi and σai are the computed axial stress in the i-th member and its allowable value, respectively, djand daj are the computed displacement in the direction of the j-th degree of freedom and its allowable value, respectively, NM is the total number of truss members and ND is the total number of active degrees of freedom. 2.1. Penalty function An appropriate constraint handling technique should be employed to satisfy the feasibility criteria of the designs generated in the course of optimization. In this regard, penalty functions are popular tools widely used for handling constraints. In the study the following penalty function proposed by Rajeev and Krishnamoorthy [16] is used:
(X) W (X). K . C NM
ND
C gi ( X) d j ( X) i 1
(5)
(6)
j 1
where K is a penalty constant used to adjust the intensity of penalization and C is the total amount of constraint violation for each candidate solution.
3. THE SOPT METAHEURISTIC ALGORITHM The steps in the implementation of the SOPT algorithm are outlined as follows. Step1. Initial population: Form an initial population by randomly spreading individuals (solutions) over all the search space in a uniform manner. This step is applied once. Step 2. Evaluation: The initial population is evaluated, where structural analyses of all individuals are performed with the selected cross sectional area value for design variables, and force and deformation responses are obtained under the applied loads. The objective function values of individuals are simply calculated from Eq. 2. Step 3. Saving the best solution: Keep the best individual found so far in a separate place or as a member of the population. Step 4. Standard deviation calculation: Compute the standard deviation of each design variable. The computed standard deviations can be considered as a measure of convergence
AUTOMATED SIZING OF TRUSS STRUCTURES USING A ...
213
for each design variable in the course of optimization. Step 5. Exploitation/exploration phase: The SOPT algorithm is composed of two main phases namely exploration and exploitation. In this algorithm the exploration and exploitation phases are performed one after another as follows. In each phase, generate new individuals around the best found solution using Eq. 7. Here, the i-th parameter of a new individual Xnew is generated as:
X new(i ) X best(i ) (exploit / exp lore ) Rand (i )
(7)
where Xbest is the best individual found so far, Rand(i) is a normally distributed random number with a mean of zero and a standard deviation of σ(i) which is equal to the standard deviation of the i-th design variables of all the members of the population (see Step 4) [17]. The balancing parameter λ is as a positive value controlling the balance between the exploration and exploitation characteristics of the SOPT algorithm. Typically for exploration and exploitation phases λ takes two different values, i.e. λexploit and λexplore, where λexploit can be selected equal to 0.5λexplore by which, in comparison to the exploration phase, the generation of new candidate solutions is more probable in the vicinity of the best solution. It is worth mentioning that the described exploration and exploitation formulations are considered based on a relative comparison between the aforementioned two phases in terms of the generated candidate solutions and do not imply a general definition for these two concepts. Step 6. Elitism: After each exploration/exploitation phase, replace the worst members of the population with the generated better new ones. A similar evolutionary scheme can be found in evolution strategies [18]. Step 7. Termination: Go to Step 2 until a termination criterion is met, which can be imposed as a maximum number of iterations or no improvement of the best design over a certain number of iterations.
4. IMPROVING COMPUTATIONAL EFFICIENCY OF SOPT The necessity for a large number of structural analyses involved in the optimization task can be addressed as a major drawback for almost all metaheuristic based structural design optimization algorithms. To this end, the computational efficiency of the SOPT algorithm is accelerated here by using the recently developed UBS method [13]. In the UBS, unnecessary structural analyses are avoided during the course of optimization through a simple, yet, efficient mechanism. The key issue in the UBS is to identify those candidate solutions which have no chance to improve the search during the optimum design process. After identifying those non-improving solutions, they are directly excluded from the structural analysis stage, reducing the total computational effort. In this strategy, after generation of a candidate solution X from the current best design in a usual manner, i.e. through application of Eq. 7. Then, in the first step the net weight W(X) of each candidate solution is calculated only; not the penalized weight. This computation is straightforward and can be done with a trivial computational effort. If a candidate solution
214
O. Hasançebi, S. Kazemzadeh Azad and S. Kazemzadeh Azad
has a net weight W(X) smaller than or equal to the penalized weight of the worst design of population f(Xworst), the structural analysis of the candidate solution is processed and its penalized weight is computed. In the opposite case, i.e. W(X)> f(Xworst), however, the upper bound rule is activated and the candidate solution is automatically removed from the population without undergoing structural analysis phase for response computations, since such a candidate solution is unlikely to replace any individual of the population in Step 6 of the SOPT algorithm. Apparently, the key factor in this approach is to define the penalized weight of the current worst solution of the population as an upper bound for the net weight of the newly generated candidate solutions. Thus, any new candidate solution with a net weight greater than this upper bound will not be analyzed and this will lessen the computational burden of the optimization algorithm. The main question here is the amount of saving in structural analyses through the proposed strategy. This is answered in the next section through benchmark examples of truss optimization.
5. NUMERICAL EXAMPLES In the present section the performance of the UBS integrated SOPT algorithm is investigated through well-known benchmark design optimization examples of trusses; namely a 10-bar truss, a 17-bar truss, and a 45-bar truss bridge. Since the first example is studied in two different cases, totally four different test cases are involved in this study. The population size in the SOPT algorithm is set to 50 and the value of balancing parameter in Equation (7) is set to 1.5 and 0.75 for exploration and exploitation phases, respectively. The value of penalty constant, K, for all the examples is taken as 1.5. Due to the stochastic nature of the technique, each design example is independently solved ten times using the SOPT algorithm and the best solution obtained is adopted for the sake of comparison. Here, the maximum number of iterations is considered as the termination condition, which is set to 100, 200, and 300 iterations for the first, second, third examples, respectively.
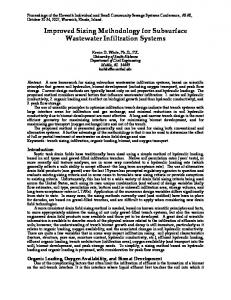
Figure 1. 10-bar truss structure, a = 360 in (914.4cm)
5.1. Example 1: 10-bar truss structure The sizing optimization of the 10-bar truss (Figure 1) is considered as the first design example. A total of 10 design variables are used corresponding to cross-sectional areas of
AUTOMATED SIZING OF TRUSS STRUCTURES USING A ...
215
the truss members. The members are subjected to the stress limits of 25 ksi (172.369 MPa) and the displacements of all nodes in both the lateral and vertical directions are limited to 2.0 in (5.08 cm). For the design purpose, two different load cases are considered (Figure 1) in two different test cases: case-1: P1 = 100 kips (444.82 kN) and P2 = 0, and case-2: P1 =150 kips (667.23 kN) and P2=50 kips (222.41 kN).The minimum allowable cross-sectional area of each member is limited to 0.1 in 2 (0.6452 cm2).The density of the material is 0.1 lb/in3 (2767.99 kg/m3) and the modulus of elasticity is 10,000 ksi (68,947.6 MPa). The optimum designs found by the SOPT algorithm are presented in Tables 1 and 2 in comparison to the formerly reported results in the literature. In Table 1 the feasible best (optimum) design located by the SOPT algorithm in case-1 is compared with the available results based on an adaptive real-coded genetic algorithm (ARCGA) [17], an artificial bee colony algorithm (ABC) [19], and a modified artificial bee colony algorithm (MABC) [19]. According to these results, the SOPT algorithm locates an optimum design weight of 5061.47 lb, which is very close to the minimum weight obtained by ARCGA. However, the number of structural analyses performed using the SOPT algorithm is only 3405, which is significantly less than those of the ARCGA (i.e. 10000), ABC (i.e. 20000), and MABC (i.e. 20000) algorithms. It should be noted that a total of 5000 structural analyses required by the SOPT algorithm in 100 iterations (when UBS is not employed) is reduced to 3405 analyses as a result of integrating the UBS with the SOPT algorithm. Table 1: Optimization results for the 10-bar truss structure (case-1) Design ARCGA MABC ABC [19] SOPT variables [17] [19] A1 30.5984 34.3057 30.6573 30.5156 A2 0.1002 0.1 0.1 0.1011 A3 23.1714 20.6728 23.0429 22.9003 A4 15.1958 14.5074 15.2821 15.224 A5 0.1 0.1 0.1 0.1007 A6 0.5409 0.6609 0.5626 0.5473 A7 7.4625 7.8696 7.4721 7.4854 A8 21.0346 20.3461 21.0084 21.0724 A9 21.5182 22.0232 21.5094 21.6934 A10 0.1 0.1 0.1 0.1 Weight (lb) 5060.9 5095.33 5060.97 5061.47 Analyses 10000 20000 20000 3405
As presented in Table 2, in case-2, the SOPT algorithm locates an optimum design weight of 4678.33 lb, which is very close to the minimum weight obtained by MABC. However, the number of structural analyses performed using the SOPT algorithm is only 3733, which is significantly less than those of the ARCGA (i.e. 10000), ABC (i.e. 20000), and MABC (i.e. 20000) algorithms. It should be noted that, a total of 5000 structural analyses required by the SOPT algorithm in 100 iterations (when UBS is not employed) is reduced to 3733 analyses as a result of integrating the UBS with the SOPT algorithm.
216
O. Hasançebi, S. Kazemzadeh Azad and S. Kazemzadeh Azad
Table 2: Optimization results for the 10-bar truss structure (case-2) Design variables A1 A2 A3 A4 A5 A6 A7 A8 A9 A10 Weight (lb) Analyses
ARCGA [17] 23.5986 0.1009 25.1175 14.5383 0.1001 1.9713 12.3923 12.7439 20.3697 0.1 4677.24 10000
ABC [19] 24.8143 0.1 26.0480 14.8772 0.1 2.0055 12.4467 12.6835 18.8669 0.1 4691.07 20000
MABC [19] 23.6383 0.1 25.3237 14.4108 0.1001 1.9707 12.3781 12.7739 20.2678 0.1 4677.06 20000
SOPT 23.5986 0.105 25.0415 14.2109 0.1001 1.9852 12.4958 13.0064 20.2979 0.1 4678.33 3733
Figure 2. Optimization history of the 10-bar truss example (case-1)
Figure 3. Optimization history of the 10-bar truss example (case-2)
The optimization histories showing the variation of the best penalized weight during the
AUTOMATED SIZING OF TRUSS STRUCTURES USING A ...
217
iterations of the SOPT algorithm is shown in Figures 2 and 3. 5.2. Example 2: 17-bar truss structure The 17-bar truss structure, shown in Figure 4, is chosen as the second sizing optimization example. As depicted in Figure 4, a single vertical load of 100 kips (444.82 kN) is applied at node 9. Here, the cross sectional areas of elements are considered as 17 sizing design variables, for which the minimum allowable value of each variable is 0.1 in 2 (0.6452 cm 2 ). The density of the utilized material is 0.268 lb/in 3 (7418.214 kg/m 3 ) and the modulus of elasticity is 30,000 ksi (20,6842.8 MPa). The members are subjected to the stress limits of 50 ksi (344.738 MPa) and displacement of all nodes in both horizontal and vertical directions is limited to 2.0 in (5.08 cm).
Figure 4. 17-bar truss structure, a = 100 in (254 cm)
Figure 5. Optimization history of the 17-bar truss example
The optimization history showing the variation of the best penalized weight during the iterations of the SOPT algorithm is depicted in Figure 5. In Table 3 the best design located by the SOPT algorithm is compared with the available results in the literature. According to
218
O. Hasançebi, S. Kazemzadeh Azad and S. Kazemzadeh Azad
these results, the SOPT algorithm locates an optimum design weight of 2582.09 lb, which is very close to the minimum weight obtained by ARCGA. However, the number of structural analyses performed using the SOPT algorithm is only 6617, which is significantly less than those of the ARCGA (i.e. 10000), ABC (i.e. 20000), and MABC (i.e. 20000) algorithms. It should be noted that, a total of 10000 structural analyses required by the SOPT algorithm in 200 iterations (when UBS is not employed) is reduced to 6617 analyses as a result of integrating the UBS with the SOPT algorithm. Table 3: Optimal cross sectional areas (in2) for the 17-bar truss Design variables
ARCGA [17]
ABC [19]
MABC [19]
SOPT
A1 A2 A3 A4 A5 A6 A7 A8 A9 A10 A11 A12 A13 A14 A15 A16 A17 Weight (lb) Analyses
15.891 0.105 12.101 0.1 8.075 5.541 11.97 0.1 7.955 0.1 4.07 0.1 5.705 3.975 5.516 0.1 5.563 2581.95 10000
12.9587 0.1 11.5965 0.1 6.3320 6.5356 12.4792 0.1 9.0901 0.1 5.1578 0.1 6.4197 4.0553 5.7984 0.1 6.8470 2642.45 20000
15.6762 0.1 12.0491 0.1 8.1312 5.62020 11.8822 0.1 8.0517 0.1 4.0912 0.1 5.6746 3.9864 5.6729 0.1 5.4907 2582.27 20000
15.7803 0.1 12.0897 0.1 8.0825 5.6171 11.9724 0.1004 7.9277 0.1013 4.0259 0.1023 5.6875 3.9905 5.5159 0.1 5.6292 2582.09 6617
5.3. Example 3: 45-bar truss bridge For the third example, sizing optimization of the 45-bar truss bridge shown in Figure 6 is carried out. Here, nine vertical loads of 10 kips (44.48 kN) are applied at nodes 3, 5, 7, 9, 11, 13, 15, 17 and 19. The stress limit is 30 ksi (206.843 MPa) in both tension and compression for all the members of the structure. The displacements of all nodes in both lateral and vertical directions are limited to 2.0 in (5.08 cm). The material density is 0.283 lb/in3 (7833.41 kg/m3) and the modulus of elasticity is 30,000 ksi (206,842.8 MPa). For design purpose, the members of the structure are linked into 23 groups (sizing design variables) taking into account the symmetry of the structure. The lower bound of all sizing variables is 0.1 in2 (0.6452 cm2).
AUTOMATED SIZING OF TRUSS STRUCTURES USING A ...
219
Figure 6. 45-bar truss bridge, a = 200 in (508 cm) Table 4: Optimal cross sectional areas (in2) for the 45-bar truss bridge Design variables G1 G2 G3 G4 G5 G6 G7 G8 G9 G10 G11 G12 G13 G14 G15 G16 G17 G18 G19 G20 G21 G22 G23 Weight (lb) Analyses
Members
ABC [19]
MABC [19]
SOPT
1, 44 2, 45 3, 43 4, 39 5, 41 6, 40 7, 42 8, 38 9, 34 10,36 11, 35 12, 37 13, 33 14, 29 15, 31 16, 30 17, 32 18, 28 19, 24 20, 26 21, 25 22, 27 23
5.4746 4.5989 4.1703 3.7872 0.1 4.1735 0.9497 1.5902 6.2656 2.2039 1.3925 0.1 0.1 9.0689 1.5310 1.6245 2.9146 0.1 9.0685 1.6352 0.1 4.4798 0.1 8267.21 40000
4.5996 3.7966 3.0497 3.2841 0.1069 3.9279 0.9649 1.2133 7.6553 2.1993 1.1929 0.1001 0.1008 9.5360 1.2173 1.4190 2.5513 0.1 11.5439 1.2807 0.101 3.7598 0.1017 7968.95 40000
4.6279 3.6981 3.202 3.3323 0.1003 3.9324 0.9287 1.2041 7.6821 2.24167 1.193 0.1004 0.1 9.36 1.2055 1.3068 2.5968 0.1001 11.7376 1.2362 0.1 3.7531 0.102 7968.59 9930
The optimization history showing the variation of the best penalized weight during the iterations of the SOPT algorithm is depicted in Figure 7. In Table 4 the optimum design located by the SOPT algorithm is compared with the available results in the literature. According to these results, the SOPT algorithm locates an optimum design weight of 7968.59 lb, which is slightly better than the minimum weight obtained by the MABC algorithm. However, the number of structural analyses performed using the SOPT algorithm is only 9930, which is significantly less than 40000 analyses carried out by the ABC and MABC algorithms. It should be noted that, a total of 15000 structural analyses required by
220
O. Hasançebi, S. Kazemzadeh Azad and S. Kazemzadeh Azad
the SOPT algorithm in 300 iterations (when UBS is not employed) is reduced to 9930 analyses as a result of integrating the UBS with the SOPT algorithm.
Figure 7. Optimization history of the 45-bar truss example
7. CONCLUSION In the present study, a recently developed metaheuristic technique so called SOPT algorithm is applied to sizing optimization of truss structures. The computational efficiency of the technique is enhanced through avoiding unnecessary analyses during the course of optimization using the UBS. The performance evaluation of the SOPT algorithm through benchmark sizing optimization examples reveals that the employed algorithm is capable of locating promising designs with considerably less computational effort. Besides the efficiency of the SOPT algorithm, ease of understanding/implementation and less number of parameters required to execute the algorithm are some advantageous characteristics of the SOPT algorithm.
REFERENCES 1. 2. 3. 4.
Goldberg DE, Samtani MP. Engineering optimization via genetic algorithm. Proceeding of the Ninth Conference on Electronic Computation, ASCE 1986; 471–482. Kirkpatrick S, Gerlatt CD, Vecchi MP. Optimization by simulated annealing. Science, 1983; 220: 671–80. Kennedy J, Eberhart R. Particle swarm optimization. In: IEEE international conference on neural networks, IEEE Press, 1995; 4: 1942–1948. Colorni A, Dorigo M, Maniezzo V. Distributed optimization by ant colony. In:
AUTOMATED SIZING OF TRUSS STRUCTURES USING A ...
5. 6. 7. 8. 9. 10. 11.
12.
13.
14. 15. 16. 17.
18. 19.
221
Proceedings of the First European Conference on artificial life, USA, 1991; 134–142. Dorigo M. Optimization, learning and natural algorithms, PhD thesis. Dipartimento Elettronica e Informazione, Politecnico di Milano, Italy, 1992. Lee KS, Geem ZW. A new structural optimization method based on the harmony search algorithm. Comput Struct, 2004; 82: 781–98. Erbatur F, Al-Hussainy MM. Optimum design of frames. Comput Struct, 1992; 45: 887–91. Tabak EI, Wright PM. Optimality criteria method for building frames. J Struct Div, ASCE, 1981; 107:1327–42. Saka MP. Optimum design of steel frames with stability constraints. Comput Struct, 1991; 41: 1365–77. Lamberti L, Pappalettere C. Metaheuristic design optimization of skeletal structures: a review. Computational Technology Reviews, 2011; 1–32. Saka MP. Optimum design of steel frames using stochastic search techniques based on natural phenomena: a review, in Topping BHV, (Editor), Civil Engineering Computations: Tools and Techniques, Saxe-Coburg Publications, Stirlingshire, UK, 2007; 105–147. Hasançebi O, Bahçecioğlu T, Kurç Ö, Saka MP. Optimum design of high-rise steel buildings using an evolution strategy integrated parallel algorithm. Comput Struct, 2011; 89: 2037–51. Kazemzadeh Azad S, Hasançebi O, Kazemzadeh Azad S. Upper Bound Strategy for Metaheuristic Based Design Optimization of Steel Frames. Adv Eng Software, 2013; 57: 19–32. Hasançebi O, Kazemzadeh Azad S. An efficient metaheuristic algorithm for engineering optimization: SOPT, Int J Optim Civil Eng, 2012; 2(4): 479–87. Kaveh A, Kalatjari V. Genetic algorithm for discrete-sizing optimal design of trusses using the force method, Int J Numer Meth Eng, 2002; 55(1), 55–72. Rajeev S, Krishnamoorthy C.S, Discrete optimization of structures using genetic algorithms. J Struct Eng, ASCE, 1992; 118 (5), 1233–50. Koohestani, K., Kazemzadeh Azad, S. An Adaptive real-coded genetic algorithm for size and shape optimization of truss structures, The First International Conference on Soft Computing Technology in Civil, Structural and Environmental Engineering, B.H.V. Topping, Y. Tsompanakis (Eds.), Civil-Comp Press, Stirlingshire, UK, 2009. Schwefel H-P. Numerical Optimization of Computer Models, Chichester, UK: John Wiley & Sons; 1981. Hadidi, A., Kazemzadeh Azad, S., Kazemzadeh Azad, S., Structural optimization using artificial bee colony algorithm, The 2nd International Conference on Engineering Optimization (Eng Opt), Lisbon, Portugal, 2010.