INTERNATIONAL JOURNAL OF OPTIMIZATION IN CIVIL ENGINEERING Int. J. Optim. Civil Eng., 2011; 1:15-28
OPTIMIZATION OF LARGE-SCALE TRUSS STRUCTURES USING MODIFIED CHARGED SYSTEM SEARCH
1
A. Kaveh1,*, † and S. Talatahari2 Centre of Excellence for Fundamental Studies in Structural Engineering, Iran University of Science and Technology, Narmak, Tehran-16, Iran 2 Marand Faculty of Engineering, University of Tabriz, Tabriz, Iran Iran
ABSTRACT Optimal design of large-scale structures is a rather difficult task and the computational efficiency of the currently available methods needs to be improved. In view of this, the paper presents a modified Charged System Search (CSS) algorithm. The new methodology is based on the combination of CSS and Particle Swarm Optimizer. In addition, in order to improve optimization search, the sequence of tasks entailed by the optimization process is changed so that the updating of the design variables can directly be performed after each movement. In this way, the new method acts as a single-agent algorithm while preserving the positive characteristics of its original multi-agent formulation. Received: January 2011; Accepted: April 2011
KEY WORDS: large-scale truss structures, charged system search, optimum design, particle swarm optimization.
1. INTRODUCTION Design optimization of structures is a challenging task for the designers and engineers who attempt to minimize the cost of the structure yet satisfying design constraints posed by the standard codes of practice. In general, this is a difficult problem since the relationships between design variables and optimization constraints are not straightforward. This becomes more complicated when the size of the problem increases, where the search space has a large *
Corresponding author: A. Kaveh, Centre of Excellence for Fundamental Studies in Structural Engineering, Iran University of Science and Technology, Narmak, Tehran-16, Iran † E-mail address:
[email protected]
16
A. KAVEH and S. TALATAHARI
size and a great number of design constraints must be controlled. Despite difficulties involved in obtaining optimum designs of large-scale structures, engineers have always attempted to have optimal structures [1]. The tools to fulfill this goal are optimization methods. However, classical optimization algorithms [2-8] for large-scale problems need many powerful computational systems. Furthermore, many of such algorithms are known as local optimizer and their final results cannot be considered as the global optimum. Contrary to mathematical programming algorithms, there are meta-heuristic algorithms which are often stochastic algorithms and can efficiently explore the search space of the large-scale problems. Charged System Search (CSS) is a new meta-heuristic optimization algorithm inspired by the governing laws of electrical physics and the Newtonian mechanics [9,10]. In electrical physics, the electric charge can generate the electric field and exerts a force on other electrically charged objects. The electric field surrounding a point charge is specified by the laws of Coulomb and Gauss. Utilizing these principles, the CSS algorithm defines a number of solution candidates each of which is called charged particle (CP) and is treated as a charged sphere. Each CP can exert an electrical force on the other agents (CPs). These forces can change the position of other CPs according to the Newton’s second law. Finally, considering the Newtonian mechanics, the new positions of CPs are determined. Application of the CSS on some structural problems reveals the good performance of this new method [10-12]. This paper presents a modified CSS algorithm for optimal design of large-scale truss structures. The proposed method combines the CSS with Particle Swarm Optimization (PSO) instead of the standard CSS formulation. Hybridization of CSS with PSO has recently been proposed by the present authors in Ref. [13]. The novelty of the present study is that the updating process of the algorithm's memory is changed directly after each movement. This is done in order to improve the performance of the optimization algorithm. Consequently, the new method works as a single agent algorithm yet preserving the positive characteristics of its original multi-agent formulation. Two examples of large-scale truss structures to be designed for minimum volume are considered in order to demonstrate the capability of the new algorithm in solving large-scale structural optimization problems.
2. FORMULATION OF THE TRUSS-STRUCTURE DESIGN OPTIMIZATION PROBLEM The general formulation of the weight minimization problem for a truss structure is as follows: n
minimize
W ({x}) i Ai Li i 1
subject to :
min i max min i max
i 1,2,...., n
i 0
i 1,2,...., nc
b i
Amin Ai Amax
i 1,2,...., m
i 1,2,...., ng
(1)
OPTIMIZATION OF LARGE-SCALE TRUSS STRUCTURES...
17
where W({x}) = weight of the structure; n = number of members making up the structure; m= number of nodes; nc = number of elements subjected to compression; ng = number of groups (number of design variables); i = material density of member i; Li = length of member i; Ai = cross-sectional area of member i chosen between Amin and Amax; min = lower bound and max = upper bound; i and i = stress and nodal deflection, respectively; ib = allowable buckling stress in member i when it is subjected to compression.
3. CHARGED SYSTEM SEARCH ALGORITHM 3.1. Description of the standard Charged Search System The Charged System Search (CSS) is a population-based search approach, where each agent (CP) is considered as a charged sphere with radius a, having a uniform volume charge density which can produce an electric force on the other CPs. The force magnitude for a CP located in the inside of the sphere is proportional to the separation distance between the CPs, while for a CP located outside the sphere it is inversely proportional to the square of the separation distance between the particles. The resultant forces or acceleration and the motion laws determine the new location of the CPs. The pseudo-code for the CSS algorithm can be summarized as follows: Step 1: Initialization. The initial positions of CPs are determined randomly in the search space and the initial velocities of charged particles are assumed to be zero. The values of the fitness function for the CPs are determined and the CPs are sorted in an increasing order. A number of the first CPs and their related values of the fitness function are saved in a memory, so called charged memory (CM). Step 2: Determination of forces on CPs. The force vector is calculated for each CP as
q q F j 3i rij i1 2i i2 arij pij ( Xi X j ) rij i ,i j a
j 1,2,..., N i1 1, i2 0 rij a
(2)
i1 0, i2 1 rij a
where Fj is the resultant force acting on the jth CP; N is the number of CPs. The magnitude of charge for each CP (qi) is defined considering the quality of its solution as
qi
fit (i) fitworst , fitbest fitworst
i 1,2,..., N
(3)
where fitbest and fitworst are the best and the worst fitness of all particles, respectively; fit(i) represents the fitness of the agent i; and N is the total number of CPs. The separation distance rij between two charged particles is defined as follows:
A. KAVEH and S. TALATAHARI
18
rij
|| Xi X j || || ( X i X j ) / 2 Xbest ||
(4)
where Xi and Xj are respectively the positions of the ith and jth CPs, Xbest is the position of the best current CP, and is a small positive number. Here, pij is the probability of moving each CP towards the others and is obtained using the following function:
1 pij 0
fit (i ) fitbest rand fit ( j ) fit (i ) fit ( j ) fit (i )
(5)
else
In Eq. (2), arij indicates the kind of force and is defined as
1 arij 1
rand 0.8 otherwise
(6)
where rand represents a random number. Step 3: Solution construction. Each CP moves to the new position and the new velocity is calculated as X j , new rand j1 ka F j rand j 2 kv V j ,old X j ,old (7)
V j ,new X j ,new X j ,old
(8)
where ka is the acceleration coefficient; kv is the velocity coefficient to control the influence of the previous velocity; and randj1 and randj2 are two random numbers uniformly distributed in the range (0,1). Step 4: Updating process. If a new CP exits from the allowable search space, a harmony search-based handling approach [9] is used to correct its position. In addition, if some new CP vectors are better than the worst ones in the CM, these are replaced by the worst ones in the CM. Step 5: Termination criterion control. Steps 2-4 are repeated until a termination criterion is satisfied. 3.2. Particle Swarm Optimization added to Charged Search System The Particle Swarm Optimization (PSO) utilizes a velocity term which is a combination of the previous velocity, Vik , the movement in the direction of the local best (i.e. the best visited position by the particle itself), Pik , the movement in the direction of the global best (i.e. the best
OPTIMIZATION OF LARGE-SCALE TRUSS STRUCTURES...
19
visited position of all the particles in its neighborhood), Pgk . In the present hybrid algorithm [13], the advantage of the PSO consisting of utilizing the local best and the global best is added to the CSS algorithm. The charged memory (CM) for the hybrid algorithm is treated as the local best in the PSO, and the CM updating process is defined as follows:
CM i , new
CM i ,old X i , new
W ( X i ,new ) W (CM i ,old ) (9)
W ( X i ,new ) W (CM i ,old )
in which the first term identifies that when the new position is not better than the previous one, the updating will not be performed, while when the new position is better than the so far stored good position, the new solution vector is replaced. Considering the above mentioned new charged memory, the electric forces generated by agents are modified as Fj
q
q
ij
q
q
ij
a3i rij i1 r 2i i2 arij pij (CMi,old X j ) a3i rij i1 r 2i i2 arij pij (Xi X j )
iS1
iS 2
(10)
where subtitles S1 and S2 denote two sets of the numbers which determine the number of the agents utilized to calculate the resultant force by employing the agents sorted in the CM and the current agents positions, respectively. If the coefficient ki is defined as
q q ki 3i rij i1 2i i2 arij pij a rij
(11)
Then the resultant force formulae can be simplified as
F j k1 (CM g , old X j ) k2 (CM j , old X j ) ki (CM i , old X j ) ki ( Xi X j ) (12) i S 1
i S 2
where the subtitle g denotes the number of the stored so far good position among all CPs. Therefore the first term directs the agents towards the global best position. When i = j, then the CM i,old is treated similar to Pik in the PSO as considered in the second term of the above equation. This will direct the agents towards the local best. The sets S1 and S2 are defined as follows [13]:
S1 t1 , t 2 ,..., t n | q (t ) q ( j ), j 1,2,..., N , j i, g
(13)
S 2 S S1
(14)
20
A. KAVEH and S. TALATAHARI
where S1 defines a set of n agents taken from CM and utilized in Eq. (12). If the set S includes all agents, the set S2 will be the set of currently updated agents used to direct agent j. In addition, in the early optimization cycles n is set to zero and is then linearly increased to N towards the end of the optimization process. 3.3. Enhancing the proposed CSS-based algorithm As mentioned before, CSS is a population-based algorithm. For multi-agent methods, the updating process is performed after all agents have created their solutions. Similarly, for the CSS algorithm, when the calculations of the amount of forces are completed for all CPs and the new locations of agents are determined, the CM updating is performed. In the present case, it is assumed that after creating just one solution, all updating processes are performed. In this way, the new position of each agent can affect on the moving of the subsequent CPs while in the standard CSS unless an iteration is completed, the new positions cannot be utilized [12]. Due to using the information obtained by CPs immediately after creation, this modification will enhance the final algorithm. Figure 1 shows the flowchart of the final CSS-based algorithm.
Figure 1. Flowchart for the new CSS-based algorithm.
OPTIMIZATION OF LARGE-SCALE TRUSS STRUCTURES...
21
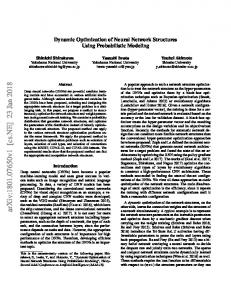
4. DESIGN EXAMPLES Two large-scale truss structures are selected from [7] to verify the efficiency of the new optimization algorithm. The structural material is steel with elastic modulus E = 68,948 MPa. The allowable stress for each member is 172.375 MPa. The stopping criterion is selected in a way that the new algorithm can reach better results than those obtained by Wang and Arora [7]. As soon as such a design is achieved, the searching process is stopped. The algorithms are coded in Matlab and a direct stiffness method is used for the analyses and designs. 4.1. A 35-storey space tower The 35-storey space tower consists of 1,262 members and 936 degrees of freedom [7]. The base of the structure in the X–Y plane is as shown in Figure 2. The entire structure consists of three different sections from top to the bottom. Seventy-two design variables are used to represent the cross-sectional areas of 72 member groups, employing symmetry of the structure. The lower and upper bounds on the cross-sectional areas are 6.4516E-4 m2 and 6.4516E-2 m2 (1.0 and 100 in2), respectively. The loading on the structure consists of downward vertical loads and horizontal loads as follows: A.
B. C.
The vertical loads are given as 13.3446 kN at each node in the first section, 26.6892 kN at each node in the second section, and 40.0338 kN at each node in the third section. The horizontal loads are given as 4.4482 kN in the X direction at each node on the left side, 4.4482 kN in the X direction at each node on the right side. The horizontal loads are given as 4.4482 kN in the Y direction at each node on the back side, 4.4482 kN in the Y direction at each node on the front side.
The displacement constraints are 0.508 m in the X, Y and Z directions for the four nodes on the top level (about 1/250 of the height). Four loading conditions are considered, which consist of different combination of the lateral loads and vertical loads acting on the structure: 1. 2. 3. 4.
Loading condition A alone. Loading conditions A and B acting together. Loading conditions A and C acting together. Loading conditions A, B and C acting together
The corresponding weight obtained by the new algorithm is equal to 51.88 m3 while the best result reported by [7] is 52.06 m3. The required number for convergence in the present algorithm is 17,500 analyses. Figure 3 shows the best and average convergence history for the results of the modified CSS. The plot of average convergence history is obtained using the information of 20 runs with different primary seeds. The difference between the convergence curves recorded respectively for the best design and the results average is small and this confirms the robustness of the proposed algorithm. Figure 4 shows the variation of some design variables for the optimization run corresponding to the best design overall. Whilst in the first iterations the values of selected variables change considerably because of the high exploration power of the algorithm, oscillations reduce as the optimization process
A. KAVEH and S. TALATAHARI
22
progresses and then become marginal in the final iterations. This indicates that a local search is performed towards the end of the optimization process. (b)
(c)
(a)
Figure 2. Schematic of the 35-storey space tower: a) Top view of the tower; b) 3D view of the structure; (c) Side view.
Another interesting finding appears from the comparison of cross-sectional areas with the total length of elements belonging to the corresponding groups. It means that when for some design variables the sum of element lengths is large, the selected area often becomes small. Conversely, for groups with a small sum of lengths, large values are assigned to the crosssectional area in order to increase the stiffness of the structure. In this way, by multiplying small areas (large areas) with large sum of element lengths (small ones), the optimum design corresponding to a small volume can be obtained. Although this is not a general rule, and it is not even true for some variables, the variables with large amount of length sum have often tendency to select weak cross sections.
OPTIMIZATION OF LARGE-SCALE TRUSS STRUCTURES...
23
200 Best result Average of results
Volume (m3)
150
100
50
1
2,500
5,000
7,500 10,000 Number of analyses
12,500
15,000
17,500
Figure 3. Convergence curves corresponding to the best design and the results average obtained for the 35-storey space tower 100 Varible 1 Variable 16 Varaible 44
90
The value of the varible
80 70 60 50 40 30 20 10 0
1
2,500
5,000
7,500 10,000 12,500 Number of analyses
15,000
17,500
Figure 4. Convergence history for sizing variables 1, 16 and 44 corresponding to the best design obtained for the 35-storey space tower.
4.2. A 62-story space tower The 62-storey space truss tower shown in Figure 6 consists of 4666 members and 2940 degrees of freedom. This structure is a variant of the 35-storey space tower considered in the previous example [7]. There are 238 design variables, representing different member groups as shown in Figure 6 [7]. The lower and upper bounds on the cross-sectional areas are 6.4516E-4 m2 and 0.193548 m2 (1.0 and 300 in2), respectively. The loads on the structure are as follows: A. The vertical loads are given as 26.6892 kN at each node. B. The horizontal loads are given as 4.4482 kN in the X direction at each node on the left side, 4.4482 kN in the X direction at each node on the right side. C. The horizontal loads are given as 4.4482 kN in the Y direction at each node on the back side, 4.4482 kN in the Y direction at each node on the front side.
A. KAVEH and S. TALATAHARI
24
The displacement constraints are 0.90678 m in the X, Y and Z directions for the four nodes on the top level (about 1/250 of the height). Three loading conditions are considered, which consist of different combination of the lateral loads and vertical loads acting on the structure: 1. Loading condition A alone. 2. Loading conditions A and B acting together. 3. Loading conditions A, B and C acting together (b)
(c)
(a)
Figure 5. Schematic of the 62-storey space tower: a) Top view of the tower; b) 3D view of the structure; (c) Side view. The optimum design of the 62-story is obtained after 25,000 analyses by using the modified CSS algorithm. The corresponding minimum volume is 349.3 m3. The optimum designs obtained by using SAND formulations had the volume of 350.5 m3 [7]. As shown in Figure 7, it can be concluded that the global searching level of the new algorithm is completed after 18,500 analyses where its best so far result is 10% higher than the final optimum design. Table 1 summarizes the optimal design for the new algorithm. The global sway at the top of the tower is the active constraint where it is very close to its maximum allowable value. Though ignoring the stress constraints may lead to smaller weights, however, these constraints must also be considered during the optimization process. Figure 8 shows the final values of the variables
OPTIMIZATION OF LARGE-SCALE TRUSS STRUCTURES...
25
number 21, 2, 10, and 15 in the 20 runs. Almost all the runs converge to a determinable small domain, and it can be concluded that the final best optimum result of these variables will be in these domains.
Table 1. Optimized cross-sectional areas for the 62-storey space tower No. of group
Area (cm2)
No. of group
Area (cm2)
No. of group
Area (cm2)
No. of group
Area (cm2)
No. of grou p
Area (cm2)
No. of grou p
Area (cm2)
No. of group
Area (cm2)
1
6.452
35
6.452
69
6.452
103
1935.48
137
140.57 9
171
46.131
205
31.905
2
6.452
36
6.452
70
1935.48
104
639.920
138
57.468
172
48.789
206
6.452
3
892.042
37
1935.48
71
1327.16
105
77.484
139
60.680
173
6.452
207
21.628
4
1931.20
38
1935.48
72
88.219
106
74.434
140
6.478
174
6.452
208
6.452
5
6.452
39
80.524
73
81.173
107
6.452
141
8.645
175
6.452
209
6.452
6
1935.48
40
87.745
74
6.452
108
23.024
142
6.452
176
6.452
210
6.529
7
6.452
41
6.452
75
38.567
109
6.452
143
6.452
177
6.452
211
6.452
8
6.452
42
52.417
76
6.452
110
6.452
144
6.452
178
6.452
212
6.452
9
6.452
43
6.452
77
6.452
111
6.452
145
6.452
179
6.452
213
194.097
10
1370.763
44
6.452
78
6.452
112
6.452
146
6.452
180
842.124
214
6.452
11
6.452
45
6.452
79
6.452
113
6.452
147
1651.55
181
6.452
215
25.804 27.931
12
1225.06
46
6.452
80
6.452
114
1935.48
148
67.129
182
44.703
216
13
6.452
47
6.452
81
1935.48
115
424.997
149
56.296
183
44.845
217
6.452
14
6.452
48
1935.48
82
1082.345
116
75.535
150
51.999
184
6.477
218
23.340
15
1935.48
49
1793.11
83
85.219
117
68.514
151
6.4798
185
9.022
219
6.452
16
1935.48
50
84.928
84
71.339
118
6.452
152
6.475
186
6.452
220
6.452
17
25.972
51
91.362
85
6.452
119
18.056
153
6.475
187
6.475
221
6.452
18
12.44
52
6.452
86
33.767
120
6.452
154
6.452
188
6.477
222
21.124
19
23.260
53
47.206
87
6.452
121
6.452
155
6.497
189
6.452
223
20.056
20
974.290
54
6.452
88
6.452
122
6.452
156
6.474
190
6.480
224
72.682
21
216.528
55
6.452
89
6.452
123
6.452
157
6.475
191
596.237
225
6.452
22
53.036
56
6.452
90
6.452
124
6.452
158
1402.36
192
6.475
226
18.239 17.357
23
9.309
57
6.452
91
6.475
125
1935.48
159
21.590
193
41.610
227
24
6.452
58
6.452
92
1935.48
126
256.643
160
52.830
194
40.471
228
6.452
25
6.452
59
1935.48
93
842.935
127
64.732
161
52.195
195
6.475
229
26.987
26
1935.48
60
1572.18
94
81.171
128
66.3102
162
6.452
196
14.202
230
6.452
27
1935.48
61
81.362
95
74.630
129
6.452
163
6.452
197
6.452
231
6.452
28
73.607
62
85.490
96
6.485
130
13.534
164
6.452
198
6.452
232
6.452
29
53.670
63
6.452
97
29.297
131
6.475
165
6.452
199
6.452
233
214.581
30
6.452
64
42.633
98
6.526
132
6.452
166
6.452
200
6.452
234
27.862
31
197.526
65
6.452
99
6.452
133
6.491
167
6.452
201
6.452
235
6.480
32
72.905
66
6.452
100
6.452
134
6.452
168
6.452
202
377.734
236
52.421
33
32.060
67
6.452
101
6.452
135
6.452
169
1121.19
203
6.452
237
12.948
34
10.706
68
6.452
102
6.452
136
1858.62
170
6.452
204
33.441
238
6.522
A. KAVEH and S. TALATAHARI
26
(b)
(a)
(c) Figure 6. Member groups of 62-story space tower: (a) first storey; (b) second storey; and (c) top storey. 2200
Best run Average of runs
2000 1800
Volume (m3)
1600 1400 1200 1000 800 600 400 1
2,500
5,000
7,500 10,000 12,500 15,000 17,500 20,000 22,500 25,000 Number of analyses
Figure 7. Convergence curves corresponding to the best design and the results average obtained for the 62-storey space tower
OPTIMIZATION OF LARGE-SCALE TRUSS STRUCTURES...
27
300
Values of variables (in2)
250
200
150
100
50
0
2
4
6
8
10 12 Number of runs
14
16
18
20
Figure 8. Values of design variables 21, 2, 10 and 15 obtained in the 20 optimization runs.
5. CONCLUDING REMARKS This paper presented a modified Charged System Search algorithm for large-scale truss optimization problems. These problems are very complicated because of the presence of large search spaces as well as it is necessary to handle a large number of optimization constraints. Furthermore, it is a matter of fact that analyzing large-scale structures is computationally difficult. Therefore, the use of adaptive algorithms (rather than their original forms) seems to be the most convenient approach to optimum design of large-scale truss structures. In view of this, a powerful algorithm is developed in this research by combining CSS and PSO. Furthermore, the design variables updating process is modified. The new algorithm in the CSS formulation introduces the PSO concept of local best and global best. Therefore, the charged memory is treated as the local best and redefined considering this point. The expression of the electric forces generated by each CP is modified in order to include the effect of the local best and global best points and the other agents. Finally, all updating processes are performed after creating just one solution. Hence the new position of each agent affects the movement of the subsequent CPs. Optimization results obtained by the modified CSS algorithm for two large-scale truss structures show that the proposed formulation can easily solve large-scale problems and requires small computational effort to find optimal designs. Acknowledgement: The first author is grateful to the Iran National Science Foundation for the support.
28
A. KAVEH and S. TALATAHARI
REFERENCES Kaveh A, Farahmand Azar B, Talatahari S. Ant colony optimization for design of space trusses, Int J Space Structures 2008; 23(3): 167–81. 2. Haftka RT. Simultaneous analysis and design. AIAA J 1985; 23(7): 1099–103. 3. Schulz V, Bock HG. Partially reduced SQP methods for large-scale nonlinear optimization problems, Nonlinear Anal-Theor Meth Applic 1997; 30(8): 4723–34. 4. Dreyer T, Maar B, Schulz V. Multigrid optimization in applications, J Comput Appl Math 2000; 120(1): 67–84. 5. Schulz V. Simultaneous solution approaches for large optimization problems, J Comput Appl Math 2004; 164(1): 629–41. 6. Kirsch U, Rozvany GIN. Alternative formulations of structural optimization, Struct Multidiscip Opt 1994; 7:32–41. 7. Wang Q, Arora JS. Optimization of large-scale truss structures using sparse SAND formulations, Int J Numer Methods Eng 2007; 69:390–407 8. Botello S, Marroquin JL, Onate E, Horebeek JV. Solving structural optimization problems with genetic algorithms and simulated annealing, Int J Numer Methods Eng 999; 45: 1069-84. 9. Kaveh A, Talatahari S. A novel heuristic optimization method: charged system search, Acta Mech 2010; 213(3-4): 267-89. 10. Kaveh A, Talatahari S. Optimal design of skeletal structures via the charged system search algorithm, Struct Multidiscip Opt 2010; 41(6): 893-911. 11. Kaveh A, Talatahari S. Charged system search for optimum grillage systems design using the LRFD-AISC code, J Construct Steel Res 2010; 66(6):767-71. 12. Kaveh A, Talatahari S. An enhanced charged system search for configuration optimization using the concept of fields of forces, Struct Multidiscip Opt 2011; 43(3): 1.
339-51. 13. Kaveh A, Talatahari S. Hybrid charged system search and particle swarm optimization for engineering design problems, Eng Comput, 2011; 28(4)423-40.