Automated Task Allocation Rocío Barragán Montes Eduardo García Francisco Javier Sáez Nieto CRIDA CRIDA UPM Grupo de Investigación Navegación Aérea (GINA) Universidad Politécnica de Madrid (UPM) Pza. de Cardenal Cisneros, nº 3, 28040 Madrid, Spain
[email protected] [email protected] [email protected] ABSTRACT
called Reference Business Trajectory (RBT);
The goal of the paradigm shift in Air Traffic Management (ATM) is to increase its overall performance by means of redesigning processes, evolving to a more automated, autonomous and predictable system. Nevertheless, when dealing with automation, it is important to determine until what extent can any part of the system or process be automated, that is, to determine the right player. It is also likely to be tempted to make the system as autonomous as possible, avoiding the stiffness introduced by centralised processes, which means to choose the right place to drive it. Finally, it is also commonly accepted that the sooner an activity is planned, the more predictable the system will be, i.e., to determine the right time. However, reality creates constraints that make it impossible to reach the ideal status: fully automated, completely autonomous and totally anticipated. Considering the ATM system as a set of tasks and functions, its allocation can be defined as their placement in time, place and player. This paper presents operational research methodologies to estimate the best time, the best place and the best player for optimal performance of the ATM system.
• Moving towards a network centric approach, underpinned by a System Wide Information System (SWIM), such that all parties involved have access to relevant and most up-to-date flight information;
Author Keywords
• Its anticipatory/compensatory components [4],
Task Allocation; ATM; Level of Automation; Anticipatory; Compensatory; Centric; Autonomous; Optimisation; Operations Research; Decision Support Tools; Performance Metrics.
• Dynamic airspace management, facilitated by a central network, to enhance coordination between aviation authorities; • New and innovative technologies for more precise navigation and surveillance in order to optimise airspace and airport capacity; • Allocate a central role for the human, but supported by a high degree of automation to reduce workload, optimise airspace capacity, and maintain a sufficient level of safety in complex, high-traffic, and time-critical situations. As it is stated in HALA's Position Paper [2, chapter 4.2], the shift will be focused on ATM invariant processes and new role assignments based on three interdependent criteria, having overall system performance as main driver for ATM automation: • The degree of ATM agents involvement (autonomous vs. centric), and • The level of automation [7].
ACM Classification Keywords
H.5.m. INTRODUCTION Three Characteristics
In the context of civil air navigation, where SESAR is aiming at improving the ATM global efficiency, there are key features to achieve the paradigm shift [8, p. 3-4]: • Moving from airspace towards trajectory-based operations, such that each aircraft follows its preferred route and arrives at its desired time of arrival; the soPermission to make digital or hard copies of all or part of this work for personal or classroom use is granted without fee provided that copies are not made or distributed for profit or commercial advantage and that copies bear this notice and the full citation on the first page. To copy otherwise, or republish, to post on servers or to redistribute to lists, requires prior specific permission and/or a fee.
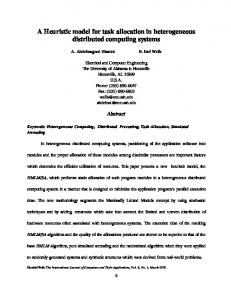
Figure 1. 3-D task allocation. Figure 1 represents a 3-D perspective of the task allocation characteristics. The optimum state would be highly
automated (10 in Parasuranaman, Sheridan and Wickens levels), totally anticipatory in Hollnagel Extended Control Model (ECOM) and fully autonomous. Nevertheless, reality creates constraints that make it impossible to reach the ideal status. The PhD thesis will be devoted to develop a methodology to optimise the task allocation. The inception in the concept of task allocation, is the improvement of the overall system performance. This performance will be estimated by Key Performance Indicators (KPIs), gathered into eleven Key Performance Areas (KPAs), established in [6, Appendix D]: • KPA-01: Access and equity • KPA-02: Capacity • KPA-03: Cost-effectiveness • KPA-04: Efficiency • KPA-05: Environment • KPA-06: Flexibility • KPA-07: Global interoperability • KPA-08: Participation by the ATM community • KPA-09: Predictability • KPA-10: Safety • KPA-11: Security There is a factor which could be added to the list: resilience as defined in [1], [5], [10] is the intrinsic ability of a system to adjust its functioning prior to, during or following changes and disturbances, so that it can sustain required operations under both expected and unexpected conditions. Recently it has been included as a part of the topics studied in SESAR ComplexWorld network, which is developing the project MAREA to support effective application of resilience engineering. Hence, it will be comprised in this PhD thesis as a component to be taken into consideration. The KPIs will supply the variables to the equations which will be used to optimise the system, while the position in the 3-D coordinates presented in Figure 1 are the means to represent the results. Why Operational Research
Since the World War II, there has been many applications of Operational Research (OR), Operations Research in US English, in strategic-level Decision Support Tools (DST). It is stated in [9] that although OR originally concentrated on solving problems at the operational research, support tools for strategic-level decision-making have become increasingly popular not only in academia but also in the industrial world. This acquaintance supports the decision of
using OR as the mathematical drive to solve the proposed problem. The first step in approaching an OR problem is the posing. The modelling will retain the most relevant elements of the reality into mathematical equations, where the unknowns, are the Decision Variables (DV). This part of the problem is the key, whereas if the equations are ill posed, the results will be completely wrong. There are two kinds of mathematical expressions: the Objective Function (OF) which must be optimised (maximise or minimise) and the existing restrictions, which are the Constraint Set (CS). Secondly, in order to solve a set of OR obtained equations, there are different methods which can be used as explained in [3], depending on the nature of the mathematical statements. With the help of a mathematical programming tool, the equations are expressed and solved, and the values of the unknown DV determined in order to optimise the function. Finally, once the first results have been found, they must be validated in order to show their applicability to reality, analysing their effect on the system. The results of this assessment process may show that the posing was not correct, so it may be possible to be forced to reformulate some of the equations. This phase is known as post optimality analysis. PHD APPROACH The Objective Function
Building up the mathematical model will take into account the different KPAs and will use its KPIs to determine the OF, or in our case, OFs, and its DV, among which, the coordinates in the Figure 1 (3-D task allocation) will be established. In order to simplify the posing of the OF, the KPAs will be grouped into three related OR. See Table 1. Operational Research Phase
Operational level (OOR)
Efficiency level (EOR)
Feasibility level (FOR)
KPAs KPA-02 – Capacity KPA-06 – Flexibility KPA-09 – Predictability KPA-10 – Safety Resilience KPA-03 – Cost-effectiveness KPA-04 – Efficiency KPA-05 – Environment KPA-01 – Access and equity KPA-07 – Global interoperability KPA-08 – Participation by the ATM community KPA-11 – Security
Table 1. Operational Research Phases applied to ATM
The three levels indicated above can be substantially analysed independently by following the sequence shown in Figure 2.
related to liability issues, social and institutional effects KPAs, plus the sensible DVs derived from the two previous sensitivity analyses will be considered.
The OFs in each level will be stated but they must be checked, before the following step. The validation process will proceed as described in Figure 2.
The steps presented in Figure 2 for deriving the solution will iterate until the global solution is found.
At the first loop, an Operational level OR (OOR) analysis will be conducted to provide the optimised task allocation from the operational point of view, by using detailed KPIs from capacity, predictability/flexibility and safety/resilience areas. Only generic indicators from the other two levels will be considered at this stage.
The main setback of the process is due to the fact that the KPAs in each level are interconnected. The relationship could be direct or inverse or there could be no immediate connection at all. Figure 3 shows the relations of the areas included in the OOR as an example. The arrows denote the direction of the relationship while the position of the cones indicates whether the characteristic is increased or decreased for the sake of the connection. For instance, the relationship between capacity and safety is: the more capacity the less safety. However, the relationship between flexibility and capacity is: the more flexibility, the more capacity.
Figure 3. OOR Areas Relationship
Figure 2. Flow diagram of the operational research objective function definition
Following SESAR recommendations, optimising some KPAs would seem to be detrimental to other KPAs. Nevertheless, conceiving the system as a whole, the overall performance will be maximised. For instance, enabling a 3fold increase in capacity would mean decreasing safety. Using this methodology, it will be exhibited that other factors affecting safety can be refined to reach the improvement of safety performance by a factor of 10, for example, those belonging to predictability.
Sensitivity analysis would be carefully performed at the OOR level to identify operational DVs that strongly affect the other two levels, i.e., Efficiency and Feasibility.
The Constraint Set
A similar process (EOR) will be developed for the second level (Efficiency) by considering as DVs, those related to economical efficiency and environmental impact KPAs, plus those that are also sensible DVs derived from the previous sensitivity analysis. The obtained result will provide relevant information about the satisfying Operational and Efficiency indicators.
• Airports capacity,
Then, depending on whether the satisfying test is considered positive, a final process (FOR) will be conducted for the third level (Feasibility). In this case, DVs
Other factors that will be taken into account and will define the CS will be the scenario constraints: • Atmosphere behaviour and • Airspace limitations. Also the state of the art of technical enablers, established by robustness and quality performance indicators for: • Communications, navigation and surveillance sensors, • Information technologies, • Automation and Human-Machine Interfaces (HMI).
And finally, the invariants in ATM Additionally, there are several agents that compose the system as shown in Figure 4 and that determine the point of view under which the CS will be stated: the Network Manager (NM), Air Navigation Service Providers (ANSP), Airports, Airlines Operation Centre (AOCs), Meteo Info Suppliers and Military Operations. There is also a starring "actor", which is the Aircraft, shown in yellow in Figure 4, the one that plays the "subject", which is the trajectory.
something in the present is changed could also be a reason to reallocate certain task. ACKNOWLEDGMENTS
The PhD grant of Ms. Barragán is supported by CRIDA. REFERENCES
1. Eurocontrol: A white paper on Resilience Engineering for ATM. September 2009. 2. HALA! SESAR Research Network: HALA! D4.1 Position Paper v2.04. http://www.hala-sesar.net/halaposition-paper. 3. Hillier, FS., Lieberman, GJ.: Introduction to Operations Research, 7th Edition. McGraw-Hill. 2001 4. Hollnagel, E., Nåbo, A., Lau, I.: A Systemic Model for Driver-In-Control; Proceedings of the Second International Driving Symposium on Human Factors in Driver Assessment, Training, and Vehicle Design. July 21–24, Public Policy Center, University of Iowa, Park City, UT, 2003. 5. Hollnagel, E., Woods, DD., Leveson, N.: Resilience engineering: Concepts and precepts. Ashgate, Aldershot, England, 2006.
Figure 4. Different ATM agents interconnected by SWIM (Technical enabler for communications)
6. ICAO: Global Air Traffic Management Operational Concept, Doc 9854, 2005.
As it is difficult to extract the right answer from the wrong problem, a post optimality analysis must be carried out at this point. Once the CS is established, and carefully analysed in order to make sure it matches reality, the system must be resolved.
7. Parasuraman, R., Sheridan, T. and Wickens, C.: TYPES AND LEVELS OF HUMAN INTERACTION WITH AUTOMATION, IEEE transactions on systems, man, and cybernetics—part a: systems and humans, vol. 30, no. 3, may 2000.
The Expected Conclusions
8. SESAR Master Plan D5, April 2008, document no. DLM-0710-001-02-00.
Using a Mathematical programming tool, the system will be solved and with a friendly user interface, it could be used as a "What if" tool, in order to determine the DV that can make the improvement of the system grow significantly. A possible extension of the research would be considering that the constraints are not always fixed and in the medium and long term some of them will change. What will happen then and how the overall performance could be improved if
9. Stenfors, S., et al: Executive views concerning decision support tools, European Journal of Operational Research 181, 2007. 10. Stroeve, Sybert H., Everdij, Mariken H.C., Blom, Henk A.P.: Studying hazards for resilience modelling in ATM, First SESAR Innovation Days, 2011.