Automated Task Distribution in Multicore Network Processors using Statistical Analysis Arindam Mallik
Yu Zhang
Gokhan Memik
Northwestern University
[email protected]
Northwestern University
[email protected]
Northwestern University
[email protected]
inspection on each packet and even to make routing decisions based upon content. Traditionally, networking equipment manufacturers have been forced to develop ASICs due to the high performance requirements of the high-speed links. The classical networking challenge is to maintain stability while maximizing throughput and minimizing latency for the worst-case traffic. Such a scenario has presented the circuit designers with the huge opportunity to develop a new class of processors–the Network Processors (NPs). As suggested by the industry watchers [25], a steady rise in demand for application specific hardware for networking applications would drive the research for innovative technologies in network processor architectures. Although NP architectures vary significantly in their design styles (c.f., Table 1), Chip Multiprocessor (CMP) is arguably the most common architectural method: most designs including Intel IXP architectures [8-10] , Cisco Toaster [13] and Freescale C-5 [15] follow the CMP style. The reason for this selection lies in the nature of the networking applications. Most networking applications exhibit high data and task level parallelism, whereas the instruction level parallelism is relatively limited. In addition, most applications are relatively simple. Therefore, designers utilize several simple execution cores that can take advantage of the data/task level parallelism without complicating the design process.
ABSTRACT Chip multiprocessor designs are the most common types of architectures seen in Network Processors. As the Network Processors are used to implement increasingly complicated applications, task distribution among the cores is becoming an important problem. In this paper, we propose a new task allocation scheme for such architectures. This scheme relies on the inherent modular nature of the networking applications and intelligently distributes modules among different execution cores. Additionally, we selectively replicate modules to parallelize execution of tasks having longer processing time. We have developed a technique that uses the probability distribution of the execution times of different modules in the networking applications. The proposed schemes result in resource utilization of up to 95%, 89%, and 84% on average for the processors with 2, 4, and 8 cores, respectively. The schemes are highly scalable and can improve the throughput by 6.72 times for 8 core processors, aggregated over four representative applications. The combination of selective replication of modules and variation-aware task allocation result in up to 12.5% (9.9% on average) performance improvement as compared to a scheme based on just mean processing time.1
Categories and Subject Descriptors C.2.1 [Computer-Communication Networks]: Network Architecture and Design – Packet-switching networks.
One of the most important bottlenecks for CMP processors in general, and particularly the NP architectures, is the low scalability of the interconnect networks. Although increasing the number of cores in the processor is desirable to take advantage of the parallelism in the application, developing an interconnect network to achieve efficient communication among cores becomes complicated as the number of nodes is increased. Therefore, with the next generation NP architectures, we are seeing an increased emphasis on local communication. For example, the Intel IXP 28xx [8, 10] architectures utilize neighbor-to-neighbor links in addition to the global communication structures. In such architectures, the utilization of the local communication links is arguably the most important factor in determining the performance of the application. With the increasing link speeds and the changes in the target applications, it is expected that the number of execution cores in the processors will increase. Therefore, high utilization of local communication links will become an obligation to achieve
General Terms Algorithms, Performance
1. Introduction A Network Processor (NP) is an Application Specific Instruction Processor (ASIP) for the networking application domain – a software programmable device with architectural features and/or special circuitry for packet processing. The ever-increasing complexity of the networking applications demands evolution of a class of processors, which are fully dedicated for such applications. Furthermore, customer innovation demands the ability to perform detailed 1
Permission to make digital or hard copies of all or part of this work for personal or classroom use is granted without fee provided that copies are not made or distributed for profit or commercial advantage and that copies bear this notice and the full citation on the first page. To copy otherwise, or republish, to post on servers or to redistribute to lists, requires prior specific permission and/or a fee. ANCS’07, December 3–4, 2007, Orlando, Florida, USA. Copyright 2007 ACM 978-1-59593-945-6/07/0012...$5.00.
67
the desired scalability in next-generation NPs. Clearly, the key factor that determines the communication behavior is the task distribution. In most of the existing architectures, this task is left to the user. With the increasing complexity of the architectures, this expectation from the user becomes limiting and an automated task distribution scheme is highly desirable. In this paper, we propose a solution to this problem. Particularly, we present an automated task allocation scheme for NPs. We utilize the modular nature observed in majority of networking applications. First, we divide the applications into modules similar to CLICK [12] and NP-Click [21] environments. Then, we profile the applications using a representative workload and perform a statistical analysis on the behavior of different modules in the application. This analysis provides us with the distribution of the execution times of different modules. Then, we utilize this probability distribution information to allocate tasks among different execution cores of the NPs. In addition to utilizing this information to decide on task distribution, we also make decisions about which modules should be replicated based on the analysis. Specifically, our contributions in this paper are as follows:
specifically designed to move packet data to/from and within the processor. Secondly, for many of the networking applications, though not all, these packets can be processed independently. Therefore, there is a large amount of data level parallelism available in the applications. The designers take advantage of this fact with the use of multithreading and with multiple execution cores. Almost all of the NPs use a variation of multithreading and have several execution cores. Table 1 presents some characteristics of the representative NPs, i.e. the number of execution cores and the parallelism technique (data or instruction level parallelism) employed in these processors. Another important property of these applications that is mostly overlooked is their modular nature. Most of the networking applications implement a set of tasks that have to be performed on each packet. In many cases, these tasks are defined by international standardization organizations. Hence, it is easier for a designer to visualize the application as a set of tasks (or modules) instead of a traditional program implemented in a high-level program such as C. In this work, we develop techniques that take advantage of this modular nature of the networking applications.
We analyze the probability distribution of packet processing elements in modular networking applications, • We present an intelligent methodology to allocate tasks among different processor cores of a chip multiprocessor, and • We show experimental results investigating the impact of our task allocation scheme and compare it to alternatives. Our main goal is to reduce the effect of the variation in the execution times of the packets. To be more precise, we would like to schedule the tasks such that the effects of variation will be minimized. The variation in the execution times is an inherent property of computing. This is particularly true for CMPs, where different cores are competing for a set of global resources (e.g., shared bus or the shared memory). In addition, there is data-dependent variation, i.e., depending on the particular input the execution time may vary. For example, a loop might be executed for different number of iterations based on the input data. This uncertainty is even more pressing if the cores implement multithreading (as commonly done for most NP architectures). The order in which the threads are selected and the order of the packet arrival are likely to have a significant impact on the time of completion for a single thread. This inherent variation in execution time is an important reason for the complexity of task distribution.
Table 1. Important characteristics of representative Network Processor Designs: exec. cores is the number of execution cores, and parallelism technique is the technique(s) used for task or instruction level parallelism (MT: Multi-Threading, VLIW: Very-Long Instruction Word) in the execution cores
•
Processor Agere PayloadPlus AMMC (MMC) nP7250 Bay Microsystems Chespeake Broadcom BCM-1250 Cavium Octeon Cisco Toaster EZChip Freescale C-5 Hifn 5NP4G Intel IXP2800 Intel IXP1200 PMC-Sierra RM9000 Vitesse (Sitera) IQ1200 Wintegra WinPath2 Xelerated Xelerator X11
# of cores 3 2 2 2 16 16 ~40 16 16 16 6 2 4 6 360
Parallelism technique MT, VLIW MT MT Superscalar MT VLIW MT MT MT MT MT Superscalar MT MT VLIW, MT
Another important aspect that needs to be highlighted is the trend in the NP architectures. Each new NP generation employs more execution cores than their predecessors. Therefore, traditional communication structures between these execution cores (global buses or cross-bar based fabrics) become less effective. Many of the newer NPs employ special neighbor-to-neighbor communication (systolic array) or enhanced interconnection networks to reduce the need for accessing global structures. In such systems, effective task allocation becomes particularly hard even for the most experienced programmers.
2. Modularity in Network Applications The Network Processor (NP) designers utilize two important properties of networking applications. First, these applications consume and produce well-defined data segments (network packets). This property leads the designers to utilize intelligent memory controllers
68
In the past, modular routers have gained much focus due to their ease of designing. CLICK [12] and Baker [24] are examples of domain specific languages designed for describing networking applications. We design our framework based on the CLICK framework. CLICK is a flexible, software modular architecture, which can build routers from fine-grained components. Each of these components, known as element, performs a simple task, such as decrementing an IP packet’s time-to-live (TTL) or IP header checking. They can easily be extended to do complicated tasks (IP lookup, NAT). To build a router configuration, the user chooses a collection of elements and connects them into a directed flow graph. The nodes being elements, the connections between those elements represent a forwarding path. Click configuration scripts are written in a simple language with two important constructs: declarations create elements, and connections say how they should be connected.
IPV4Router: We implement the data plane of an 8 port Fast Ethernet IP Version 4 router [1]. This application is based on the NP benchmark specified by Tsai et al. [23]. A packet arriving on port P is to be examined and forwarded on a different port P’. We use a static lookup table to decide the next-hop location. It is determined through a longest prefix match (LPM) on the IPv4 destination address field. The packet header and payload are checked for validity and packet header fields’ checksum and TTL are updated. Figure 2 shows the Click configuration tree of this application. DRR: We extend the IP router demonstrated in the Click Modular Router project. The router that forwards unicast packets in nearly full compliance with the standards [1, 17, 18]. We introduce a queue which introduces packet by pulling from a set of infinite packet source using deficit round robin (drr) scheduling [19]. RED: Random early detection is more likely to drop packets when there is network congestion; when there are many packets in the queue servicing that link. The RED element therefore queries router queue lengths when deciding whether to drop a packet.
Discard
DecIPTTL
ToDevice(eth1)
For this application, we extend the Click IP router to handle specialized routing tasks. Particularly, a complex IP router performs the following tasks: two parallel T1 links to a backbone, between which traffic should be load balanced; division of traffic into two priority levels; fairness among the connections within each priority level; and RED dropping driven by the total number of packets queued. Click's modular scheduling, queuing and dropping policy elements are used in this application.
FromDevice(eth0)
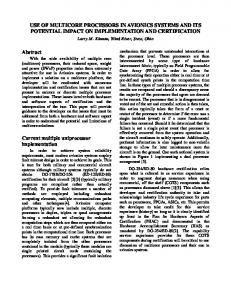
Figure 1. Click configuration for TTL decrement
The Click language is wholly declarative. It specifies what elements to create and how they should be connected, not how to process packets procedurally. Router manipulation tools can take advantage of these properties to optimize router configurations offline or prove simple properties about them. The main goals behind the Click language are usability and extensibility. Figure 1 shows a Click diagram of a simple configuration that checks the TTL value of a packet. It forwards the packet if the TTL value is non-negative. Otherwise, the packet is discarded. NP-Click [21] is an extended programming model based on Click Router and implemented on the Intel IXP1200. It is a combination of an efficient abstraction of the NP with features of a domain-specific language for networking. The result is a natural abstraction that enables programmers to quickly write efficient code. It facilitates the difficulties of programming NPs by taking advantage of hardware parallelism, arbitration of shared resources, and efficient data layout. Our optimizations are based on this type of a programming language and can be readily applied to them.
HOME_NODE: This application imitates an active home node in a network. The home node proxy-ARPs for the mobile node, decapsulates packets from the remote node, sending them onto the local network, and perform IP encapsulation for packets destined for the mobile node. It also ensures that packets generated by the address 1.0.0.10 are properly encapsulated.
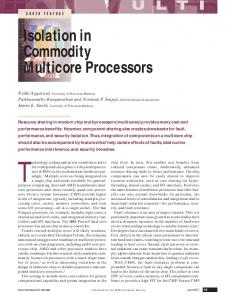
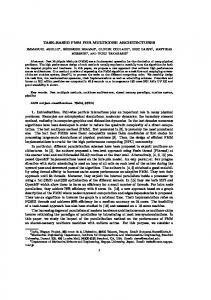
3.1 Probability Distribution of Packets In this section, we discuss the probability distribution of the packet processing time in a Click modular application. For the sake of conciseness, we describe the results for only the IPV4Router application in detail. The IPV4Router application consists of 33 Click elements. It has five different basic elements – Strip, CheckIPHeader, StaticIPLookup, DropBroadcast, DecIPTTL [11]. Figure 2 shows a graphical representation of the Click description of the router and the relation between the basic elements (i.e., modules). The rest of the applications are analyzed in the same fashion and their results are summarized at the end of this section in Table 3. The simulation environment used to gather the statistics is described in Section 5.1.
3. Applications We explore the effectiveness of our task allocation techniques by using it to schedule four representative networking applications. This section describes these applications.
69
Discard DecIPTTL
CheckIPHeader
Strip(14)
DecIPTTL
Discard
DropBroadcast0 StaticIP-
8 Different sources
8 Different destinations
Lookup
Discard
Discard DecIPTTL
Strip(14)
DecIPTTL
Discard
DropBroadcast0
CheckIPHeader
Figure 2. Click configuration tree for the IPV4Router application Table 3: Probability Distribution of Application Elements
Table 2 : Probability Distribution of IPV4Router Elements and the fraction of packets that have execution times exceeding µ+k*σ
strip0 strip1 strip2 strip3 chkip0 chkip1 chkip2 chkip3 RtLkUp DBC0 DBC1 DBC2 DBC3 DcTTL0 DcTTL1 DcTTL2 DcTTL3
Mean(µ)
SD(σ)
Processing time threshold
Mean
SD
(µ)
(σ)
µ
µ+σ
µ+2σ
µ+3σ
µ+4σ
241.28 232.00 220.18 216.05 713.01 695.22 695.49 694.63 336.56 212.30 197.42 210.45 205.47 317.78 320.33 315.96 314.77
29.31 22.11 25.24 19.87 59.77 31.48 25.09 21.77 266.88 21.18 18.51 26.50 17.40 20.34 21.10 19.6 18.26
50.00 34.19 31.81 35.06 50.00 34.63 27.59 20.00 20.03 34.32 51.29 18.39 32.83 26.45 35.71 20.99 19.85
0.64 33.33 25.00 20.00 0.64 33.33 25.00 20.00 20.03 28.57 26.94 2.16 14.28 12.98 26.62 17.09 14.28
0.64 0.00 0.00 3.63 0.64 0.86 0.97 2.33 10.01 1.29 25.00 0.00 14.28 2.09 0.00 1.29 0.55
0.64 0.00 0.00 0.00 0.64 0.43 0.00 0.00 0.03 0.18 0.64 0.00 0.00 0.00 0.00 0.00 0.00
0.00 0.00 0.00 0.00 0.64 0.00 0.00 0.00 0.03 0.18 0.00 0.00 0.00 0.00 0.00 0.00 0.00
Cl1 DRRelem IPCheck RtLkUp ChkPnt FixIP Frag
µ DRR
Processing time threshold µ+σ µ+2σ µ+3σ µ+4σ
351.20 24.13 55.35 9.81 17032.70 76778.25 45.23 0.13 31.66 38.14 13.82 0.25 349.70 220.44 22.86 22.86 19552.00 46879.27 7.64 7.64 219.20 14.64 34.83 25.87 183.94 18.11 53.23 23.38
0.88 0.13 0.25 0.63 7.64 0.00 4.48
0.13 0.13 0.25 0.13 7.64 0.00 0.00
0.13 0.13 0.00 0.13 0.33 0.00 0.00
6.61 7.17 7.42 9.67 3.00 2.17 6.11
5.72 5.08 2.00 0.17 0.17 0.17 6.11
0.06 2.33 0.08 0.00 0.17 0.17 0.28
1.19 2.75 0.08 1.58 0.83
0.11 1.08 0.08 0.08 0.08
0.08 0.33 0.08 0.08 0.08
RED RED StripHdr GetIP Strip2 IPEncap SetIP PrioSche
834.80 204.00 379.50 209.00 469.70 208.00 286.50
142.74 9.89 15.89 13.60 17.65 14.34 8.27
Classifier Strip1 CheckIP StripHdr GetIP
319.98 213.90 695.80 225.70 386.50
30.02 9.96 20.31 10.15 40.60
39.33 25.08 20.58 23.83 33.50 35.17 33.67
6.78 9.17 9.17 16.00 15.50 19.67 8.06
HOME_NODE
We execute the configuration for 5000 packets. During this execution, we record the amount of time spent by each packet in different elements of the Click router. Using these statistics, we find the mean and the standard deviation of the execution times. Table 2 presents the results for the 17 representative elements along with their execution times in the configuration. Once we extract the mean (µ) and the standard deviation (σ) of processing time by each of the element, we compare them against the data recorded for each packet traversed through it. The four right-most columns in the Table 2 present the percentage of packets that couldn’t be processed within the slack given by the expression (µ + k*σ), where k is a positive constant.
59.50 26.25 41.67 32.58 59.92
8.58 7.83 12.50 11.67 17.42
These statistics are important to us, because it can be used for estimating how the variation will affect the utilization. In other words, if we pipeline the tasks according to the mean only, a packet that takes longer than µ cycles to execute will clog the pipeline and cause the utilization to decrease in the proceeding processor. Particularly, if we only consider the average execution time in task distribution, 32% of the packets on average will not finish within the expected time and will likely cause performance degradation. In Section 5, we analyze the applications and present experimental results showing that for an 8 processor NP, this
70
the processors by simply considering the average execution time. The second one utilizes the standard deviation in addition to the average. If the number of execution cores exceeds the number of modules in an application, the modules need to be replicated. Section 4.3 describes how this replication can be performed effectively by taking advantage of the statistical information.
variation can cause up to 23% underutilization of the processors. We analyze all the applications following the identical procedure. Table 3 summarizes the statistical data obtained from different elements. For lack of space, we report the data for a few representative elements in each application. Note that, the mean (µ) and standard deviation (σ) for different instances of the same element vary depending on the packet contents. Similar to the IPV4Router application, we see a large variation in the execution times of the modules for all the applications.
4.1 Architecture Description In this work, we consider a systolic array architecture. In this architecture, the execution cores are arranged in a pipelined fashion. In other words, processors are logically aligned in a single dimension and each processor is connected to its left and right neighbors. In addition, for the communication patterns, which cannot be satisfied by the local links, a shared bus that connects all execution cores is utilized. Although generic, this architecture represents most of the NP architectures. In this paper, our goal is to develop an automated method to distribute the tasks in an application uniformly over the cores. Once an execution core performs the task allocated to it, it forwards the processed packet as well as the necessary data to the next core. We exploited pipeline parallelism by mapping a set of modular networking tasks to different cores and using an onchip network for direct communication between different modules. Compared to data parallelism, this approach offers reduced latency, reduced buffering, and good locality. It does not introduce any extraneous communication, and it provides the ability to execute any pair of modules in parallel. Most importantly, this approach reduces the load on the memory bandwidth (data-parallel implementation puts a high load on the memory). Since memory bandwidth is expected to be the most important bottleneck in future Chip Multiprocessor (CMP) systems, we believe that our automated approach will have a wide usage. On the other hand, this form of pipelining introduces extra synchronization, as all modules need to stay tightly coupled in their execution. In addition, effective load balancing is critical, as the throughput of the stream graph is equal to the minimum throughput across all of the processors. The results presented in our work (Section 5) shows that the proposed scheme improves utilization of the processing cores and improves the performance of the processor.
3.2 Aggregate Probability Distribution Although we have seen a variation in the execution times of individual elements, the variations of different modules may cancel each other once they are formed into “stages” that will be executed in different processors. For example, if element1 and element2 are scheduled in a processor and if the execution time of element1 is prolonged while the execution time of element2 shortened, the overall variation in the execution time of the processor may remain constant. Therefore, we also analyzed the variation in the aggregate task execution. We divide the complete configuration tree into different stages. The boundary decision for each stage is made based on the data obtained from the probability distribution of individual elements. We use the expected execution time of the modules and form n stages that are of approximately equal size. Subsequently, we perform a probability analysis of packet processing in each of these stages. Table 4 presents the probability distribution of the IPV4Router application when the processing path is divided into 4 stages. Note that, the selection of the number of the stages is arbitrary, but we must highlight that the results are similar for different number of stages. The results indicate that the standard deviation for the aggregate elements is similar to the ones of the individual elements. Particularly, on average 29% of the packets will cause an execution time exceeding the mean. Table 4: Probability Distribution of IPV4Router Stages Stages Stage0 Stage1 Stage2 Stage3
Mean(µ) SD(σ) 227.38 691.18 500.43 314.72
24.14 30.48 29.52 20.33
Processing time threshold µ µ+σ µ+2σ µ+3σ µ+4σ 35.06 20.00 3.64 0.00 0.00 23.19 14.29 1.86 0.08 0.00 27.18 24.31 5.66 0.11 0.11 27.78 23.14 7.14 0.28 0.00
4.2 Module Distribution In this section, we describe how tasks or modules are distributed among execution cores. Note that, each Click element represents a conceptually simple computation. A module is defined as a subset of Click elements used in an application. The Click configuration tree describes the flow of the application. When we combine the statistical data of individual Click elements along with the Click configuration tree, we have a tree structure depicting the estimated delay of a single packet processing. The overall flow of the processing task can be divided into stages. The objective while dividing the application into stages is to form a group
4. Statistical Task Allocation in NPs In this section, we describe how the statistical analysis is utilized during the assignment of tasks to execution cores (i.e., task allocation). The main objective of allocating tasks is to maximize the utilization of different execution cores of the NP. This, in return, results in an increase in the throughput supported by the processor. In the following, we first describe our target architecture. Then, we present two module distribution schemes. The first assigns the tasks to
71
of stages with equal expected delay. Note that, in our work, a stage and a module are synonymous. From this point onward, we would call each stage a module. We utilize the average processing time of each element to form the modules. Assuming the tasks performed by each module is independent of each other; the average delay of each module is expected to be the sum of average processing time of the Click elements. For a typical networking application, any particular packet would traverse one of the many alternate routes from start to end. We divide each of those paths into equal number of segments. The elements used in a particular stage of all the alternative paths form a single module. Note that, for a particular packet, only a subset of the all the elements in a module would be used.
couldn’t be processed within the mean processing time (µ). A slack of the form k*σ in the estimated processing time helps a particular element to process a packet within the estimated delay. Therefore, instead of forming the stages using the mean processing time (µ), we form the stages using µ+k*σ as the expected execution time. In other words, the weight of each tree node (element) is set to µ+k*σ. This scheme is called Extended Task Distribution (ETD). The intuition behind ETD is to allow each element an extended slack to process a packet. We have performed a number of experiments with varying the k value. Our experiments reveal that the optimal point across the applications is achieved for k = 3. The detailed experiments are described in Section 5. Total_Weight = MAX(Leaf Node Weights); Stage_Weight = Total_Weight / Number of Stages;
For a Click Configuration Tree { Current_Node = root element; WeightCurrent_Node = ExecutionTimeroot; While (Current_Node != Leaf Node){ For all children of Current_Node { New_Node = Child of Current_Node; WeightNew_Node = Execution_TimeNew_Node+ WeightCurrent_Node; } Current_Node = New_Node;
i = 0; // Index for Stage FOR a Click Configuration Tree { Current_Node = root element; Add root element to STAGEi ; Add_WeightCurrent_Node = ExecutionTimeroot; WHILE (Current_Node != Leaf Node){ For all children of Current_Node { New_Node = Child of Current_Node; Add_WeightNew_Node = Execution_TimeNew_Node+ WeightCurrent_Node; IF (Add_WeightNew_Node < STAGE_WEIGHT) { Add current module to STAGEi ; } ELSE { Add_WeightNew_Node= Execution_TimeNew_Node; i = i + 1; Add element to STAGEi ; } Current_Node = New_Node; } }
} }
Figure 3. Pseudocode to calculate Total Execution Time
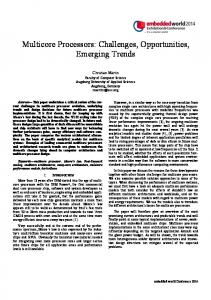
The overall task distribution algorithm has three stages. In the first step, the total execution time of a packet is found. In the second step, the stages are formed. In the third step, we perform local optimization to improve the task distribution. The algorithm to calculate the total execution time is shown in Figure 3. We assign weights equal to expected processing time to each of the modules while traversing the whole tree. The expected execution time for each module is obtained using the procedure described in Section 3. The second step of the algorithm is Basic Task Distribution (BTD). The pseudocode of the algorithm is presented in Figure 4. BTD represents the baseline algorithm for task distribution based on statistical properties. Once this step is completed, we perform a local optimization stage where all the stage boundaries are considered. If moving an element from one stage to the other (the move can be from stage i to i+1 or vice versa) reduces the overall variance in the total execution times of the stages, then the location of the element is changed. We traverse the stages until no element can be moved. Figure 5 shows BTD scheme results on the IPV4Router application. Note that in BTD, we only consider the mean execution time of the modules. In other words, for each stage, we add the mean execution times of the modules in that stage to find the expected execution time of that stage The statistical data obtained for each Click element shows on average approximately 30% of the data packets
}
Figure 4. Pseudocode for Basic Task Distribution (BTD)
4.3 Selective Module Replication It is normal to encounter a situation where the number of different modules available in an application is less than the number of available execution cores. In such cases, we replicate the modules to parallelize the packet processing for that particular module. This would reduce the utilization of the core that directly contradicts our objective for task allocation. However, instead of a naive replication scheme, we replicate the modules with the highest mean processing times. This replication scheme is called Selective Replication (SR). Once we replicate a module, the two new modules are assigned a weight equal to the half of the weight of the original module. Moreover, we consider an extended slack version of the SR technique where we also consider the variation while making replication decision. This scheme, called Extended Selective Replication (ESR), labels each module with µ+k*σ, and performs the replications accordingly.
72
Discard Strip(14)
InfiniteSource
CheckIPHeader DecIPTTL
Discard
DropBroadcast0 StaticIP-
8 Different sources
8 Different destinations
Lookup
Discard
Discard Strip(14)
InfiniteSource
DecIPTTL
DropBroadcast0
CheckIPHeader
Discard
Two Stages Four Stages
Figure 5. Illustration of module distribution in IPV4Router application
simulate four representative networking applications as discussed in Section 3. We perform two sets of experiments. First, we analyze the proposed task allocation scheme from the throughput perspective. Particularly, we measure the throughput for increasing number of processors. In the second set of experiments, we study the effectiveness of the proposed optimizations on the task allocation. We measure the resource (i.e., processor) utilization of the studied applications with BTD, ETD, SR, and ESR schemes.
4.4 Discussion We must note that our overall algorithm is based on profiling information. In general, the success of a profiling scheme is largely dependent on the correct selection of the input data sets. However, our experience with the networking applications studied in this paper shows that they exhibit very similar behavior even with different input packet traces. Particularly, we have tested the four applications using three different sets of packets from the NLANR traces. For the three input sets, the mean execution times and the standard deviation for the four applications varied by less than 3%. On the other hand, our experiments show that the behavior of the applications was very much dependant on the “internal” data structures. For example, a change in the routing table structures used in IPV4Router application has a significant impact on the mean execution time of a number of elements. Therefore, to achieve effective task distribution, a user needs to carefully select the internal structures that will represent the working conditions of an application.
5.2 Throughput Analysis To evaluate the benefits of the proposed schemes, we compared the relative system throughput of multi-core processors while allocating task using our proposed schemes. The baseline configuration for these experiments is a configuration where the entire application is run in a single core. Next, we recorded the execution time for each of the benchmark applications when tasks are distributed among different cores using proposed schemes. While using multiple cores we have included a 2% performance penalty to account for synchronization. This section presents a comparison based on system throughput. We must note that pipeline parallelism in general is beneficial for data-intensive applications, because compared to data-level parallelism, it reduces the contention on shared resources. In fact, we have compared our base task distribution scheme (BTD) with a programming scheme where all the cores are executing the full application. Our results indicate that for a 4-core system running the Route application, the throughput of BTD is 35.8% higher than the throughput achieved with replicating the code on each core (which is currently the most common method for
5. Experiments 5.1 Experimental Setup The SimpleScalar/ARM version 3.0 simulator [2] is used to evaluate the proposed techniques. We modified the processor configuration to model a processor similar to execution cores in a variety of NP architectures. We compiled the Click router to run in the user level mode. It is modified to run in collaboration with the SimpleScalar simulator. The SimpleScalar simulator is modified to record the behavior of every packet within a configuration. With the use of marker elements within the configuration, we track the every packet within a click configuration and record the performance of Click elements processing the packets. We
73
programming Network Processors). Our ESR scheme, on the other hand, performs 42.2% better than this approach.
As described in Sections 5.2 and 5.3, ESR and ETD schemes use µ+k*σ as the expected processing time. Therefore, we need to select a k value. Our tests with different k values showed that k=3 gives the best results overall. For small k values, the stages for ESR and ETD were identical to those of SR and BTD, respectively. For larger k values, on the other hand, the elements with large variance were assigned to single cores (e.g., stages formed by only such elements). If the execution time for a packet is close to or smaller than the mean processing time, this particular core is underutilized, reducing overall utilization. The optimal point is achieved when both the producer and the consumer are utilized fully. The selection of k=3 is the closest case to this scenario. We have evaluated four proposed schemes in our study. BTD is the simplest scheme based on statistical properties of the packet execution. The other three schemes ETD, SR and ESR employ additional statistical properties like variation while allocating task among cores. Subsequently, we observe performance enhancement in the system due to intelligent task allocation. Figures 6 through 9 present relative performances achieved with respect to single core execution of the original application after applying the proposed schemes. We see that task distribution is highly scalable for all the schemes. On average, for 2, 4, and 8 processors, BTD scheme achieves a relative throughput of 1.78, 3.25, and 6.15, respectively. The best throughput improvement is observed for DRR application. The reason for this behavior lies in the unique nature of this application. DRR contains two elements with large execution times. Hence, we can achieve close to perfect task distribution for two processors. With SR schemes, the relative throughput for 2, 4, and 8 processors are 1.84, 3.40, and 6.42, respectively. For all the applications, we can see that SR performs better than BTD scheme. Due to replication of the processing elements that takes longer time, SR scheme improves the overall utilization of the processing cores. We can notice the improvement for higher number of cores (4 or 8) as that allows us for intelligent allocation of resources. The best performance is observed for the IPv4Router application. It has a relative throughput of 6.55 for 8 processors. As shown in Table 2, the IPv4Router application has a large variation of processing time for different elements. This variation gets benefited by the SR scheme to have even processing time for each pipelined stage and subsequently resulting high throughput scalability. The extended version of BTD and SR includes an extra slack of 3σ to the expected processing time of the elements while task allocation. As shown in the figures, this results in a throughput improvement for almost all the cases. The extended schemes perform particularly well for the RED application. For ESR, the best performance is observed for the 8-core configuration, when the throughput reaches 7, a 12.5% improvement over BTD. The reason for this improvement lies in the nature of this application. RED
8 2
7
4 8
Relative Processor Throughput
6 5 4 3 2 1 0 BTD
ETD
SR
ESR
Figure 6. Processor throughput for DRR application 8 2
7
4 8
Relative Processor Throughput
6 5 4 3 2 1 0 BTD
ETD
SR
ESR
Figure 7. Processor throughput for RED application 8 2
7
4 8
Relative Processor Throughput
6 5 4 3 2 1 0 BTD
ETD
SR
ESR
Figure 8. Processor throughput for Home_Node application 8 2
7
4 8
Relative Processor Throughput
6 5 4 3 2 1 0 BTD
ETD
SR
ESR
Figure 9. Processor throughput in Route application
Figures 6 through 9 describe the relative system throughput of different configurations for the experimental applications. The figures present the results for 4 variations as described in Section 5: Base Task Distribution (BTD), Extended Task Distribution (ETD), Selective Replication (SR), and Extended Selective Replication (ESR). Note that the distribution of stages in SR is based on BTD and ESR uses ETD strategy to place the modules into processor cores.
74
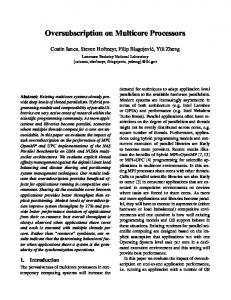
unique property of the DRR application. DRR contains two elements with large execution times. Hence, without replication, we can achieve close to perfect task distribution. Particularly, DRR achieves the best utilization for 2-core processor with 95%, which cannot be improved with the SR scheme. In addition, we see that the ETD and ESR schemes always perform better than the BTD and SR schemes, respectively. We observe a similar trend for the remaining three applications. Overall, the ESR scheme achieves the best utilization with 95%, 89%, and 84% on average for the processors with 2, 4, and 8 cores, respectively, aggregated over all four applications. The average utilization for the BTD scheme, on the other hand, is 88%, 81%, and 77% for the processors with 2, 4, and 8 cores, respectively.
consists of a number of elements with mean processing times close to each other. Therefore, by considering the standard deviation in the execution times, we see that the stage formations can be significantly changed. For other applications that are dominated by a few elements, consideration of the extended processing times usually does not cause a significant change in the stage formation. This is especially true for the DRR application, where the majority of the processing time is dominated by two modules. Moreover, ETD scheme always improves the throughput for 8 processor configurations. On average, for all four applications, it improves the throughput by 4.4%. On the other hand, the ESR scheme achieves a relative throughput of 1.90, 3.49, 6.74 for 2, 4, and 8 core processors, respectively, aggregated over all four applications. Henceforth, the combination of Selective Replication and Extended Slack results significant throughput improvement. On average, it improves the throughput by 6.4%, 8.4%, and 9.9% for 2, 4, and 8 processors as compared to the BTD scheme. We must note that the overall performance improvement achieved by our proposed schemes is synergistic. While the consideration of variance (ETD) and replication (SR) improve the performance by 4.4% and 4.3%, respectively, their combination (ESR) provides 9.9% improvement.
6. Related Work Task allocation has been an active research area in a number of domains. In behavioral synthesis research, the objective is to assign operations to hardware and optimize the usage of storage and communication paths [6]. While analogous to the problem faced here, these approaches are best suited for synthesizing datapath elements for small computational kernels. In the multiprocessor domain, Chekuri et al. [3] and Shachnai [20] proposed approximation algorithms to solve the problem for general multiprocessor models. However, they fail to consider practical resource constraints. We have used Click infrastructure which is the most relevant and established academic C++ programming model and environment for building packet processing applications on a single, general-purpose, processor. Shangri-La [4] is a work that matches our interest pretty closely. Shangri-La is based on Baker [24] that bears many similarities to Click, especially in regards to its modeling of communication channels (CCs). However, the optimizations presented in their scheme do not consider the variations observed in the packet execution. Due to architectural and technology differences, it is difficult to make any performance comparison between our system and theirs. Gordon et. al. [7] proposed schemes that employs task distribution among different cores similar to ours. The novelty of our scheme lies on the fact that the task distribution is based on the statistical. Plishker [16] exploited the flexible framework of ILP to generate optimal solutions to the mapping problem. Such techniques are usually computationally expensive. Srinivasan et al. [22] considered the scheduling problem for the Intel IXP1200 and presented a theoretical framework in order to provide service guarantees to applications. However, their methodology was not tested with real network applications. A number of programming environments were proposed for NPs. NP-Click [21] is an extended programming model based on Click Router. It is implemented on the Intel IXP1200 architecture. Memik and Mangione-Smith [14] proposed a programming environment that considers the task
5.3 Resource Utilization Analysis In the second set of experiments, we measure the average utilization of the cores. Figure 10 describes the mean utilization percentage of the cores for the DRR application. The figure presents the results for 4 variations as described in Section 5: the Base Task Distribution (BTD), the Extended Task Distribution (ETD), the Selective Replication (SR), and the Extended Selective Replication (ESR). The other applications follow the similar trends. 100 BTD
ETD
SR
ESR
95
Processor Utilization
90
85
80
75
70 2
4
8
Figure 10.Resource Utilization in DRR application
For almost all the applications, we see that the ESR scheme gives the best utilization. In general, we see that both of our optimizations increase the utilization. Particularly, SR almost always performs better than the BTD. A larger number of elements are useful for achieving a higher utilization. With the larger number of elements, we can form stages that are close to each other in the execution times. The only exception to this rule is the DRR application executed on 2 cores. For this application, SR and BTD provide the same throughput. The reason for this behavior lies in the
75
[8] Intel. The Intel® Pentium® 4 processor - Product Briefs,
allocation. However, none of these techniques used the variation in execution time to optimize the allocation schemes. Datar and Franklin [5] proposed greedy-pipe algorithm to solve problems associated with determining optimal application task assignments for pipelines in CMP based NP. However, their study is performance oriented and the execution core utilization has not done by them.
[http://www.intel.com/design/Pentium4/prodbref/index.ht m]. [9] Intel, Intel® IXP2400 Network Processor Thermal and Mechanical Design Guideline. March 2003. [10] Intel, C., Intel® IXP2800 Network Processor Product Brief. 2002: Santa Clara/CA. [11] Kohler, E. The Click Modular Router Project. in http://pdos.csail.mit.edu/click. [12] Kohler, E., et al., The Click modular router. ACM Transactions on Computer Systems, 2000. 18(3): p. 26397. [13] McMahan, S., et al. A 600 MHz NT3 network processor. in The Digest of Technical Papers for IEEE International Solid-State Circuits Conference (ISSCC). 2003. [14] Memik, G. and W.H. Mangione-Smith. NEPAL: A Framework for Efficiently Structuring Applications for Network Processors. in Workshop on Network Processors – NP2 (held in conjunction with HPCA). Feb. 2003. Anaheim, CA. [15] Motorola, C-5 Network Processor Fact Sheet. Oct. 2001. [16] Plishker, W., et al. Automated Task Allocation for Network Processors. in Network System Design Conference Proceedings. October, 2004. [17] Postel, J., Internet Control Message Protocol. RFC 792 (Sept.), Internet Engineering Task Force. ftp://ftp.ietf.org/rfc/rfc0792.txt. 1981. [18] Postel, J., Internet Protocol. RFC 791 (Sept.), Internet Engineering Task Force. ftp://ftp.ietf.org/rfc/rfc0791.txt, 1981. [19] Schreedhar, M. and G. Varghese. Efficient Fair Queueing using Deficit Round Robin. in SIGCOMM'95. Aug/Sep 1995. Cambridge, MA. [20] Shachnai, H. and T. Tamir. Polynomial time approximation schemes for class-constrained packing problems. in Proceedings of Workshop on Approximation Algorithms. 2000. [21] Shah, N., W. Plishker, and K. Keutzer. NP-Click: A Programming Model for the Intel IXP1200. in 2nd Workshop on Network Processors (NP-2) at the 9th International Symposium on High Performance Computer Architecture (HPCA-9). February, 2003. Anaheim, CA. [22] Srinivasan, A., Multiprocessor Scheduling in Processorbased Router Platforms: Issues and Ideas. Network Processor Design:Issues and Practices, November 2003. [23] Tsai, M., et al. A Benchmarking Methodology for Network Processors. in 1st Network Processor Workshop, 8th Int. Symposium on High Performance Architectures. 2002. [24] Vin, H.M., et al. A Programming Environment for Packetprocessing Systems: Design Considerations. in The Workshop on Network Processors & Applications - NP3. Held in conjunction with The 10th International Symposium on High-Performance Computer Architecture 2004. [25] Wheeler, B. and L. Gwennap, A Guide to Metro Network Processors. 8 ed. December, 2006: The Linley Group.
7. Conclusions In this paper, we have presented a method for allocating tasks in Network Processors. Our task allocation scheme utilized the modular nature of networking applications. Variation in execution time is an inherent property of processing. The goal is to estimate this variation for different parts of the code and perform the task allocation accordingly. We present two task allocation schemes. The first one (SR) simply replicates the modules based on their execution time, whereas the second one (ESR) considers the variation in execution time of the modules when making replication decisions. Results reveal several important characteristics of our proposed schemes. First, they show that the base task distribution scheme achieves high levels of scalability. In addition, the extended processing time and replication scheme help to improve the performance. In particular, the consideration of variance (ETD) and replication (SR) improve the performance by 4.4% and 4.3%, respectively. The combination of the extended processing time and the selective replication (ESR) improves the performance of the base scheme by 9.9% on average for the processor with 8 cores. It achieves an average utilization of 95%, 89%, and 84% for the processors with 2, 4, and 8 cores, respectively.
8. REFERENCES [1] Baker, F., Requirements for IP version 4 routers. RFC
1812, June 1995. [2] Burger, D. and T. Austin, The SimpleScalar Tool Set,
[3]
[4]
[5]
[6]
[7]
Version 2.0. 1997, Univ. of Wisconsin-Madison, Comp. Sci. Dept. Chekuri, C., Approximation Algorithms for Scheduling Problems,Technical Report CS-TR-98-1611,, Computer Science Department, Stanford University. August 1998. Chen, M.K., et al., Shangri-La: achieving high performance from compiled network applications while enabling ease of programming. ACM SIGPLAN Notices, 2005. 40(6): p. 224-236. Datar, S. and M.A. Franklin, Task Scheduling of Processor Pipelines with Application to Network Processors, Department of Computer Science and Engineering, Washington University in St.Louis. Devadas, S. and A.R. Newton., Algorithms for Hardware Allocation in Datapath Synthesis. IEEE Trans. On CAD, July 1989. 8, No. 7, pp. 768-781,(7). Gordon, M.I., W. Thies, and S. Amarasinghe, Exploiting coarse-grained task, data, and pipeline parallelism in stream programs, in International Conference on Architectural Support for Programming Languages and Operating Systems (ASPLOS). 2006. p. 151-162.
76