Furthermore, SecSTAR allows analysts to interactively view and explore diagrams .... in a relational database system for ease of data analysis, while SecSTAR ...
Automated Tracing and Visualization of Software Security Structure and Properties Wenbin Fang Barton P. Miller James A. Kupsch Computer Sciences Department, University of Wisconsin Madison, WI, USA
{wenbin,bart,kupsch}@cs.wisc.edu
ABSTRACT Visualizing a program’s structure and security characteristics is the intrinsic part of in-depth software security assessment. Such an assessment is typically an analyst-driven task. The visualization for security analysis is usually laborintensive, since analysts need to read documents and source code, synthesize trace data from multiple sources (e.g., system utilities like lsof or strace). To help address this problem, we propose SecSTAR, a tool that dynamically collects the key information from a system and automatically produces the necessary diagrams to support the first steps of widely-used security analysis methodologies, such as Microsoft Threat Modeling and UW/UAB First Principles Vulnerability Assessment (FPVA). SecSTAR uses an efficient dynamic binary instrumentation technique, self-propelled instrumentation, to collect trace data from production systems during runtime then automatically produces diagrams. Furthermore, SecSTAR allows analysts to interactively view and explore diagrams in a web browser. For example, analysts can navigate the diagrams through time and at different levels of detail. We demonstrated the usefulness of using SecSTAR to produce FPVA-style diagrams for a widely used and complex distributed middleware system, the Condor high-throughput scheduling system. Compared with the original manual approach in FPVA, SecSTAR shortened the initial diagram construction time from months to hours and constructed a more accurate diagram visualizing the complete runtime structure of Condor.
1. INTRODUCTION In-depth assessment of software security is typically an analyst-driven task, and visualization of the program’s structure and security characteristics is the intrinsic part of this assessment task. For example, two widely used assessment methodologies, Microsoft Threat Modeling (MTM) [15] and the UW/UAB First Principles Vulnerability Assessment (FP-
Permission to make digital or hard copies of all or part of this work for personal or classroom use is granted without fee provided that copies are not made or distributed for profit or commercial advantage and that copies bear this notice and the full citation on the first page. To copy otherwise, to republish, to post on servers or to redistribute to lists, requires prior specific permission and/or a fee. VizSec’12 October 15 2012, Seattle, WA, USA Copyright 2012 ACM 978-1-4503-1413-8/12/10 ...$15.00.
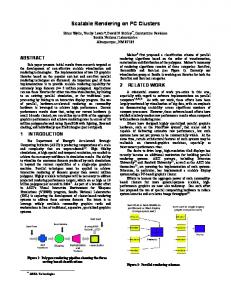
VA) [5] both require developers or analysts to construct diagrams of software systems to represent key architectural components of the system, interactions between these components, the privilege levels of each component, delegation of privilege, and how components interact with high-value resources such as files, databases and external services. These diagrams are used as a road map for later in depth (often manual) inspection of the code. However, constructing such diagrams requires extensive manual effort, causing the analyst to conduct a careful reading of source code looking for key operations such as those that operate on files and sockets or modify privilege levels. These manual static inspections of the source code are often augmented by trace data from a variety of tools such as lsof or strace. Data is collected and synthesized from a variety of sources, in different formats, to provide the basis for the analyst to manually draw the various structural diagrams. To help address this problem, we are developing an approach to dynamically collect the key information for such diagrams and automatically produce the necessary diagrams to support the first steps of MTM or FPVA. This approach is embodied in a tool called the Security System Tracing, Analysis and Reporting (SecSTAR). SecSTAR operates in two steps, data collection and visualization. We leverage a flexible and efficient dynamic binary instrumentation technique, self-propelled instrumentation [9], to collect trace data from production systems. Using self-propelled instrumentation, SecSTAR produces trace data for analyst-specified events in unmodified production systems during runtime. We monitor and trace key events, such as those involved with process creation and destruction, socket creation and connection, privilege level changes, and file I/O operations. The trace data also contains temporal information, so that the later analysis and visualization steps can analyze for time-based risks such as race conditions and animate the visualizations of the program structure. The second step of SecSTAR is a postmortem operation that visualizes the trace data generated from the data collection step. In the visualization, the trace data is used to generate SVG [18] diagrams using Graphviz dot layout [2], then these diagrams can be interactively viewed and explored in a web browser. The SecSTAR visualizer allows the analyst to navigate the diagrams through time and at different levels of detail. This process is summarized in Figure 1. To evaluate the effectiveness of SecSTAR, we conducted a case study by using it to automatically produce FPVA analysis diagrams for a real world, widely used, and complex distributed middleware system: the Condor high-throughput
Data Collection
Binary Code
Trace Data
Visualization
Diagram
Display Interface
Analyst
Figure 1: Data flow of SecSTAR scheduling system [6, 16]. We had previously conducted an in depth, manual FPVA assessment on Condor. This assessment was conducted over a nine month period by an experienced analyst, and resulted in finding several serious vulnerabilities that were not able to be found using current source code analysis tools [4]. As part of the FPVA assessment, the analyst manually produced the associated analysis diagrams. Our use of SecSTAR allowed us to compress these initial steps of FPVA to a brief and interactive task, significantly improving the productivity of security analysts. This paper is organized as follows. Section 2 surveys related topics on visualization for security analysis and introduces FPVA and MTM. Section 3 and Section 4 describe the two steps of SecSTAR: data collection and visualization. The case study on constructing FPVA diagrams is presented in Section 5. We conclude and list our path for future work in Section 6.
2. RELATED WORK This section first surveys previous work on visualization in security analysis, then we introduce two widely-used security analysis methodologies that could benefit from SecSTAR, Microsoft Threat Modeling (MTM) and UW/UAB First Principles Vulnerability Assessment (FPVA).
2.1 Visualization for Security Analysis Visualization in security analysis is typically divided into two phases, data collection and visualization. We survey four pieces of related work [3, 17, 19, 20] and compare our SecSTAR with them. Xia et al. [19] visualize program flow to aid forensics experts in detecting and identifying significant events for intrusion detection and recovery. For the data collection phase, they modify the Linux kernel to trace system calls related to process creation and file access. By contrast, our SecSTAR performs lightweight data collection using self-propelled instrumentation that collects data only for user-specified processes and directly instruments the program binary without modifying the kernel. In addition, they store trace data in a relational database system for ease of data analysis, while SecSTAR stores trace data in XML files that are both program- and human-readable and can be easily disseminated to the public. For the visualization, they show process trees, where each process is a node, and its child processes and accessed files are child nodes of it. They highlight the processes and files that are tainted after taint propagation for estimation of damage suffered following an intrusion. They do not include information about interprocess communication or privilege level of each process. Their visualization is static, showing temporal information only for
file access events. Yurcik et al. [20] designed and implemented a visualization framework, NVisionCC, to help system administrators monitor the security status of a cluster. NVisionCC only monitors and visualizes process status, because they believe that an attacker cannot gain access to cluster nodes without running at least some processes, and the appearance of unexpected processes on a cluster node is a strong indicator that the security of the node has been compromised. The visualization in NVisionCC is coarse-grained, showing only the presence or absence of certain processes. NVisionCC does not visualize relationships among processes (e.g., the parent-child relationship and communications) or other security characteristics (e.g., privilege level changes). Fink et al. [3] designed a tool to help system administrators visually correlate process activities and network traffic for ease of identifying processes that have communication patterns outside their normal behaviors. The data collection step is performed by either using a modified Linux kernel or third party tools on Windows such as IP Helper [7] and WinPcap [13] that can monitor only a limited number of events. For the visualization, they show a client/server layout of communications, where client processes are on the left side in the display and server processes are on the right. Edges connecting two processes represent network communications. Their visualization does not show process hierarchy and other important security characteristics (e.g., privilege level). Trinius et al. [17] designed an automatic technique to analyze and visualize malware behavior. In the data collection phase, a single process runs in a sandboxed environment, where the system calls made by the process, such as changes to the filesystem or network activity, are recorded. Their visualization approach uses a treemap to summarize the actions performed by the malware sample and a thread graph to summarize the temporal behavior of each thread in the sample. Their approach does not support distributed systems and animation.
2.2
MTM and FPVA
MTM [15] is a security analysis methodology that is aimed at identifying and rating the most likely threats affecting an application. This methodology requires developers to use the Threat Modeling Tool [8] to manually create a highlevel architecture diagram that depicts the structure of software systems, including subsystems and physical deployment characteristics. Figure 2a1 is an example of such diagram. After developing the architectural overview of the application, this methodology applies a list of pre-defined and known possible threats and tries to see if the application is vulnerable to these threats. Microsoft suggests that the developers participate in the threat identification. FPVA [5] is an analyst-centric (often manual) technique. It aims to focus the analyst’s attention on the parts of the software system and its resources that are most likely to contain vulnerabilities. Initial steps in FPVA produce diagrams that show the system’s key architectural components, interactions between these components, each component’s privilege level, privilege delegation, and how components interact with high-value resources. These diagrams form the basis for 1 From http://technet.microsoft.com/en-us/security/ hh855044.aspx
!"#$%&'()**$+&(,-.)(./&) $6!$2&-7-0)4)*$
!"#$*)&7)&$,'*.
*&3 2'*.4&)*50 /*)&
!"#$89*.)&
!"#$(0-)1.$,'*.
!"#$(0-)1.$2&'()**
:;+
?@$('11)(. A@$B'&C
!"#$94)1. D@$9/.,)1.-(9.) DEF@$/*)$:;+< F@$G'$H'&C
(a) MTM
(b) FPVA
Figure 2: Sample Diagrams of MTM and FPVA a risk assessment of the system, identifying which parts in the system most immediately need evaluation. Figure 2b is an example of such diagrams, showing the key components of the Storage Resource Broker (SRB) [1, 14], the interactions between these components, and each component’s privilege level. FPVA has a different philosophy from MTM, as it is performed by an assessment team independent from the developers. Nevertheless, the analysis products produced by both methodologies are quite similar. As we design SecSTAR to be general purpose for security analysis methodologies, security analysts can apply it to both MTM and FPVA. The case study in our paper focuses on generating diagrams of FPVA. Nevertheless, analysts can create diagrams in the MTM style by slightly modifying the script in SecSTAR.
3. DATA COLLECTION We discuss the data collection step for SecSTAR in this section. We introduce self-propelled instrumentation as an infrastructure, then we describe the specific tool based on this infrastructure for collecting trace data in SecSTAR.
3.1 Self-propelled Instrumentation Self-propelled instrumentation is a binary instrumentation technique that dynamically injects a fragment of code into an application process on demand [10,11]. The instrumentation is inserted ahead of the control flow within the process and is propagated into other processes, following communication events, crossing host boundaries, and collecting a distributed function-level trace of the execution. Self-propelled instrumentation contains two major components. The first is the Agent. It is a shared library that automatically inserts and propagates a piece of payload code at function call events in a running process, where the payload code contains user-defined logic, such as generating trace data for later inspection. The second component is the Injector. It is a process that causes an application process to load the Agent shared library, where the Injector should have at least the same privilege as the application process. Self-propelled
instrumentation does binary instrumentation within the application process’s address space, avoiding use of the debugging interfaces (e.g., Linux ptrace and Windows debug interface) and costly interprocess communications. Therefore, self-propelled instrumentation does not add significant overhead to a process during runtime. To enable data collection in a system, analysts use the Injector to load the Agent into the system’s processes, so that the payload code in the Agent can be triggered to collect trace data. The earlier that analysts load the Agent into the system in the communication flow, the more complete trace data they can collect, thus the more complete architectural diagram they can construct from the trace data. For example, in a client/server system, if analysts inject the Agent into a client process that is about to make a request to a server process, then they can capture a complete flow of events resulting from that request. Previously, we prototyped and used self-propelled instrumentation for problem diagnosis in distributed systems [9]. In our current project, we have re-engineered self-propelled instrumentation for robustness and portability, and now we have been applying it to security analysis.
3.2
Data Collection Tool
With self-propelled instrumentation, security analysts can easily build custom data collection tools by writing payload code in C or C++. The payload code is encapsulated in a payload function that will be invoked at function call events. In a payload function, analysts can use self-propelled instrumentation’s API to get the arguments and the return value for a function call where the payload function is invoked. The most useful functions to instrument are typically those in system libraries. For example, when a Linux user process invokes fork, we can get the process ID (or PID) of the newly created child process from fork’s return value and write a trace record with a variety of information, including the parent and child PID’s. The payload code can also inspect the /proc file system to get additional information about the current process, such as the executable name and command line arguments.
Each instrumented process produces an XML file containing trace data that records two types of information. First, it records the static information about a process at the time the Agent is loaded, such as the executable name and PID. Second, it records events as they occur during operation of the system. For each event, it records a timestamp (in microseconds) for visualizing temporal data and the data specific to an event type, such as PID for starting a new process, or host and port information when initiating a network connection. In our current design, SecSTAR supports a variety of Linux events, including process creation (fork, clone, and fork-then-exec), process destruction (exit), privilege level changes (setuid), connection establishment (connect and accept), network communication (send and recv), and file access (open, read, write and close).
Legend abbr. for executables: p: program1.exe r : program2.exe o: program3.exe Colors for privilege level: root
user1
user2
Nodes and edges: fork clone connect A process Host Multiple identical processes
4. VISUALIZATION Visualization in SecSTAR is a postmortem operation on the per-process XML trace data collected during runtime. SecSTAR constructs diagrams in SVG format, mapping from trace data to a representation that is rendered on the display. Security analysts then use a web-based interface to view those diagrams and interactively explore details in them for security analysis.
4.1 Diagram Construction SecSTAR first parses all per-process XML trace data then extracts necessary information for generating diagrams using Graphviz dot layout that is suitable for representing hierarchical or layered drawings of directed graphs. Parsing XML trace data, SecSTAR extracts time-ordered events (e.g., process creation and connection establishment) and each process’s static information such as the executable name, PID, and initial privilege level. Based on the extracted information, SecSTAR uses Graphviz to produce directed diagrams in SVG format visualizing the system architecture and security characteristics. The reason to use SVG format is two-fold. First, as SVG is an XML-based graphic format, we are able to render it in browsers and run JavaScript to control the way an SVG image is displayed. For example, we can programmatically move a packet along a communication line in the diagram. Second, an SVG image can be scaled without degrading quality because it is vector-based. SecSTAR aims to generate simple, informative, and compact diagrams for security analysis. Figure 3 shows a sample diagram generated by SecSTAR. The major elements in the diagram are concise, including only circle nodes (processes), edges (relationships among processes), and rectangles (hosts). A variety of security characteristics can be visualized on the same diagram by augmenting basic elements with labels, colors and styles. For example, different edge styles represent distinct relationships among processes (e.g., the parent-child relationship and network communications), and the node color represents a process’s privilege level. Furthermore, we apply two optimizations in the diagram to make it compact, so that the display space is well utilized. First, we use one or a few letters in a node to abbreviate the name of the process’s executable. By doing this, the node size stays small, making the whole diagram compact. Looking at these letters, security analysts can easily identify the processes having the same executable and refer
Figure 3: Sample diagram generated by SecSTAR
to the legend for the full name. Second, we use a doublecircle node to represent a group of nodes having the same parent, the same executable, and the same privilege level. This optimization prevents the diagram from becoming too wide and too sparse when there are many identical child processes in the system, for example, when a server process forks a new child process to handle each request. The diagrams in SVG format are the building blocks of animating temporal data in the system. For our current implementation, SecSTAR generates a list of static SVG diagrams, each of which is a snapshot of the system architecture after an event is triggered. Thus, each diagram becomes a frame in an animation that will be achieved when these diagrams are displayed in sequence in a web browser. In the future, we plan to directly animate elements in a SVG diagram using JavaScript for more efficient storage and processing.
4.2
Interactive Interfaces
SecSTAR’s web-based interface displays the architecture, resource, and privilege diagram in the middle, descriptions of events on the left, the legend on the right, and control widgets on the bottom (Figure 4). SecSTAR provides five types of controls for the security analyst, Navigate, Elaborate, Annotate, Filter, and Relate. In this section, we describe these controls. Navigate. Using SecSTAR, security analysts can navigate through changes of the system’s runtime structure and security characteristics over time, which enables analysts to explore temporal event patterns for anomalous behaviors in the system or to get an overview of the system’s runtime behavior. SecSTAR provides two forms of Navigate. First, analysts can manually navigate by clicking on Previous and Next buttons or adjusting the slider bar that represents the timeline for the system’s execution lifetime. Second, they can click on the Play button to enable animation of the history. Elaborate. After getting an overview of the system’s runtime behavior via Navigate, analysts can explore details of particular components in the system on demand. SecSTAR allows analysts to zoom in or out of the diagram. Zooming changes the scale of the diagram but does not fun-
Figure 4: A screenshot of SecSTAR interactive interface damentally alter the representation. Furthermore, when the analyst hovers the mouse over an element on the diagram, a tooltip is shown that provides detailed information about that element such as the full executable name and PID for a process. Annotate. It can be difficult to infer the accurate semantics of elements on the diagram, e.g., the exact intention for a specific operation such as why the system changes a process’s privilege at a certain point, or why the system initiates a network connection. To further improve its visualization, SecSTAR allows analysts to annotate the diagram by creating a label for an element, incorporating information from other sources such as development documents and source code. Filter. Analysts can narrow down the set of elements being displayed on specific conditions such as showing only processes from a particular host, having a particular privilege level, running the same executable, or accessing a particular file. Relate. When analysts click on an element on the diagram, SecSTAR can automatically highlight related elements, such as a node’s immediate neighbor nodes and all edges incident to it, all nodes with the same color as a node, and all edges with the same style as an edge. Relate saves the analyst’s time to figure out questions like what processes are talking to this particular one, what processes are children of this process, and whether this process connects to a remote host. Relate is especially useful when there are many crossing communication edges.
5.
CASE STUDY
We conducted a case study using SecSTAR to produce FPVA-style visualization for a complex, real world middleware system, the Condor high-throughput scheduling system [5, 12]. Condor is used worldwide to enable scientists, engineers, financiers, and social scientists to reliably execute extremely large and complex computational jobs. In this section, we describe the use case of generating diagrams using both SecSTAR and the original manual approach from FPVA. We then compare the cost of constructing diagrams and the quality of these diagrams in both approaches. Finally, we discuss the use of SecSTAR’s interactive interface. In our study, we used SecSTAR to recreate the diagrams created during the original manual assessment of Condor using FPVA in 2005. The use case diagrammed is starting the Condor system on all hosts, submission of a job by a user, and the execution of the job. The system diagrammed was a simple three host Condor system with one host acting as the central manager, one as a submit host, and the last as an execute host. The original study using FPVA was a manual process where an experienced security analyst collected information about the system under study, and then assembled these artifacts into manually created diagrams. The analyst used multiple means to collect this information including reading documentation and presentations, and talking to developers and knowledgeable users. As the information from these sources is often incomplete or inaccurate, the analyst refined and enhanced this information by observing a running sys-
3"#$"%&!/#(%=.&5=#=0/%&6"1( !"#$%&
&)*&+%,-,./0/1& 78&9"%:
78&9"%: 0%1*$."$*&
Legend Abbr. for executables: a: condor_shadow c: condor_collector e: condor_exec.exe i : condor_mips h: condor_schedd k: condor_kflops m: condor_master n : condor_negotiator p: condor_procd s: condor_startd r : rm u: condor_submit t : condor_starter
!"#$"%&'&%""( 21/%
'*22%'$*& B8&C/0"(,=("%& & &&!D!./
3"#$"%&1245,(&6"1(
3"#$"%&/@/!2(/&6"1( G8H/+"%(& 5=(!6
!"#$%&
78&9"%: #'(%))
B8C/0"(,=("%& !D!./ G8H/+"%( &&&5=(!6
!"#$%&
E8&5=!6,#/& 3.=11>$
78&9"%: #$"&$)
Colors for privilege level:
F8&$
A process Multiple identical processes
Host
(a) FPVA Diagram by SecSTAR
#,-!.$
I8!.=,5&6"1(
?8&9"%: #$"&$%&
7A8&1(=%(&