Invited talk in parallel session of the 2nd Indonesian Student Conference on Science and Mathematics (ISCSM-2), 11-12 October 2013, Bandung, Indonesia
Model and Visualization of Ray Tracing using JavaScript and HTML5 for TIR Measurement System Equipped with Equilateral Right Angle Prism S. Viridi1 and Hendro2 1 Nuclear Physics and Biophysics, Institut Teknologi Bandung, Bandung 40132, Indonesia Theoretical High Energy Physics and Instrumentation, Institut Teknologi Bandung, Bandung 40132, Indonesia 1 2
[email protected],
[email protected]
arXiv:1310.0000v1 [physics.optics] 12 Oct 2013
2
Abstract Trace of ray deviated by a prism, which is common in a TIR (total internal reflection) measurement system, is sometimes difficult to manage, especially if the prism is an equilateral right angle prism (ERAP). The point where the ray is reflected inside the rightangle prism is also changed as the angle of incident ray changed. In an ATR (attenuated total reflectance) measurement system, range of this point determines size of sample. Using JavaScript and HTML5 model and visualization of ray tracing deviated by an ERAP is perform and reported in this work. Some data are obtained from this visualization and an empirical relations between angle of incident ray source θ S , angle of ray detector hand θ D′ , and angle of ray detector θ D are presented for radial position of ray source R S = 25 cm , radial position of ray detector R D = 20 cm , height of right-angle prism t = 15 cm , and refractive index of the prism n = 1.5 . Keywords: deviation angle, equilateral right angle prism, total internal reflection, JavaScript, HTML5. Introduction Various forms of prism have been used in diverse optical measurement systems, such as quadrilateral prism in telescope [1, 2], trapezoid prism in measuring thin film properties [3, 4], rectangular prism in phase-velocity measurements [5], penta prism to obtain high accuracy right angle deviation [6], hollow equilateral prism for fluid refractive index measurement [7], common right angle prism for apex angle measurement [8], and equilateral right angle prism (ERAP) in angle measurement [9] and object profile measurement [10]. The last form of prism or ERAP can also be used for thickness measurement of ultrathin films [11], wide fields of view scan [12], and polarization maintaining [13]. It is reported that the use of ERAP in ATR (attenuated total reflectance) measurement system delivers difficulty in adjusting position of ray detector since it must be adjusted every time position of ray source is changed, not only the position but also its orientation [14]. In this work the relation between 1
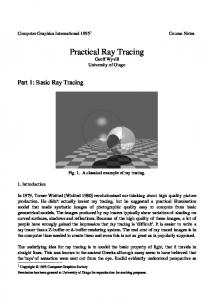
ray source position, ray detector position, and ray detector orientation will be investigated. Model and visualization are built using JavaScript and HTML5. Theory An ERAP is positioned that its height t toward x axis as illustrated in Figure 1. This ERAP will be always in a fixed position and also will not be rotated. Three points of ERAP are defined as ( x PS , y PS ) , ( x PE , y PE ) , and ( x PN , y PN ) . Subscript P indicates prism, while S, E, and N stand for south, east, and north respectively.
y (xPN, yPN)
o
(xPE, yPE)
t
x
(xPS, yPS) Figure 1. Configuration of ERAP with three points ( x PS , y PS ) , ( x PE , y PE ) , and ( x PN , y PN ) for the corners coordinates. These points are not independent to each other. The relations between them are
x PN = x PS ,
(1.a)
x PN − x PE = t ,
(1.b)
y PN − y PE = t ,
(1.c)
y PE − y PS = t .
(1.d)
And in order to simplify linear equation that will be defined, the origin of coordinate system is chosen as in Figure 1, where point o is at (0, 0). Two refraction planes and one reflection plane are defined using linear equation. Each plane has its own linear equation. The first refraction plane labeled with subscript SE (southeast), which are defined using points ( x PS , y PS ) and ( x PE , y PE ) , has linear equation
y − y PS ySE ( x ) = PE x PE − x PS
2
(x − x PS ) + y PS .
(2)
The second refraction plane labeled with subscript NE (northeast), which are defined using points ( x PN , y PN ) and ( x PE , y PE ) , has linear equation
y − y PN y NE (x ) = PE x PE − x PN
( x − x PN ) + y PN .
(3)
The only reflection plane labeled with subscript W (west), which are defined using points
( x PN , y PN ) and ( x PS , y PS ) , has linear equation xW = 0 ,
(4)
since it is a vertical line. A ray emitted from a source located at ( xS , y S ) towards coordinate origin (0, 0) propagates a long a linear equation
y ySS ( x ) = S x . xS
(5)
Point where the ray hit the prism is intersection of Equations (3) and (5) if y S > 0 and intersection of Equations (2) and (4) if y S < 0 . The point is defined as ( x 0 , y 0 ) . From point ( x 0 , y 0 ) a ray will be refracted according to Snell's law of refraction [15]
np sin θ 0i = , sin θ 0 f 1
(6)
where θ 0i , θ 0 f , and n p stand for incident angle at point o, refraction angle at point o, and prism refractive index. Number 1 is used as denominator since the medium outside the prism is air. Normal line of the first refraction plane can be obtained from
y PE − y PN x PE − x PN
θ NE = atan
π + , 2
(7)
while the angle of incident line is
yS . xS
θ SS = atan
(8)
From Equations (7) and (8) incident angle on the first refracted plane can be obtained
θ 0i = θ NE − θ SS .
3
(9)
Expression in Equation (7) is an example if ray source is from first quadrant or y S > 0 . If ray source from fourth quadrant or y S < 0 , then Equation (7) must use Equation (2) instead of Equation (3). From point ( x 0 , y 0 ) , the ray must propagate along a line with linear equation
[
]
yS0 (x ) = tan (θ NE + θ 0 f )x + y 0 − tan (θ NE + θ 0 f )x0 .
(10)
This line intersects reflection plane defined by Equation (4), which gives point ( x1 , y1 ) . On the reflection plane incident angle is obtained from
θ1i = 0 − (θ NE + θ 0 f ) ,
(11)
and the reflection angle will be the same
θ1 f = θ1i ,
(12)
according to Snell’s law of reflection [15]. Value 0 in Equation (12) is obtained from the direction of normal line from the reflection plane. Similar to Equation (10), the reflected ray must propagate from ( x1 , y1 ) along a line described by linear equation
[
]
yS1 ( x ) = tan (0 + θ1 f )x + y1 − tan (0 + θ1 f )x1 .
(13)
The next step is to find the intersect point between Equation (13) and the second refraction plane, which is defined by Equation (2). The point is labeled as ( x 2 , y 2 ) . Normal of this refraction plane is obtained similar to Equation (7), which gives
y PE − y PS x PE − x PS
θ SE = atan
π − . 2
(14)
At this point, the ray is refracted from denser medium to lesser medium, so that the Snell’s law of refraction becomes
sin θ 2i 1 = , sin θ 2 f n p
(15)
θ 2i = 0 − (0 + θ1 f ).
(16)
with
From point ( x 2 , y 2 ) , the ray suppose to hit the detector. The ray propagates along a line defined by
4
[
]
yS2 (x ) = tan (0 + θ 2 f )x + y 2 − tan (0 + θ 2 f )x 2 .
(17)
Illustration of points ( xS , y S ) , ( x 0 , y 0 ) , ( x1 , y1 ) , ( x 2 , y 2 ) , ySS ( x ) , yS0 ( x ) , yS1 ( x ) , and
yS2 ( x ) is given in Figure 2. (yS, xS)
ySS(x) (y0, x0) (y1, x1)
yS1(x) yS2(x)
(y2, x2) yS3(x)
Figure 2. Tracing of the ray of an ERAP with source located in first quadrant ( y S > 0 ) and position of points ( xS , y S ) , ( x 0 , y 0 ) , ( x1 , y1 ) , and ( x 2 , y 2 ) and the liniear equations ySS ( x ) ,
yS0 ( x ) , yS1 ( x ) , and yS2 ( x ) . Model and visualization Model of ray tracing is represented by points which are defined by Equations (1) – (17) applying only Snell’s law of refraction and reflection and linear equation. After obtaining
( xS , yS ) , ( x0 , y 0 ) , ( x1 , y1 ) , ( x 2 , y 2 ) , and also ( x 3 , y 3 ) the trace of ray can be visualized. The last points ( x 3 , y 3 ) is the outmost position where prism deviated ray should be drawn. Visualization of the ray tracing is constructed using HTML5 and its JavaScript implementation. Google Chrome version 29.0.1547.66 m is used as internet browser to show the model and visualization result. Three files are generated in this work, which are atr.html, style.css, and script.js. All files can be found in here [16]. Details of HTML5, JavaScript, and CSS can found in various resources in internet, e.g. W3Schools [17].
5
Figure 3. Visualization result using HTML5, JavaScript, and CSS [16]. Results and discussion Some parameters are used in the model and visualization, whose symbol and its meaning is given in Table 1. Tabel 1. Parameters used in the model and visualization. Symbol
Unit
Meaning
RS
cm
θS
°
angular position of ray source*
RD
cm
radial position of ray detector*
θD
°
angular position of ray detector
θ D′
°
orientation of detector*
t
cm
n
-
radial position of ray source
thickness of ERAP prism refractive index
*Angle is measured from x axis in counter clockwise direction.
6
Figure 4. Results of ray tracing with R S = 25 cm, R D = 20 cm, t = 15 cm, and n = 1.5 for:
θ S = 20 °, θ D = -29 °, θ D′ = -20 ° (left) and θ S = 74 °, θ D = -63 °, θ D′ = -74 ° (right). Result of the visualization can be seen in Figure 3, where it can also be access remotely since it is build using HTML and viewed with an internet browser. For two different parameters, examples of ray tracing are given in Figure 4, where left part if for small angular position of ray source, while right part is for large angular position of it. Relations between θ S , θ D , θ D′ , and y1 are given in Figure 5 accompanied with empirical equations. Relation between θ S and θ D′ is not given since both have the same value as in a parallel prism. From Figure 5.(a) the relation between θ D and θ D is almost linear but still dependent detector radius R D . Information of θ S - θ D value in Figure 5.(b) might be useful in designing automatic positioning of ray detector as function of ray source position. Orientation of detector θ D′ on detector position θ D as given in Figure 5.(c) shows that the use of ERAP is not easy as the use of semicircular prism. In the case of semicircular prism it always holds that θ D′ = θ D , which makes the setup very easy. The last parameter which is also important is y1 , where its relation with θ S is given in Figure 5.(d). This parameter limits the size of sample which is used, e.g. in ATR method. If the sample is smaller than value of
y1 in some certain θ S , then at that angle there will be no valid signal detected in detector. Observer should be aware of this limitation before the experiment is performed.
7
Further plan is to generate more general data that also shows the dependence to prism refractive index and detector radius. It also would be better when the relation of θ S , θ D , θ D′ , and y1 can be obtained analytically. -20
180
-30
(θS - θD) = 1.609 θS + 17.58 R² = 0.999
160
θD = -0.609 θS - 17.58 R² = 0.998
140 120
θD
θS - θD
-40 -50
100 80 60 40
-60
20 -70
0 0
20
40
60
80
100
0
20
40
θS
60
100
80
100
θS
(a)
(b)
0
15.0
-10
θD' = 1.639 θD + 28.74 R² = 0.998
-20
y1 = 7E-05 θS3 - 0.006 θS 2 + 0.273 θS - 5.092 R² = 0.995
11.0
-30 7.0
-40
y1
θD'
80
-50
3.0
-60 -70
-1.0
-80 -90
-5.0 -70
-60
-50
-40
-30
-20
0
θD
20
40
60 θS
(c)
(d)
Figure 5. Relations between θ S , θ D , θ D′ , and y1 . Conclusion In this work model and visualization of ray tracing deviated by an ERAP (equilateral right angle prism) has been performed using HTML5 and JavaScript, enhanced with CSS to make the view more user friendly. As the results four empirical relation between θ S , θ D , θ D′ , and
y1 has been obtained. Value of R 2 of these relations are more than 0.995.
8
Acknowledgements This work is supported partially by Riset Inovasi KK (RIK) ITB in year 2013 with contract number 248/I.1.C01/PL/2013. References [1] H. S. Uhler, “On the rotation of constant deviation prisms”, Physical Review I 29 (1), 37-
55 (1909). [2] W. E. Forsythe, “The rotation of prisms of constant deviation”, Astrophysical Journal 45,
278-284 (1971). [3] H. P. Weber, F. A. Dunn, and W. N. Leibolt, “Loss measurements in thin-film optical
waveguides”, Applied Optics 12 (4), 755-757 (1973). [4] R. Ulrich and R. Torge, “Measurement of thin film parameters with a prism coupler”,
Applied Optics 12 (12), 2901-2908 (1973). [5] W. V. Sorin, B. Y. Kim, and H. J. Shaw, “Phase-velocity measurements using prism
output coupling for single- and few-mode optical fibers”, Optics Letters 11 (2), 106-108 (1986). [6] S. Chatterjee and Y. P. Kumar, “Simple technique for the fabrication of a penta prism
with high accuracy right angle deviation”, Applied Optics 46 (26), 6520-6525 (2007). [7] R. A. Synowicki, G. K. Pribil, G. Cooney, C. M. Herzinger, S. E. Green, R. H. French, M.
K. Yang, J. H. Burnett, and S. Kaplan, “Fluid refractive index measurements using rough surface and prism minimum deviation techniques”, Journal of Vacuum Science and Technology B 22 (6), 3450-3453 (2004). [8] A. M. Ghodgaonkar and R. D. Tewari, “Measurement of apex angle of the prism using
total internal re&ection”, Optics and Laser Technology 36 (8), 617-624 (2004). [9] T. Matsumoto, Y. Kitagawa, M. Adachi, and T. Minemoto, “Profile measuring method
based on reflection characteristics at a critical angle in a right-angle prism”, Applied Optics 30 (22), 3205-3209 (1991). [10] P. S. Huang and J. Ni, “Angle measurement based on the internal-reflection effect and
the use of right-angle prisms”, Applied Optics 34 (22), 4976-4981 (1995). [11] H. Kitajima, K. Hieda, and Y. Suematsu, “Thickness measurement of ultrathin films on
metal substrates using ATR”, Applied Optics 19 (18), 3106-3109 (1980). [12] M. V. Dorofeeva, “Features of using a right-angle prism to scan wide fields of view”,
Journal of Optical Technology 77 (7), 429-431 (2010). [13] R. M. A. Azzam, “Total internal reflection without change of polarization using a right-
angle prism with half-wavelength-thick optical interference coating”, Optics Letters 34 (3), 371-373 (2009).
9
[14] Y. Pratama, “Setup prisma siku untuk studi pemantulan total teredam”, Skripsi S.Si.,
Institut Teknologi Bandung, 2011. [15] Wikipedia contributors, “Snell's law”, Wikipedia, The Free Encyclopedia, 11 October
2013, 11:25 UTC, oldid=576707456 [accessed 20131012]. [16] S. Viridi and Hendro, “Model of Ray Tracing in ATR Method using JavaScript”, Physics
Department,
Institut
Teknologi
Bandung,
Bandung
40132,
Indonesia,
Versi
20131010.1111+07, URI http://portal2.fi.itb.ac.id/viridi/atr.html [accessed 20131012]. [17] “w3schools.com – the world’s largest web development site”, Refsnes Data, URI
http://www.w3schools.com/ [accessed 20131012].
10