Journal of Physics: Conference Series
Related content
PAPER • OPEN ACCESS
Automatic aeroponic irrigation system based on Arduino’s platform To cite this article: A P Montoya et al 2017 J. Phys.: Conf. Ser. 850 012003
- DEVICES FOR OBSERVATORY AUTOMATION R. K. Honeycutt, B. R. Adams, D. J. Swearingen et al. - Automation and Monitoring Smart Kitchen Based on Internet of Things (IoT) F Nugroho and A B Pantjawati - Real time fish pond monitoring and automation using Arduino Z. Harun, E. Reda and H. Hashim
View the article online for updates and enhancements.
This content was downloaded from IP address 66.249.88.88 on 23/10/2018 at 15:08
5th Colombian Conference of Engineering Physics (V CNIF) IOP Conf. Series: Journal of Physics: Conf. Series 1234567890 850 (2017) 012003
IOP Publishing doi:10.1088/1742-6596/850/1/012003
Automatic aeroponic irrigation system based on Arduino’s platform A P Montoya, F A Obando, J G Morales and G Vargas Universidad Nacional de Colombia, Medelln, Colombia. Calle 59A N63-20, Bloque 58 E-mail:
[email protected] Abstract. The recirculating hydroponic culture techniques, as aeroponics, has several advantages over traditional agriculture, aimed to improve the efficiently and environmental impact of agriculture. These techniques require continuous monitoring and automation for proper operation. In this work was developed an automatic monitored aeroponic-irrigation system based on the Arduino’s free software platform. Analog and digital sensors for measuring the temperature, flow and level of a nutrient solution in a real greenhouse were implemented. In addition, the pH and electric conductivity of nutritive solutions are monitored using the Arduino’s differential configuration. The sensor network, the acquisition and automation system are managed by two Arduinos modules in master-slave configuration, which communicate one each other wireless by Wi-Fi. Further, data are stored in micro SD memories and the information is loaded on a web page in real time. The developed device brings important agronomic information when is tested with an arugula culture (Eruca sativa Mill). The system also could be employ as an early warning system to prevent irrigation malfunctions.
1. Introduction Aeroponics is a culture technique where the plant roots are suspended in the air and they are intermittently sprayed with a nutrient solution. This technique has been used both in research and crops commercial production [1, 2, 3, 4, 5]. Aeroponics presents great advantages over traditional agriculture, like reduced the consumption of water and nutrients, increased of growth rate, plant density and therefore crop productivity [6, 2, 7]. Its main disadvantage is crop susceptibility to electrical faults of the irrigation system [8, 7]. To optimize resources consumption and root’s oxygenation [5], the nutrient solution is applied intermittently and recirculated, therefore it is necessary to continuously monitoring the consumption and level of the nutrient solution, as well as the correct operation of pumps and valves, because a system failure could cause crop loss, due to the lack of substrate of plants. It is also fundamental in this hydroponic systems monitoring the temperature, pH and electrical conductivity of the nutrient solution, since these variables are determinant in the nutrition of the crop. Some work has been done on this regard. Reyes et al. [9], proposed the development of a monitoring and control system based on wireless communication protocol Xbee. In that article there is not a description of the materials and methodology used to develop the proposed irrigation system, which is based on the relative humidity within the root humidity-chamber. On the other hand, It has been some advances in the automation, monitoring and control of the nutritive solution in the production of potatoes seeds in aeroponic systems, providing roots
Content from this work may be used under the terms of the Creative Commons Attribution 3.0 licence. Any further distribution of this work must maintain attribution to the author(s) and the title of the work, journal citation and DOI. Published under licence by IOP Publishing Ltd 1
5th Colombian Conference of Engineering Physics (V CNIF) IOP Conf. Series: Journal of Physics: Conf. Series 1234567890 850 (2017) 012003
IOP Publishing doi:10.1088/1742-6596/850/1/012003
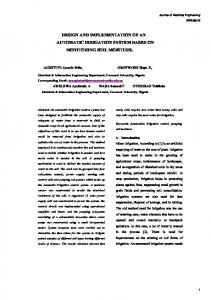
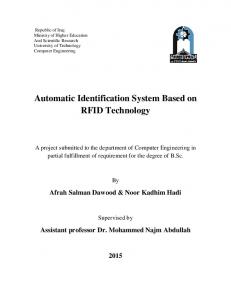
with water and nutrients independently, using ultrasonic actuators for nutrients and sprinklers for water supply [10]. There are different automation solutions that can be used in aeroponic irrigation system, although its functionality is limited and costs and maintenance are high [11]. Designs that involves the use of open source software and hardware is an economical alternative for the development of automatic monitoring and control systems. Arduino is today one of the most popular open platforms used to obtain a large number of applications [12]. Recent applications in the agricultural area use Arduino as a platform for the development of control systems. Bitella et al. [13], Ferrarezi et al. [14], and Siva [15] worked in an automatic irrigation systems in soil cultivation. While Bajer & Krejcar [16], and Groener et al. [17], implemented a monitoring and control system for a greenhouse operation. Regarding aeroponics, Jonas et al. [18], developed an automatic monitoring system to control the environmental and irrigation conditions of a small aeroponic chamber using Arduino. The system controls the irrigation frequency based on the root chamber moisture. All the information is send to a web server and share in Twiter. In the literature review it was not possible to find information related to the implementation of low cost systems for monitoring pH and electrical conductivity of hydroponics nutrient solution. There is a generalized lack of information in scientific literature related with the monitoring and automation of hydroponic irrigation systems. This paper presents the construction of a low cost system for monitoring and automating the aeroponic irrigation of a greenhouse research facility. In addition to automate the irrigation frequency several variables associated with the nutrient solution and the proper functioning of the irrigation system are monitored, like the pH and electrical conductivity of the nutrient solution. The information provided by the system is stored in microSD memory and it can be accessed in real time by an Internet web server and Bluetooth. 2. Materials y methods 2.1. Irrigation system hardware 2.1.1. Greenhouse aeroponic system The implementation was carried out in a chapelgreenhouse facility with an area of 16x8m, average height 4m, built in steel structure and antidrip thermal plastic gauge 6. The greenhouse has roller side windows activated by gearmotors. The facilities are located at 6.26, -75.57, altitude 1469 m.s.n.m, Medellin-Colombia. The measurement of external climatic variables was performed with a weather station (Davis Vantage Pro 2). While the internal monitoring has been made using self-made aspiration thermohigrometers. The greenhouse has nine aeroponic-recirculating growing beds, with dimensions of 1x6m and maximum capacity of 2000 plants each. The beds were built in aluminum, black plastic and expanded polystyrene gauge 6 (EPS). Each bed has a hydraulic pump, nutrient solution tank and independent recirculation system, which included filters and 24 sprinkles (0.0097 sl ) each one. The diagram of the hydraulic system of two of the beds can be seen in Figure 1. Due it was available only one pH sensor and one EC sensor, normally open and closed solenoid valves were used to make independently measurements of these variables for each bed. 2.1.2. Arduino’s modules For monitoring and automating the irrigation of the aeroponic system, two Arduino Mega modules in master-slave configuration were used. They were packaged on PVC boxes with external connectors for instrumentation and communications. The master module is used for storing data in a microSD memory, it is also in charge of microclimatic data adquisition, Wi-Fi and Ethernet communications. The Arduino-slave was used for monitoring and automation of the irrigation system, it is also saved their own information in a microSD memory and is in charge of the bluetooth comunication. The devices used in the implementation can be appreciate in the connection diagram in Figure 2.
2
5th Colombian Conference of Engineering Physics (V CNIF) IOP Conf. Series: Journal of Physics: Conf. Series 1234567890 850 (2017) 012003
IOP Publishing doi:10.1088/1742-6596/850/1/012003
Figure 1. Implementation diagram.
Figure 2. Detailed Master-Slave connection diagram. Independent power sources of 12V and 5V, 6 and 4A respectively, were used to power all the sensors and solenoid valves. The hydraulic pumps were connected to 110 VAC. Table 1 detailed the measured variables and sensors used in this implementation.
3
5th Colombian Conference of Engineering Physics (V CNIF) IOP Conf. Series: Journal of Physics: Conf. Series 1234567890 850 (2017) 012003
IOP Publishing doi:10.1088/1742-6596/850/1/012003
Table 1. Implemented sensors and measured variables. Measure variable
Sensor
Sensor principle
Calibration curve
Nutritive solution temperature Level Flow Pump electric current Electrical conductivity pH
LM35 HC-SR04 YF-S201 ACS-71 HI3001 HI1001
Solid state Ultrasound Hall effect Hall effect Potentiometric Electrolytic
T = 113.1v − 7.8593 Level = 0.0003V 2 − 0.3058lt
EC = 4960.3v − 1359.1 pH = 6.383v − 1.1702
2.1.3. Instrumentation The nutritive solution temperature sensors were protected on aluminum-PVC probes, as shown in Figure 3. These probes were immersed into the storage bins, looking that the sensor was completely sealed. The probes were calibrated using analogous bulb thermometers as pattern. The resulting calibration equation can be seen in Table 1, were T is te temperature in Celsius degrees and v is the voltage output of the sensors, given in millivolts.
Figure 3. Implemented monitoring system. The ultrasonic level sensors were installed on top of the storage bins. These were calibrated by measuring with a ruler and volumetric pattern of one liter. The resulting calibration equation is shown in Table 1, were V is the volume of nutritive solution given in liters and Level is the actual level in cm. The flow sensor was located in the pipe between the pump and the sprinklers. This sensor is pre-calibrated and the calibration curve was verified through timed volumetric measurement. The sensor was connected to the Arduino by one of the serial ports. The electric current measurement is used to monitoring the proper functioning of the irrigation system. Through this variable is establishing the energy consumption of the hydraulic pump for each growing bed, verify the irrigation frequency and the proper functioning of the
4
5th Colombian Conference of Engineering Physics (V CNIF) IOP Conf. Series: Journal of Physics: Conf. Series 1234567890 850 (2017) 012003
IOP Publishing doi:10.1088/1742-6596/850/1/012003
pumps. When the pump is working correctly the electric current oscillates around 2.42 - 2.18 A. When the current value is zero indicates that the pumps are off. If the current value exceeds the standard value, indicates that pump presents problems and should be revised. The pH and EC sensors were installed in the common pipe of the growing beds. Such probes were connected to a HI-98143 transmitter, responsible for amplifying signals to 4-20 mA. This signal are adapted to voltage using precision resistors of 110 Ohm, to be acquired by the Arduino analogs inputs. The resulting voltage signal is differential, so it was necessary to configure four analog Arduino’s inputs as differential inputs. To achieved this, Arduino’s microcontroller registers were modified using AVR-C language, resulting in a library that allows analog data acquisition in differential mode with an adjustable gain between 10-200. Since the measurement of pH and EC do not performed continuously and the probes most remained always submerged, the measurement routine included a process of pipe pre-cleaning with nutrient solution. After the measurement, the pipes and the three-way manifold, where sensors were installed, is washing and filling with clean water until the next measurement. The probes were calibrated using pH and conductivity buffer solutions. The accuracy of the measurements was tested against a pH and EC meter using nutritive solutions at different concentrations. The obtained calibration equations can be seen in Table 1, where pH and EC are the values of pH and electrical conductivity (uS/cm2 ) and v is the voltage value received in the differential pins of Arduino. The pH and EC electrodes were calibrated weekly to ensure proper operation and service. The measurements of these variables were temperature compensated. 2.1.4. Acting system This system includes four solenoid valves per growing bed, three valves are normally closed and one is normally open, as can be seen in Figure 4. In addition a hydraulic l flow and a maximum hydraulic head of 36 m is used. Besides, four pump of 21 HP, 36 min electro-valves were used in the measurement and cleaning routine.
Figure 4. Aeroponic irrigation system actuators assembly. All actuators were powered through a 16 channel relay module, which is connected to the 00 digital outputs of slave Arduino. Plastic low pressure 12 diameter, 12 V - 0.5 A, solenoid valves were driven directly by the relay module, while the pumps were activated using additional contactors of 110 VAC. In Figures 1 and 4 it can be appreciate the detail of the devices that make up the system. Keeping in mind that not all elements are installed in the same place, for clarity the diagram of the process of the irrigation system is detailed in Figure 2.
5
5th Colombian Conference of Engineering Physics (V CNIF) IOP Conf. Series: Journal of Physics: Conf. Series 1234567890 850 (2017) 012003
IOP Publishing doi:10.1088/1742-6596/850/1/012003
2.1.5. Comunication Through bluetooth protocol may it access the information from the sensors and performing the test automation using the slave peripheral bluetooth module HC-05. This information can be accessed from any device with this kind of communication (phone, tablet, among others). Communication is established in the 2.4GHz band, with a range between 5 and 10 m away. Master-Slave communication located 9m away one each other is done wirelessly via Wi-Fi. The wireless network is composed by two devices with password protected and has a range of 15-20m. The slave sends information related to the irrigation system. This data is stored redundantly in a 2GB microSD memory on the slave device, while the master store the same information besides the greenhouse climate data. Theremore, the master device is connected to internet by Ethernet Industrial Protocol using the W5100 module. Information on climatic variables and irrigation is loaded to the website: http://168.176.108.50:4025, with a sampling rate of one minute. This information could be accessed from anywhere with Internet access. The Figure 5 shows a screenshot of the mentioned website, where it can be appreciate climatic and irrigation information in addition to alarm indicators.
Figure 5. Web page screenshot.
2.2. Arduino’s software In the master module was programmed routines for climate data acquisition, wireless communication, microSD memory storage and publication of data on the web. Whereas, in the slave device was programmed the same routines, except the web page publication one. Additional routines for irrigation and measuring EC and pH were programmed. The flow diagram of the main routine of both modules can be seen in Figure 6. In the slave module was programmed diurnal and nocturnal irrigation frequency for each growing bed. The irrigation frequency is synchronized with the data acquisition , so when an irrigation cycle is performed the data are save in the microSD and send to the master module along with the acquisition time given by the Real Time Clock module. They were also scheduled three alarms to alert system malfunction. The Alarm of the nutrient solution ending is activated when the liquid level in the storage tank reaches a minimum value (5 cm). The Alarm for the clogged sprinklers is activated when there is more than 4 sprinklers
6
5th Colombian Conference of Engineering Physics (V CNIF) IOP Conf. Series: Journal of Physics: Conf. Series 1234567890 850 (2017) 012003
IOP Publishing doi:10.1088/1742-6596/850/1/012003
Figure 6. Main program flow diagram of master and slave modules. plugged on a bed, an then the flow supplied by the pump is below minimum value. Finally, the alarm for the shutdown system is activated when a pump is activated and the pumped flow is zero. Indirectly it is possible to know electricity failures or Internet connection malfunction, if a pump is not active for long time or when the information on the website is not updated every minute. In Figure 5, it can be seen a detail of these alarms. 2.3. System test An arugula crop (Eruca sativa Mill) was used to tests the implemented irrigation system. It was stablished a seedbed with 300 arugula seeds, planted in individual plastic containers with pine sawdust substrate. The plants were transplanted to the aeroponic beds at cotyledon state, when it was observed that the root protruded of the container (five days after seeding). System performance was recorded for 60 days between the months of May to July 2016. The tests were performed on two beds, one with the arugula crop and the other one totally seal without crop. The irrigation frequency was established in 15 seconds turned on by 400 seconds turned off, using a modified Hoagland nutrient solution, diluted 50% with EC between uS 1200-1500 cm 2 and pH between 5.5-6.5, measured at the preparation time. The diluted Hoagland nutrient solution was change one week after transplant for a full one, with EC and pH between uS 5.5-6.5 and 2100-2500 cm 2 , respectively, measured at preparation time. The nutrient solutions were manually prepared for each bed. The tanks were filled with 90 L of nutrient solution, equivalent to 31 cm in their respective bins. Independent tests were performed to monitor the consumption of the solution and the evolution of EC, pH, temperature solution, flow and pump electrical current in both beds. 3. Results y discussion The external and internal climatic conditions during the test are show in Figure 7. The maximum and minimum internal temperature were 44 °C and 17 °C respectively, while the relative humidity was between 9-100 %. Figure 8 shows a the nutrient solution consumption in the two beds during 78 hours of continuous operation. The identical tanks were filled with 87 L of nutritive solution. The minimum level was set at 27 L,to prevent plants lost. Both growing beds were totally sealed 7
5th Colombian Conference of Engineering Physics (V CNIF) IOP Conf. Series: Journal of Physics: Conf. Series 1234567890 850 (2017) 012003
IOP Publishing doi:10.1088/1742-6596/850/1/012003
Figure 7. Climatic condition during five test days. except for the holes where the plants are located. The bed without plants decreased their nutrient solution level due to evaporation, while in the growing bed with crop, the consumption of the solution is due to evapotranspiration. Subtraction of both consumptions results in crop transpiration for each time instant. The total evaporation during the 78 h test was 11.91 L, while the evapotranspiration was 63.12 L, resulting in a crop transpiration of 51.07 L during the 78 h. The resulting individual plant transpiration was 2.18 mL h . As expected, the greatest changes in evaporation occur during the day, which have higher temperatures and lower humidities. To avoid interfering with the nutrient solution consumption monitoring trials, independent tests for monitoring EC, pH, temperature and flow were made. In Figure 9, at 9:30am of the first day, it can be see the change of the old Hoagland nutritive solution for a new one. The old solution (half Hoagland) were replaced with 90 L of a complete Hoagland solution for the bed with crop (pH 6). The other bed is running with tap water (pH 7). It can be seen that the first measurement after the solution change, has a pH of 6.3, this value is due to the traces of the old nutritive solution in the pipes, so both pH values are slightly above of the the actual value at the time of the preparation. Small variations in pH are seen during the test, showing slight increases during the day and a tendency to increase the pH of the solution as it is consumed. Regarding the electrical conductivity of the nutritive solution, in the Figure 10 is possible to appreciate the moment of the solution change, from a diluted Hoagland solution (50%), uS uS with conductivity 1400 cm Due to the 2 , for the complete solution (100%) with 2500 cm2 .
8
5th Colombian Conference of Engineering Physics (V CNIF) IOP Conf. Series: Journal of Physics: Conf. Series 1234567890 850 (2017) 012003
IOP Publishing doi:10.1088/1742-6596/850/1/012003
Figure 8. Nutritive solution consumption comparison during 78 h. For a growing bed without plants (blue) and a bed with 300 plants (red). The green line represents the crop transpiration.
Figure 9. Nutritive solution pH comparison for a growing bed without plants (blue) and a bed with 300 plants (red). instrument accuracy (200
uS ), cm2
it was not possible to conclude about the variations of that
9
5th Colombian Conference of Engineering Physics (V CNIF) IOP Conf. Series: Journal of Physics: Conf. Series 1234567890 850 (2017) 012003
IOP Publishing doi:10.1088/1742-6596/850/1/012003
variable throughout the day, but it is possible to establish that there is a tendency to increase the conductivity of the nutrient solution during the test in the crop bed.
Figure 10. Nutritive solution EC comparison for a growing bed without plants (blue) and a bed with 300 plants (red). The results of temperature measurements are presented in Figure 11. It can be appreciated that the temperature of the nutritive solution of the bed with crop has a mean temperature of 25 ◦ C, while the bed without crop has a mean of 24 ◦ C. The LM35 temperature sensor has an accuracy of ±1 ◦ C, so that it is possible to consider that both values are the same and the temperature of the solution remains relatively constant throughout the experiment.
Figure 11. Nutritive temperature solution comparison for a growing bed without plants (blue) and a bed with 300 plants (red).
10
5th Colombian Conference of Engineering Physics (V CNIF) IOP Conf. Series: Journal of Physics: Conf. Series 1234567890 850 (2017) 012003
IOP Publishing doi:10.1088/1742-6596/850/1/012003
4. Conclusions The automatic monitored aeroponic-irrigation system based on the Arduino free software platform present good performance when it is implemented in a research greenhouse. This results can be applied in a commercial greenhouse with polyculture or when different nutrient solutions formulation are employed. For this particular application the most difficult implementation task lies in the fact of having just one EC and pH probes for monitoring different nutrient solutions. In a commercial application, such difficulty is eliminated, since these systems only has a central tank of nutrient solution, therefore, the measurements can be realized continuously. Arduino platform can be used as a data acquisition system for differential output sensors like EC and pH probes, using the differential configuration showed here, reducing the cost of such implementations. The deployment of information and alarms on a website is very useful, allowing to take appropriate control irrigation actions to avoid crop loss. It is considered relevant for future work automatically send alarm signals directly to the final user of the system through mobile devices. In addition, there is a desirable to develop a complementary automatic system to prepare the nutrient solution based on the EC and pH. References [1] Komosa A, Kleiber T and Markiewicz B 2014 Acta Sci. Pol., Hortorum Cultus 13 163–177 ISSN 1644-0692 [2] Lakkireddy K, Kasturi K and Sambasiva Rao K R S 2012 Research & Reviews: . . . 1 26–35 ISSN 2278 2206 URL http://stmjournals.com/sci/index.php?journal=RRJoAST{\&}page=article{\&}op= view{\&}path[]=50 [3] Mbiyul M W, Muthoni J, Kabiral J, Elmar G, Muchiral C, Pwaipwail P, Ngaruiyal J, Otienol S and Onditil J 2012 Journal of Horticulture and Forestry 4 172–177 URL http://www.academicjournals.org/journal/ JHF/article-abstract/C5947BF2821 [4] Nir I 1981 Growing Plants in Aeroponics Growth System [5] Peterson L A and Krueger A R 1988 Crop Science 28 712–713 ISSN 1098-6596 (Preprint arXiv:1011.1669v3) [6] Chiipanthenga M, Maliro M, Demo P and Njoloma J 2012 African Journal of Biotechnology 11 3993–3999 [7] Putra P A and Yuliando H 2015 Agriculture and Agricultural Science Procedia 3 283–288 ISSN 22107843 URL http://www.sciencedirect.com/science/article/pii/S2210784315000558 [8] Carruthers S 1992 Practical Hydroponics & Greenhouses [9] Reyes J L, Montoya R, Ledesma C and Ram´ırez R 2012 Acta Horticulturae 947 153–156 ISSN 05677572 [10] Idris I and Sani M I 2012 Proceedings of 2012 IEEE Conference on Control, Systems and Industrial Informatics, ICCSII 2012 120–125 [11] Gaddam A, Al-Hrooby M and Esmael W F 2014 Designing a Wireless Sensors Network for Monitoring and Predicting Droughts Proceedings of the 8th International Conference on Sensing Technology pp 210–215 ISSN 21568073 [12] Mesas-Carrascosa F, Verd´ u Santano D, Mero˜ no J, S´ anchez de la Orden M and Garc´ıa-Ferrer A 2015 Biosystems Engineering 137 73–83 ISSN 15375110 URL http://www.sciencedirect.com/science/ article/pii/S1537511015001208 [13] Bitella G, Rossi R, Bochicchio R, Perniola M and Amato M 2014 Sensors (Switzerland) 14 19639–19659 ISSN 14248220 [14] Ferrarezi R S, Dove S and Van Iersel M W 2014 A Low Cost, Arduino-based System for Monitoring and Controlling Substrate Water Content 2014 ASHS Annual Conference [15] Siva Kumar P, Jilani S A K and Venkata Raman B 2015 International Journal of Advanced Research in Electronics and Communication Engineering (IJARECE) 4 [16] Bajer L and Krejcar O 2015 IFAC-PapersOnLine 48 368–373 ISSN 24058963 URL http://www. sciencedirect.com/science/article/pii/S240589631500837X [17] Groener B, Knopp N, Korgan K, Perry R, Romero J, Smith K, Stainback A, Strzelczyk A and Henriques J 2015 Procedia Engineering 107 470–479 ISSN 18777058 URL http://dx.doi.org/10.1016/j.proeng. 2015.06.105 [18] Jonas P, Maskara A, Salguero A and Truong A 2015 Garduino: A Cyber-Physical Aeroponics System (Preprint arXiv:1011.1669v3) URL http://ecal.berkeley.edu/files/ce186/projects/ truonganders{\_}4941954{\_}63829747{\_}Garduino-1.pdf
11