Automatic brain tumor segmentation using symmetry analysis and deformable models. Hassan Khotanlou, Olivier Colliot* and Isabelle Bloch. GET-Ecole ...
1
Automatic brain tumor segmentation using symmetry analysis and deformable models
Hassan Khotanlou, Olivier Colliot∗ and Isabelle Bloch GET-Ecole Nationale Sup´ erieure des T´ el´ ecommunications D´ epartement TSI, CNRS UMR 5141 LTCI 46 rue Barrault, 75634 Paris Cedex 13, France E-mail: {Hassan.Khotanlou,Olivier.Colliot,Isabelle.Bloch}@enst.fr
We propose a new general automatic method for segmenting brain tumors in 3D MRI. Our method is applicable to different types of tumors. A first detection process is based on selecting asymmetric areas with respect to the approximate brain symmetry plane. Its result constitutes the initialization of a segmentation method based on a combination of a deformable model and spatial relations, leading to a precise segmentation of the tumors. The results obtained on different types of tumors have been evaluated by comparison with manual segmentations. Keywords: Segmentation, symmetry plane, deformable Models, spatial relations, brain tumors, MRI.
1. Introduction The segmentation of brain tumors in magnetic resonance images (MRI) is a challenging and difficult task because of the variety of their possible shapes, locations, image intensities. The aim of this paper is to contribute to this domain, by proposing an original method, which is automatic and general enough to address the variability issues. Existing methods are classically divided into region based and contour based methods, and are usually dedicated to full enhanced tumors or specific types of tumors. In the first class, Clark et al. [1] have proposed a method for tumor segmentation using knowledge based and fuzzy classification, where a learning process prior to segmenting a set of images is necessary. Other methods are based on statistical pattern recognition techniques such as [2–4]. These methods fail in the case of large deformations in the brain. Existing contour based methods are not fully automatic and need some manual operation for initialization. Lefohn et al. [5] have proposed a semiautomatic method using level sets. Another segmentation method based on level sets was introduced by Ho et al. [6] that uses T1-weighted images both with and without contrast agent for tumor detection. A method by deformable model and neural network was introduced by Zhu and Yang [7] that processes the image slice by slice and is not a real 3D method. In this paper we introduce a fully automatic method for the segmentation of different types of tumors in 3D MRI, based on a combination of region based and contour based methods. In the first step, ∗ Current
described in Section 2, we use the mid-sagittal approximate symmetry plane and detect tumors as an asymmetry with respect to this plane. In the second step, detailed in Section 3, a precise segmentation is obtained using an original combination of deformable models and spatial relations. Results are then presented in Section 4. 2. Tumor detection based on symmetry In this section we detail the first step of the proposed approach, by explaining our method to compute the symmetry plane of the brain and then the method to detect tumors based on this plane. 2.1. Computation of the approximate symmetry plane As proposed in [8], the computation of the approximate symmetry plane is expressed as a registration problem. A degree of similarity between the image and its reflection with respect to a plane is computed. The best plane is then obtained by maximizing this similarity. This optimization is performed using downhill simplex method and is initialized by the plane obtained from principal inertia axes, which proves to be close to the global optimum. Let u be a unit vector in R3 and Πu,d a plane in R3 orthogonal to the vector u and passing at the distance d from the coordinate origin. We denote by eu,d (f ) the reflection of image f with respect to the plane Πu,d : eu,d (f )(x, y, z) = f (eu,d (x, y, z)). An image f is called reflection symmetrical if there exists a reflection plane Πu,d such that eu,d (f ) = f .
address: Olivier Colliot is now with LENA UPR 640 CNRS, Paris, France
2
The idea is to compute a symmetry measure µu,d (f ) of the image f with respect to an arbitrary reflection plane Πu,d , and to find the plane leading to the maximal symmetry degree and the corresponding value of symmetry measure µ(f ): µ(f ) =
max
u∈S 2 , d∈R+
µu,d (f ).
(1)
In this case the symmetry measure µu,d (f ) can be defined as the similarity between images f and eu,d (f ). In this work we use the following symmetry measure: µu,d (f ) = 1 −
||f − eu,d (f )||2 . 2||f ||2
2.2. Tumor detection In our previous work [9] we have used the fuzzy possibilistic C-means (FPCM) classification algorithm for tumor detection and we obtained good results for detecting hyper intensity tumors (full enhanced tumors). However this method is difficult to generalize to any type of tumor while keeping it automatic. Therefore we suggest another approach, using the approximate symmetry plane.
(a)
(b)
(c)
(d)
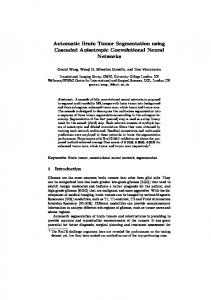
Fig. 1. (a) One axial slice of the original 3D image. (b) Brain mask and symmetry plane. (c) Another example. (d) Brain mask of image (c) with symmetry plane.
Pathological brains are usually not symmetric, thus the symmetry plane is computed on the segmented brain. In the normal brain, it has been observed that the symmetry plane of the grey level
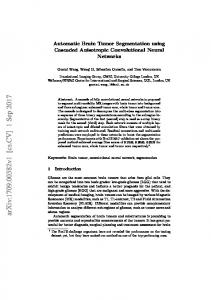
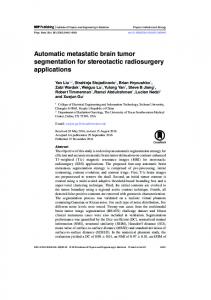
brain image and of the segmented brain are approximately equal. The segmentation of the brain is performed as in [10]. The algorithm summarized in section 2.1 is then applied on the binary image of the brain. Applying this method to images containing tumors provides a good approximation of the midsagittal plane, despite the asymmetry induced by the tumors, thanks to the preliminary segmentation of the brain. This is illustrated in Figure 1. Now tumors can be detected by evaluating this asymmetry with respect to the obtained plane. We assume that tumors are localized in only one hemisphere. This hemisphere is found by comparing the grey level characteristics (mean and standard deviation) of grey matter, white matter and CSF computed in the whole image on the one hand, and in each hemisphere on the other hand. Let Hn denote the histogram of grey levels in the normal hemisphere and Hp the histogram in the pathological hemisphere. The histogram difference Hs = Hp −Hn provides useful information about new intensity classes induced by the tumor. In the case of a tumor without edema (as in Figure 1(c)) a positive peak can be observed in Hs that shows the tumor intensity range (see Figure 2(a)) and we can use a thresholding and morphological operations to extract the tumor (Figure 2(b)). In the case of a tumor with edema (as in Figure 1(a)) we observe two peaks in Hs (Figure 3(a)). Because the intensity of edema is always lower than the intensity of the tumor, the first peak correponds to the edema and the second peak to the tumor. We have considered the peaks with more than 300 voxels, this threshold being based on the analysis of Hs for several normal brains. The negative peaks observed in Hs correspond to normal tissues, around the tumor and the edema, since these tissues are less represented in the hemisphere containing the pathology than in the other hemisphere. These tissues can therefore been obtained automatically (Figures 2(c) and 3(c)). They will be used for introducing spatial relations in the next section.
3
3. Refined segmentation In this section we detail the second step of the proposed approach: the previous detection of the tumor is used to initialize a deformable model. We propose to constrain this model by spatial relations between the tumor and other tissues, as an adaptation of the method described in [11] for normal brains. 3.1. Spatial relations constrained deformable model (a)
(b)
(c)
Fig. 2. (a) Graph of Hs for image (c) of Figure 1. (b) Extracted tumor after morphological operations. (c) Tissues around the tumor.
The evolution of the deformable surface X is described by the following dynamic force equation [12]: γ ∂X ∂t = Fint (X) + Fext (X), where Fint is the internal force that specifies the regularity of the surface and Fext is the external force that drives the surface towards image edges. The chosen internal force is Fint = α∇2 X−β∇2 (∇2 X), where α and β respectively control the surface tension and rigidity, and ∇2 is the Laplacian operator. It is then discretized on the simplex mesh using the finite difference method [12]. In our case, the external force is not only derived from image edges but also constrains the deformable model to satisfy spatial relations to the surrounding tissues. The spatial relations are represented by fuzzy sets in the image space [13], from which a new fuzzy force is derived. The external force is then written as [11]: Fext = λv + µFR where v is a classical external force such as gradient or balloon and FR is the force attached to the spatial relationships. 3.2. Constrained deformable model for tumor segmentation
(a)
(b)
(c)
Fig. 3. (a) Graph of Hs for image (a) of Figure 1. (b) Extracted tumor after morphological operations. (c) Tissues around the tumor.
Spatial relations are useful to guide the recognition of objects in images since they provide an important information about the spatial organization of these objects. Two main classes of spatial relations can be considered: topological relationships, such as inclusion, exclusion and adjacency, and metric relationships such as distances and orientations. Here we use a combination of topological and distance information. The evolution process of the deformable model can be guided by a combination of several relations, via information fusion tools. Here, two types of information are available: the initial detection and the surrounding tissues. Therefore we use (i) the distance from the initial segmented tumor, and (ii) the tissues around the tumor which were obtained in the
4
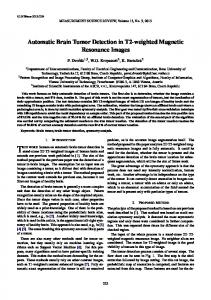
previous step. The idea is that the contour of the tumor should be situated somewhere inbetween the boundary of the initial detection and the boundary of the normal tissues (excluding the background). A fuzzy set representing the relation “near the tumor” is defined as an increasing function of the distance. A distance map in the normal tissues to its complement (tumor and background) is computed, and a fuzzy set is derived again using an increasing function. These two relations are represented as fuzzy sets in the image space. They are illustrated in Figure 4.
(a)
(b)
(c)
Fig. 4. Spatial relations used for segmentation on two examples. (a) Near the tumor. (b) Relation provided by the normal tissues. (c) Fusion of the two relations.
These relations are combined using a conjunctive fusion operator (a t-norm), leading to a fuzzy set µR . The resulting fuzzy set provides high values in the region where both relations are satisfied, and lower elsewhere. The fuzzy force is derived from this fusion as [11]: FR (x) = −(1 − µR (x))
∇d(x) k∇d(x)k
where d is a distance map to the kernel of µR (i.e. points x for which µR (x) = 1). The classical external force is calculated by Generalized Gradient Vector Flow [12] based on an edge map obtained from Canny-Deriche edge detection. 4. Results and conclusion We have applied the method to 10 different real 3D T1-weighted MRI (of size 256 × 256 × 124). These
images contain tumors with different sizes, intensities, shapes and locations. This allows us to illustrate the large field of application of our method. The evaluation of the segmentation results was performed through a quantitative comparison with the results of a manual segmentation. Let us denote by A the manually segmented tumor and B the tumor segmented by our method. We used three measures to evaluate the results, as proposed in [14] which are: • overlap: |A∩B| |A∪B| ; • Hausdorff distance between A and B, defined as max(h(A, B), h(B, A)) where h(A, B) = maxa∈A minb∈B d(a, b), and d(a, b) denotes the Euclidean distance between a and b (a and b are points of A and B respectively); • the signed distances from the surface of B to the surface of A are computed, and the absolute average value of distances is derived. The segmentation results for the two cases of Figure 1 are shown in Figure 5. In the first case, the initial detection based on symmetry analysis only provides a part of the tumor. The whole tumor is successfully recovered by the second segmentation step using the deformable model and the spatial relations. Even in the second case, where the initial detection is already quite good, the second step provides a more precise boundary of the lesion. The quantitative results obtained by comparing the automatic segmentations with the available manual segmentations are provided in Table 1 for 10 cases. For the overlap, all values are greater than 85% (note that values above 70% are generally considered as good results), and most of them are greater than 91%. The distance-based evaluations should be compared to the voxel size, which is typically 1 × 1 × 1.3 mm3 for all images. The Hausdorff distance in these 10 cases is always less than five voxels, and often even smaller. It should be noted that this measure is particularly severe since it is a maximum distance and provides the error for the worst point in the segmentation. The average distance is less than one voxel, which means that in average the automatic contour is very close to the manual one (less than one voxel distance). Due to the partial volume effect, the obtention of more precise results would require to work at sub-voxel level.
5
All these results show the high accuracy of the proposed method, which was also confirmed by a visual evaluation performed by medical experts.
case of a symmetrical tumor across the mid-sagittal plane, but this case is very rare. Future works aims at combining several modalities such as T2-weighted and FLAIR to develop the segmentation of edema and infiltration around the tumors. Acknowledgments Hassan Khotanlou is supported by Bu Ali Sina University, and Olivier Colliot by a grant from Paristech - Ile de France. References
(a)
(b)
(c)
Fig. 5. Final segmentation results on two different cases. (a) Initial detection superimposed on an axial slice. (b) Final segmentation. (c) Result superimposed on a sagittal slice.
Table 1. Evaluation of the segmentation results of tumors on a few 3D MR images for which a manual segmentation was available. Dataset
Overlap (%)
Hausdorff (mm)
Average (mm)
Tumor Tumor Tumor Tumor Tumor Tumor Tumor Tumor Tumor Tumor
95.56 91.32 96.12 88.24 90.08 91.21 95.05 85.86 88.63 91.63
2.66 5.20 1.32 1.51 3.14 2.40 4.02 3.62 4.91 3.83
0.62 1.41 0.41 1.21 1.15 1.01 1.29 1.31 0.92 0.84
1 2 3 4 5 6 7 8 9 10
As a conclusion, the proposed hybrid algorithm using region based and contour based methods proves to be efficient to segment brain tumors in 3D MR images. Its application to several datasets with different tumor sizes, intensities and locations shows that it can automatically detect and segment very different types of brain tumors with a good quality. Our method can be applied as well to T2-weighted images or FLAIR images. However it may fail in the
1. M. Clark, L. Lawrence, D. Golgof, R. Velthuizen, F. Murtagh and M. Silbiger, IEEE Transactions on Medical Imaging 17(April 1998). 2. M. Kaus, S. Warfield, A. Nabavi, E. Chatzidakis, P. Black, F. Jolesz and R. Kikinis, Segmentation of meningiomas and low grade gliomas in MRI, in MICCAI , (Cambridge UK, 1999). 3. N. Moon, E. Bullitt, K. Leemput and G. Gerig, Model-based brain and tumor segmentation, in ICPR, (Quebec, 2002). 4. M. Prastawa, E. Bullitt, S. Ho and G. Gerig, Medical Image Analysis 18, 217 (2004). 5. A. Lefohn, J. Cates and R. Whitaker, Interactive, GPU-Based Level Sets for 3D Brain Tumor Segmentation, tech. rep., University of Utah (April 2003). 6. S. Ho, E. Bullitt and G. Gerig, Level set evolution with region competition: Automatic 3D segmentation of brain tumors, in ICPR, (Quebec, 2002). 7. Y. Zhu and H. Yang, IEEE Transactions on Medical Imaging 16, 55 (1997). 8. A. Tuzikov, O. Colliot and I. Bloch, Pattern Recognition Letters 24, 2219(oct 2003). 9. H. Khotanlou, J. Atif, O. Colliot and I. Bloch, 3D Brain Tumor Segmentation Using Fuzzy Classification and Deformable Models, in WILF , (Crema, Italy, 2005). 10. J.-F. Mangin, O. Coulon and V. Frouin, Robust brain segmentation using histogram scale-space analysis and mathematical morphology, in MICCAI , (Cambridge USA, 1998). 11. O. Colliot, O. Camara and I. Bloch, Pattern Recognition 39, 1401 (2006). 12. C. Xu and J. Prince, IEEE Transactions on Image Processing 7, 359 (1998). 13. I. Bloch, Image and Vision Computing 23, 89 (2005). 14. G. Gerig, M. Jomier and M. Chakos, Valmet: a new validation tool for assessing and improving 3d object segmentation, in MICCAI , (Utrecht, Netherlands, 2001).