Automatic classification and taxonomy generation for semi-structured data Bernardo Pereira Nunes
Giseli Rabello Lopes
Marco Antonio Casanova
Federal University of Rio de Janeiro Department of Informatics - PUC-Rio Department of Informatics - PUC-Rio Rio de Janeiro, RJ, Brazil Department of Applied Informatics - UNIRIO UFRJ - Rio de Janeiro, RJ, Brazil Email:
[email protected] Email:
[email protected] Rio de Janeiro, RJ, Brazil Email:
[email protected]
Abstract—The problem of data classification goes back to the definition of taxonomies covering knowledge areas. With the advent of the Web, the amount of data available increased several orders of magnitude, making manual data classification impossible. This work presents an approach based on the prototype theory to automatically classify semi-structured data, represented by frames, without any previous knowledge about structured classes. Our approach uses a variation of the K-Means algorithm that organizes a set of frames into classes, structured as a strict hierarchy.
I. Context The challenge of organizing knowledge areas dates back to the creation of taxonomies. To address this challenge, scholars built unique systems of classification covering all areas of knowledge, in an attempt to enable a general organization for data. In 1876, the American librarian Melvil Dewey published the Decimal Classification (DDC) system1 , which has been modified and expanded since its conception. By the year 2007 there were 22 major revisions. Today, the DDC is the most used bibliographic classification system in the world. This classification system is divided into ten main classes, which together attempt to cover all areas of existing knowledge. The advantage of this classification system lies on its simplicity. A simple notation is fundamental to its diffusion. Another advantage is its infinite vertical expansion, i.e., when new subdivisions are introduced there is no change in the allocation of their classification numbers. The disadvantage of this system is its limited adaptability, which at higher levels of abstraction has already defined categories. Another disadvantage is that the classification is solely established on Dewey’s proposal, i.e., based on his own knowledge and experience [1]. Another well know classification is the Universal Decimal Classification (UDC) based on the DDC and was first published in France between the years 1904 and 1907. As DDC, the UDC has been developed and reviewed, becoming a flexible and effective system for organizing bibliographic files for all types of information and media. The difference 1 A real example of this system is the Dewey Browse (http://www. deweybrowse.org/), which was created by Gail Shea Grainger and demonstrates how the use of this method would organize data on the Web.
between the DDC and the UDC is in the way that subjects of a particular work may be correlated. The UDC has a table of symbols such as the plus sign, semicolon, dash, and others that can be divided into two groups: dependent (point of view, the general characteristics of people and materials) and independent (auxiliary common language, form, place, races, time). Being similar to the DDC, the UDC has much the same pros and cons on its system. Nevertheless, UDC is language agnostic while DDC is based in American culture, which facilitates the exchange of information and research worldwide. The Library of Congress Classification (LCC) is the most used classification in academic and research libraries in the United States. Developed by Herbert Putnam with the advice of Charles Ammi Cutter in 1987, this classification does not describe the areas as a whole, but subjects of books in a library. An important feature of LCC is its notation, defined as a set of symbols that represent the names of a class or any division or subdivision of a class that forms a logic for classification. The notation is mixed, consisting of capital letters and Arabic numerals. The system divides all knowledge into 21 major classes, each of which is identified by an alphabet letter. Most of these classes are subdivided into subclasses identified by two or sometimes three letters. Individual topics are broken in places, periods, periodicals, biographies etc., and for each of these topics, a number between one and four digits is assigned. Unlike the classification of DDC, LCC is not hierarchical, i.e., a concept is not developed from the most general to the most specific, its only notation follows a conventional sequence [1] between topics of a particular subject. The disadvantage of this system is the use of a controlled language that, being arbitrary, it may seem unnatural. Moreover, it was originally conceived to serve only one library, the LCC. Dissatisfied with the previous classification systems the Indian mathematician and librarian Shiyali Ramamrita Ranganathan developed the theory of faceted classification in 1933. Basically, Ranganathan decided to create its own classification system to improve the representation of complex subjects - the colon classification system. His system, also known as analytic-synthetic, decomposes the subjects/themes in their basic concepts (analysis) and combine them to describe a subject/topic (synthesis). Likewise the already mentioned
classifications, it has classes with predetermined subjects that can be combined between them with markers such as the colon. Briefly, Ranganathan identified five main classes, also known as fundamental categories, represented by the mnemonic PMEST, whose facets fit. The category Personality is considered the main facet that distinguishes the subject. Matter category is intended to identify the physical material of which an object can be composed. The category Energy is responsible for identifying the activity or process that occurs with the subject. Space identifies the category where it happens or exists and Time identifies the geographic location and when the subject occurs and time period associated with the subject. A faceted classification comprises principles and techniques for classification systems and information retrieval. A faceted system recognizes many aspects in a single subject and tries to synthesize them more adequately. Ranganathan showed that the relationship between subjects, made by the symbol of the colon, can be infinite, proving that knowledge can be multidimensional and that these relationships can take different paths, depending on the synthesis of various multiple concepts. Additionally, Ranganathan produced other important works on the theory of classification, such as: Elements of Library Classifications [2] and Prolegomena to Library Classification [3]. The development of facets is made from the inspection of the subject with the purpose of identifying concepts and terms that can be partitioned into facets. Furthermore, each facet can be subdivided into subfacets. The great advantages of faceted classification are the various possibilities for browsing and searching the same information, giving the user a variety of search strategies and conceptual models. At the same time, it also allows us to identify each of the senses referred to a subject. Unlike other classifications listed above, that are enumerative, the faceted classification is analytical-synthetic, or has a multidimensional structure and flexible adaptability. Observing these classification, it becomes evident the need for an adaptable and easily expandable taxonomy as quoted in DDC. Also, it should be international in order to be globally used and not regional as seen in the UDC. Moreover, an uncontrolled vocabulary would avoid the need of experts in each field of knowledge. Furthermore, there is a need to create taxonomies that may cluster complex issues (multidimensional) as approached by Ranganathan when describing the PMEST factors. Recently the problem became even worse with the emergence of the Web, the data volume increased in several orders of magnitude, making it virtually impossible to manually organize it. Thus, an automatic way to organize and classify this information became imperative. This work consists on an unsupervised learning technique to automatically classify semi-structured data. The process consists of the following key steps: determine the number of clusters in a data set; find the basic-level category; and refine the class hierarchy. Furthermore, we propose three different techniques - hybrid, abstract and medoid - that can be applied to obtain a better understanding of the data set. Finally, in response to the need to sort large quantities of information,
we present in this paper a novel approach to organize semistructured data, represented by frames, without a predefined structure of classes. This paper is organized as follows: Section II covers basic definitions, the notions of frames and the prototype theory in which our approach is based. Section III introduces our proposed method followed by a practical example. Section IV presents the evaluation and results whereas Section V reviews closely related literature. Finally, Section VI presents the discussion and outlook. II. Basic Definitions Categorization is the process of grouping ideas or objects using some purpose or relationship between them. According to Rosch et al. [4], people categorize ‘things’ in terms of prototypes. The prototype theory was initially known as the concept of basic-level categorization. However, finding the basic-level categorization depends on the approached concept. For example, the basic-level of concepts such as ‘furniture’ or ‘animal’ could be ‘chair’ and ‘robin’, respectively. Thus, for each concept approached, the basic-level found can be more specific or general. Lakoff and Jonhson [5] approached this question not just by the objectivist view, i.e., not just by taking into account the inherent properties of objects. Instead, they included interactional properties, such as perceptual properties, motoractivity properties, purposive properties, functional properties and so on. Thus, in addition to the prototype theory, nonprototypical objects must be categorized by their relationships with the prototypes or by their similarity with the prototypes. The prototype theory is defined as the most central object in their category. Each category is structured as a “radial structure”, i.e., some objects are more representative (closer to the prototypical object) in a category than others (more distant from the prototypical object). In this paper, our strategy adopts the prototype theory to automatically classify semi-structured data using frames. A notion of frames was introduced by Minsky [6], where he defines a frame as a data structure to represent a concept or a stereotyped situation such as “being in a certain kind of living room” or “going to a child’s party”. Barbosa et al. [7] presents a very intuitive definition of frames in the context of the ER Model. Briefly, each slot is an expression of the form ‘P:V’ or of the form ‘P:’, where P and V, called the slot name and the slot value, satisfy one of the following conditions: • P is an attribute of the entity being described, and V, if defined, is a single value (the attribute is single-valued, by assumption), or • P is of the form R/1, where R is a binary relationship in which the entity is the first participant, and V, if defined, is a single value or a set of values (the relationship is non-total and multi-valued, by assumption), or • P is of the form R/2, where R is a binary relationship in which the entity is the second participant, and V, if defined, is a single value or a set of values (the relationship is non-total and multi-valued, by assumption). A frame is
! ...!
Preprocessing"
(0)$ ! ! ...! !
(1)$
Basic"level" C" F"
(2)$
Specializa6on" F"
E" A"
C"
(3)$
Generaliza6on"
Ab_1"
Ab_2" C"
E A
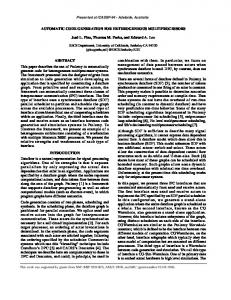
Fig. 1. Classification method macro-steps.
Fig. 2. Frame input structure.
a set of slots with distinct names. The top frame is the empty set. An instance frame is a frame whose slots are all of the form ‘P:V’, and a class frame is a frame with at least one slot of the form ‘P:’. III. Classification method The great advantage of automatic data classification using unsupervised algorithms to find a taxonomy is that no prior knowledge of data is required. We identified the following macro-steps to the process of automatic classification (see Figure 1): (1) Determining the number of clusters and find the initial set of frames; (2) Clusters specialization found throughout the process; (3) Clusters generalization. Optionally, a preprocessing step (0) could be necessary to transform a semi-structured data in the form of frames. A. Step 0 - Preprocessing step Frames are composed of attributes (slots) and values associated with them. Thus, the slot is characterized by an expression of the form “P: V” or “P”, where P and V are named as attribute and value, respectively. Respecting the definition of frames, we created a standard markup language using XML (eXtensible Markup Language) to compose the input of the proposed approach, see Figure 2. The description of the markers are defined in what follows: - Marking the list of frames to be provided to the system.
- Marker that contains information about the frame. Nestled in the frame marker, there is the marker describing the attributes belonging to the frame. The marker may have associated values that are described by the marker . The marker has properties that describe the object frame as: • id - the object identifier; • name - the object name. In addition to these properties, this marker may contain additional properties that may be used for data analysis, for example: • class - previous class identifier that an object belonged to; • className - previous class name that an object belonged to. As mentioned, represents the attributes that a frame can contain. The properties that describe it are: • attributeName - the attribute name; • attributeType - datatype attribute (e.g. string, boolean). Finally, the marker is responsible for the description of the values associated with the attribute to which it belongs. B. Step 1 - Basic level 1) Determining the number of clusters: Determining the number of clusters is one of the most important steps in the process of automatic grouping because it determines the number of groups that a given dataset has. Usually, clustering techniques use pre-established groups or supervised methods requiring prior knowledge of the existing groups in the data. An analysis performed by [8] shows that most of these techniques do not work as they should in practice. The methods of Cross Validation and Penalized likelihood estimation are computationally expensive, and usually need to be performed several times in order to have a reasonable estimate. Permutation and Resampling tests methods are impractical because they must run the clustering algorithms hundreds or thousands of times. Finally, methods based on Finding the knee of error curve usually take more time to evaluate the clusters than the actual algorithm that generated it. One method suggested by Kaufman and Rousseeuw [9] is the silhouettes method used to determine whether an object belongs to a group and also to evaluate the quality of the cluster obtained. The silhouette of a given object is obtained through the following formula: s(i) =
b(i) − a(i) max({a(i), b(i)})
(1)
where a(i) represents the average distance between the object i and the other objects in the cluster Ci ; For any cluster C,Ci , d(i, C) is the average distance of i to the objects of C. After computed all d(i, C) for all clusters C,Ci , b(i) corresponds to the lowest average between them.
running the K-Means algorithm, thus satisfying part of the theory. However, it is still necessary to choose an element that represents a group of objects. For this reason we use a variation of this algorithm known as K-Medoid, because instead of determining the centroid through its geometric position, it elects one of its group members as a representative. At the end of the run we obtain k representatives and the objects divided into k classes. To obtain a complete taxonomy, still need to take steps to generalize and specialize classes obtained in the first step. Fig. 3. Radial clustering.
C. Step 2 - Specialization Therefore, s(i) is the measure of how well an object is located in relation to the neighboring cluster. If s(i) is equal to 1, we have an object perfectly classified. If s(i) is 0, we have a situation where there is uncertainty in the allocation of the object in the current cluster or some other neighbor cluster. If s(i) is equal to −1, it is likely that the object has been wrongly classified. Having all values of s(i) of a given cluster, its average is known as the average width of the silhouette of this cluster. Thus, the average of all widths of k clusters is known as s(k), where k is the number of clusters and s(k) is the average quality of the grouping carried on a given data sample. Thus, the appropriate k is the one that achieves the maximum average in the tests. Through this method is not possible to identify the silhouette for the case of k equal to 1, since this uses inter-cluster measures for their determination. Thus, it is still necessary to check if a particular group of objects do not have to be partitioned into two or more groups, i.e., k is equal to 1. Aiming to solve this shortcoming, we added two heuristics to determine whether or not to split the objects of a group. The first heuristic checks if the level of cohesion and isolation (calibrated by the user) intra-cluster and inter-clusters are satisfactory for k equals to two. If this is true, then the cluster is partitioned into two groups otherwise this group will not suffer more partitioning. The second heuristic tests whether the average quality of the group for k objects is greater than the average set by the user or for the standard s(k) previously set to 0. If the value of s(k) is greater than the stipulated, then the k number of clusters is returned, otherwise returns k equals to 1. 2) Cluster Representation: Although there are various algorithms used for the task of grouping data, we rely on theory to elect a prototype algorithm that best represents this theory and, consequently, people’s vision on objects (things, animals, people, objects and other materials). Our theory is described as a radial structure, where members closer to the center are more representative and less representative farthest. The first task is to find representatives from each group of elements from the data sample to be grouped. To follow the radial theory, we need an algorithm that maintains its form and therefore the K-Means algorithm was the chosen one (see Figure 3). The + sign in Figure 3 represents the centroid found after
As the name implies, the goal of this step is to specialize concepts within a data sample, for instance, given a sample of objects, the algorithm finds specialized subsets of objects. The algorithm is executed again for each subgroup of data until the stopping criterion is reached. The stopping criterion relies on the algorithm responsible for determining the number of clusters (see Section III-B1), if this algorithm returns k equals to 1, then the specialization algorithm stops running. D. Step 3 - Generalization On the other hand, unlike the specialization algorithm, in the generalization of groups of objects, given two sets of objects, the goal is to create a new object from a composition of the existing ones or to elect an object belonging to one of the groups that better represents them. For this, we describe three possible strategies to follow: Medoid, Abstract and Hybrid. Briefly, the Medoid strategy selects an object that best represents a particular group, creating a taxonomy of prototypical objects. Unlike the Medoid strategy, the Abstract strategy does not use an existing object as a medoid, but creates an abstract representation of the objects within a group to represent it (more details in Section III-E). Finally, the Hybrid strategy combines both strategies to generate the final taxonomy. From the basic-level up (see basic definitions in Section II), it uses the Abstract strategy and from the basic-level down it uses the Medoid strategy. E. Practical Example The classification process we propose is based on the notions of radial structure and the prototype object, represented by the most central object in its cluster. The process is based on a variation of the K-Means algorithm [10], called KMedoid [11], which maintains the radial structure. In the KMedoid algorithm, the medoid is defined as the most central element in its cluster, and the average dissimilarity to all objects in a cluster is minimal. Thus, we may consider the medoid of a cluster as the most representative object of the cluster or the prototype object. The closeness criterion used takes into account just the slot names, or slot names and slot values. To illustrate our process, we describe an example of classification using the Abstract technique. Suppose that we start with a set of frames of three different classes (unknown to the algorithm), represented by the following class frames [7]:
Person [name:, age:], Employee [name:, age:, works:, area:, salary:], and Student [name:, age:, level:, area:, fee:]. The first step is to determine the number of clusters. We then run the K-Medoid algorithm, varying k, and validating each cluster through the global silhouette width [12]. The silhouette method is based on the index s(i), defined in Equation 1, where a(i) is the average distance between object i and the objects in its cluster A, and b(i) is the average distance between object i and the objects in its ‘second closest’ cluster B. Intuitively, s(i) represents how well matched is the object i in the cluster A. The average s(i) of a cluster is a measure of how tightly grouped all data in the cluster are. Thus, the average s(i), called the global silhouette width, of the entire data set is a measure of how appropriately the data has been clustered and then k is found and used to cluster this data set. It is important to say that this step will always be executed each time a cluster needs to be split. The first run of the K-Medoid is considered equivalent to the basic-level category. In the example showed in the Figure 4 (step 1), the result of the basic-level is represented by the following three (k=3) class frames: Person C, Employee F and Student F. Once the basic-level is found, the process continues and the specialization step, Figure 4 (step 2), is executed. This step works as follows: for each cluster found on the basic-level, the K-Medoid runs recursively (each cluster is split) until a stop criterion is reached. The stop criterion is a measure of the quality of the generated clusters. In our example, for each of the clusters Person C, Employee F and Student F, the algorithm determined the ideal number of clusters. Hence, we discovered that the clusters Employee F could be split into two and Student F into three more clusters. The process of specialization continues for each new cluster (Employee E, Employee A, Student A, Student F, Student M), until no more specializations become necessary, and the process stops. In the example, each cluster was split based on attribute values, i.e., cluster Employee E has an attribute ‘area’ whose value is ‘engineering’, whereas the value for the Employee A is ‘law’. The next step is the generalization of concepts, Figure 4 (step 3). The algorithm works in two steps. The first step is to generalize the concepts above the basic-level, i.e., as showed in the Figure 4 (step 2), the algorithm merges the two closest objects and creates a new frame object, called ‘Abstract’. This is repeated until no frames are close enough to be merged, or there is just one frame on the top. Given two frames, F and G, we define their merge [7], denoted F4G, as the frame M such that a slot s ∈ M iff s∈F and there is g∈G such that g subsumes s, or s∈G and there is f ∈F such that f subsumes s. Briefly, the algorithm first merges the closest frames (Employee F and Student F) into the frame Abstract 2. Then, the frame Person C is merged with the Abstract 2, creating the frame Abstract 1. The process continues and generalizes all concepts found under the basic-level. The process is almost the same, but in this case, we use the frames of the
medoids to create the new representative frame, and the current medoid is reallocated with the others frames on the bottom of the hierarchy. For example, frame Abstract 3 was created from the merging Employee E and Employee A, the medoid Employee F was replaced by the frame Abstract 3, and reallocated under the clusters Employee E or Employee A. Likewise, Abstract 4 resulted from the merge of frames Student A, Student F and Student M. The final classification is shown in Figure 4 (step 3), and their categories are defined as Abstract 1 [name:, age:], Abstract 2 [name:, age:, area:], Abstract 3 [name:, age:, works:, area:, salary:] and Abstract 4 [name:, age:, level:, area:, fee:]. In this case, we do not have a class frame with a value determining a type of a class but, as we can see, the leaves are represented by frames from the data set and they are also divided in clusters but are not abstract frames. This happens because under them there are all the classified objects and no medoid is found. IV. Experimental Evaluation A. Experimental setup The dataset used to evaluate the proposed approach comes from a catalog of products and services of an Emergency Support System (ESS) of a Brazilian oil company. At the time of the evaluation, the dataset contained 21,000 data frames classified into 324 originally defined classes. The proposed approach used only the data frames to perform the automatic classification process whereas the classes were used to validate the process. Besides using the classes to validate the process, we also used as an evaluation indicator the matching level of the frames/objects belonging to a determined class. The matching level is obtained by comparing the original classification given to a medoid and the objects contained in this cluster. For instance, given a medoid with the following class: vehicles → terrestrial → car and an element that belongs to that group classified as vehicles → terrestrial → car then the matching is perfect in relation to the medoid, what may indicate that this element is correctly classified. Now, suppose that another element of the same class has the following classification: vehicles → terrestrial → car → Fiat, then we will still have a cohesive classification, because we are analysing the group as a whole and, in this case, the object belongs to the same class although in a more specific level. Thus, we expect that the algorithm allocate these objects in a subclass that best represents it. Another example would be if a medoid is classified as vehicles → terrestrial → car → Fiat and the object vehicles → terrestrial → car, so in this case, the matching level would be 0.75 out of 1, meaning that 3 out of 4 classes matched. A sample of 2,100 data frames equivalent to 10% of the dataset were used to automatically generate the taxonomy for ESS. The method used to generate the taxonomy was based on the Medoid strategy and we took into account the similarity measure using both attributes and values.
Person_C*
Employee_F*
Employee_F*
Person_C*
Student_F*
Student_F*
Employee_E* Abstract_3*
Employee_A*
Abstract_2*
Student_A* Abstract_1*
Student_F* Student_M*
Step%1%'%Basic%Level%
Step%2%'%Specializa2on%
Employee_E* Employee_A*
Student_A* Abstract_4*
Person_C*
Student_F* Student_M*
Step%3%'%Generaliza2on%/%Final%Result%
Fig. 4. Classification steps of the Abstract technique. TABLE I Basic-level clustering of the catalog of products and services of the ESS system. Medoid
# of objects in a cluster 462
(a) police station of Candeias city (b) Analyst Sr. Rr. Hh. Planta Pgsm (c) Iraci Antonio Davi (d) Lona Leve (e) UN-BS/ATP-N/RES (f) industrial hygiene equipment - explosimeters (id:4358)
292 285 58 326 677
Medoid original class object → resource → external entity → government agencies → public security agencies → civil police object → position object → external contact object → manufacturers object → unit object → resource → material resource → industrial hygiene equipment → explosimeters
Matching level 58,9% 100% 100% 100% 100% 58%
TABLE II Specialization of the class represented by the medoid (f). Medoid
# of objects in a cluster 654
(f.a) nil (f.b) temporary storage system - floating roof tank (id:5360)
22
Medoid original class object → resource → material resource → individual protection equipment → life jacket object → resource → material resource → temporary storage system → floating roof tank
Matching level 57% 83%
TABLE III Specialization of the class represented by the medoid (f.a). Medoid (f.a.a) containment booms - calm waters - skirt up to 30cm (id:3516) (f.a.b) various equipments - other (id:4387) (f.a.c) emergency medicine resources - ambulance (id:8146)
# of objects in a cluster 169 264 220
B. Results The first analysis focused in the basic-level generated by the algorithm. Table I shows the medoids that represent the clusters found. In total, six clusters were found, and only the cluster identified by the letter (f) was partitioned into 2 other subclusters and one of the clusters were again partitioned but now into 3 new groups. As we can notice, the cluster that was partitioned was the one that obtained the lowest matching level. This split happens because the cohesion is low, so the algorithm creates new clusters in order to split the objects in classes that they would best fit and increase cohesion (see Table II and III). After a manual inspection of the results (shown in Tables I, II and III), we identified that the lowest matching levels
Medoid original class object → resource → material resource → containment booms → calm waters - skirt up to 30cm object → resource → material resource → various equipments → other object → resource → material resource → emergency medicine resources → ambulance
Matching level 51% 64% 62%
achieved by the clusters (a) and (f) and its subclusters are due to poor modeling of ESS classes. So, although we believed that we could reproduce the original classification manually generated in ESS, we have came across that many of the objects had properties inherited but not used (in blank) and only a few had new attributes actually used to describe the objects. This means that the objects may belong to different classes, and yet share the same attributes. Thus, the classification of object → resource → ... given by groups (a) and (f) could not be clearly defined, although we managed to extract some important information such as the intentional or unintentional modeling of ESS classes. The classification obtained in Figure 5 (right) is the result of the taxonomy generated taking into account the data frames in ESS. The classes with a red cross next to it (classification
on the right) could not be reproduced, for instance, object and resource. Again, this happens because the objects within these clusters share the same attributes and therefore there is no need to create different classes to accommodate them. Thus, we find that all derived classes of the external entity class should be kept in one group, undivided, and the object and resource classes can be removed as it does not add any new information to the classification. In addition, we noticed a change in the classification of the material resource class. The material resource class was partitioned into two groups, temporary storage system and [] (the brackets stand for a newly created subgroup), which in turn were partitioned into 4 other groups and subgroups. Another change can be seen in the human resource class that originally was in the second level and in the new proposed hierarchy moved to the fifth level. As a result the proposed classification is a reductionist model, i.e., able to detect design failures of classification models. V. Related Work Taxonomies can be seen as classifications of items. A classification contains classes partially ordered of similar items related under special domain aspects. The partial ordering usually captures the generality or inclusion relation between classes according to the hierarchical levels [13]. Taxonomies aim at helping to organize data and focus on enabling the efficient retrieval, navigation and sharing of knowledge [14]. Thus, taxonomies have been used on knowledge’s based systems mainly for facilitating the knowledge organization, exploration and discovery. The manual creation of taxonomies is a difficult, expensive and time-consuming task. Moreover, developing taxonomies to fully describe different domains and, at the same time, consider all perspectives is impractical. To address this problem, automatic methods to learn taxonomies have been proposed. Many efforts have been employed in learning taxonomies from textual data. Velardi et al. [15] presents a taxonomy learning methodology, named OntoLearn Reloaded, that learns both concepts and relations entirely from scratch via the automated extraction of terms, definitions and hypernyms. Wang et al. [16] presents an approach to automatically learn terminological ontologies from unstructured text corpus combining probabilistic topic models and topic extraction techniques. Some approaches use external knowledge sources as basis for creating the taxonomies. In this sense, Stoica and Hearst [17] proposes a hierarchical faceted metadata system to create a set of category hierarchies using WordNet lexical database. Suchanek et al. [18] proposed the Yago, a lightweight and extensible ontology automatically extracted from Wikipedia and unified with WordNet through a combination of rule-based and heuristic methods. Medelyan et al. [19] proposes a framework for creating taxonomies from document collections combining different knowledge sources such as Wikipedia, DBpedia and Freebase. Zirn et al. [20] presents an automatic method for distinguishing between instances and
classes in a taxonomy induced from the Wikipedia category network. Other approaches consider the hypernym relations to learn taxonomies. Kozareva and Hovy [21] propose a method to learn taxonomies considering the hyponym-hypernym relations between pairs of concepts extracted from the Web. Moreover, Navigli et al. [22] proposes an algorithm to induce lexical taxonomies from scratch via the automated extraction of terms, definitions and hypernyms. VI. Discussion and Outlook In response to the need to sort large quantities of information, in this work we introduced an approach for organizing semi-structured data, represented by frames, without a prior structure of classes. The data clustering is a technique widely applied in various fields such as biology, statistics, psychology, engineering, medicine, marketing (market analysis), archival science, computer science, business, and many others. However, finding the best solution to this problem is not straightforward. The use of supervised algorithms conveniently has sampled data for training. However, in certain cases, we need techniques of automatic classification, since the act of classifying data for training can be an arduous or even impossible task. Accordingly, unsupervised clustering algorithms play a fundamental role in the classification of similar data. The proposed classification process in this paper can be successfully applied in real data. The knowledge generated from this study represents a starting point for contributions through the implementation of other clustering algorithms supervised and unsupervised, validation of classifications performed manually and the comparison of this method of classification with other existing ones. Acknowledgment This work has been partially supported by CNPq under grant 444976/2014-0. References [1] E. S. Y. Lo, “Library of Congress Classification and Dewey Decimal Classification : a comparison,” United College Journal, vol. 8, pp. 125–131, 1970. [Online]. Available: http://sunzi1.lib.hku.hk/hkjo/view/ 6/600146.pdf [2] S. R. Ranganathan, Elements of Library Classification. Asia Pub. House, 1962, vol. 8. [3] Ranganathan. (1967, Jan.) Prolegomena to Library Classification. [Online]. Available: http://dlist.sir.arizona.edu/1151/ [4] E. Rosch, C. B. Mervis, W. D. Gray, D. M, and P. Boyes-braem, “Basic objects in natural categories,” Cognitive Psychology, 1976. [5] G. Lakoff and M. Johnson, Metaphors We Live By, 2nd ed. University Of Chicago Press, Apr. 2003. [Online]. Available: http://www.amazon.com/exec/obidos/redirect?tag=citeulike07-20\ &path=ASIN/0226468011 [6] M. Minsky, “A framework for representing knowledge,” Cambridge, MA, USA, Tech. Rep., 1974. [7] S. D. J. Barbosa, K. K. Breitman, A. L. Furtado, M. A. Casanova, X. Simpsio, and B. B. Dados, “Similarity and analogy over application domains,” 2007. [8] S. Salvador and P. Chan, “Determining the number of clusters/segments in hierarchical clustering/segmentation algorithms,” in Tools with Artificial Intelligence, 2004. ICTAI 2004. 16th IEEE International Conference on, Nov., pp. 576–584.
object − position − external contact − manufacturers − unit − resource −− human resource −− external entity − − − press − − − government agencies − − −− public administration agencies − − − − − state government − − − − − federal government − − − − − municipal (local) government − − −− environmental agencies − − −− public security agencies − − − non-governmental agencies − − − specialized services − − −− environment − − −− health − − −− security − − −− technical and scientific − − − general services −− material resource − − − individual protection equipment − − − pumping system − − − gathering system − − − boom accessories − − − hand tools − − − containment boom − − − temporary storage system − − − emergency medicine resources − − − hygiene equipment − − − chemical dispersants − − − fixed fire fighting equipment
object X − position − external contact − manufacturers − unit − resource X −− external entity − − − press X − − − government agencies X − − −− public administration agencies X − − − − − state government X − − − − − federal government X − − − − − municipal (local) government X − − −− environmental agencies X − − −− public security agencies X − − − non-governmental agencies X − − − specialized services X − − −− environment X − − −− health X − − −− security X − − −− technical and scientific X − − − general services X −− material resource − − − temporary storage system − − − [] − − −− [] − − − − − individual protection equipment − − − − − emergency medicine resources − − − − − hand tools − − − − − human resource − − −− gathering system − − −− fixed fire fighting equipment − − −− [] − − − − − pumping system − − − − − boom accessories − − − − − containment boom − − − − − hygiene equipment − − − − − chemical dispersants
Fig. 5. Original ESS classification (left) and the automatically generated classification (right).
[9] L. Kaufman and P. J. Rousseeuw, Finding Groups in Data: An Introduction to Cluster Analysis (Wiley Series in Probability and Statistics). Wiley-Interscience, Mar. 2005. [Online]. Available: http://www.amazon.com/exec/obidos/redirect?tag= citeulike07-20\&path=ASIN/0471735787 [10] J. MacQueen, “Some methods for classification and analysis of multivariate observations,” in Proc. Fifth Berkeley Symp. on Math. Statist. and Prob., vol. 1. Univ. of Calif. Press, 1967, pp. 281–297. [11] J. Han, Data Mining: Concepts and Techniques. San Francisco, CA, USA: Morgan Kaufmann Publishers Inc., 2005. [12] P. Rousseeuw, “Silhouettes: A graphical aid to the interpretation and validation of cluster analysis,” Journal of Computational and Applied Mathematics, vol. 20, no. 1, pp. 53–65, Nov. 1987. [Online]. Available: http://svn.donarmstrong.com/don/trunk/projects/research/papers to read/statistics/silhouettes a graphical aid to the interpretation and validation of cluster analysis rousseeuw j comp app math 20 53 1987.pdf [13] W. Kl¨osgen, “Taxonomies,” german National Research Center for Information Technology (GMD), http://citeseerx.ist.psu.edu/viewdoc/ download?doi=10.1.1.39.5880&rep=rep1&type=pdf, accessed on June 2015. [14] A. Pellini and H. Jones, “Knowledge taxonomies: A literature review,” ODI Research Reports and Studies, May 2011. [15] P. Velardi, S. Faralli, and R. Navigli, “Ontolearn reloaded: A graphbased algorithm for taxonomy induction,” Computational Linguistics, vol. 39, no. 3, pp. 665–707, 2013. [Online]. Available: http: //dx.doi.org/10.1162/COLI a 00146 [16] W. Wang, P. Mamaani Barnaghi, and A. Bargiela, “Probabilistic topic models for learning terminological ontologies,” IEEE Trans. on Knowl. and Data Eng., vol. 22, no. 7, pp. 1028–1040, Jul. 2010. [Online]. Available: http://dx.doi.org/10.1109/TKDE.2009.122 [17] E. Stoica and M. A. Hearst, “Automating creation of hierarchical faceted
[18]
[19]
[20]
[21]
[22]
metadata structures,” in In Procs. of the Human Language Technology Conference (NAACL HLT, 2007. F. M. Suchanek, G. Kasneci, and G. Weikum, “Yago: A core of semantic knowledge,” in Proceedings of the 16th International Conference on World Wide Web, ser. WWW ’07. New York, NY, USA: ACM, 2007, pp. 697–706. [Online]. Available: http: //doi.acm.org/10.1145/1242572.1242667 O. Medelyan, S. Manion, J. Broekstra, A. Divoli, A. Huang, and I. H. Witten, “Constructing a focused taxonomy from a document collection,” in The Semantic Web: Semantics and Big Data, 10th International Conference, ESWC 2013, Montpellier, France, May 26-30, 2013. Proceedings, ser. Lecture Notes in Computer Science, ´ Corcho, V. Presutti, L. Hollink, and S. Rudolph, P. Cimiano, O. Eds., vol. 7882. Springer, 2013, pp. 367–381. [Online]. Available: http://dx.doi.org/10.1007/978-3-642-38288-8 25 C. Zirn, V. Nastase, and M. Strube, “Distinguishing between instances and classes in the wikipedia taxonomy,” in Proceedings of the 5th European Semantic Web Conference on The Semantic Web: Research and Applications, ser. ESWC’08. Berlin, Heidelberg: Springer-Verlag, 2008, pp. 376–387. [Online]. Available: http://dl.acm.org/citation.cfm? id=1789394.1789431 Z. Kozareva and E. Hovy, “A semi-supervised method to learn and construct taxonomies using the web,” in Proceedings of the 2010 Conference on Empirical Methods in Natural Language Processing, ser. EMNLP ’10. Stroudsburg, PA, USA: Association for Computational Linguistics, 2010, pp. 1110–1118. [Online]. Available: http://dl.acm.org/citation.cfm?id=1870658.1870766 R. Navigli, P. Velardi, and S. Faralli, “A graph-based algorithm for inducing lexical taxonomies from scratch,” in Proceedings of the Twenty-Second International Joint Conference on Artificial Intelligence - Volume Volume Three, ser. IJCAI’11. AAAI Press, 2011, pp. 1872–1877. [Online]. Available: http://dx.doi.org/10.5591/ 978-1-57735-516-8/IJCAI11-313