matic generation of urban space models from GIS sour- ces. A Voronoi ... FDVHV RI WKH SURSRVHG PRGHO V IXQFWLRQDOLW\ 7KLV SDSHU LV RU-.
20
SECCIÓN TÉCNICA
Methodology for Automatic Generation of Models for Large Urban Spaces Based on GIS Data Metodología para la generación automática de modelos de grandes espacios urbanos desde información SIG
Sergio Arturo Ordóñez Medina1*, Jhon Alejandro Triana Trujillo2*, Andrés Felipe Padilla Ramos3*, José Tiberio Hernández Peñaloza4* (1) ��������� �� ���� ���� ������� ��� �
� ���� ����� �� � � �� ����� (2) �� � �� ��
�
������ �� ���� ���� ������� ��� �
� ������ � � ������ � � �� ����� (3) ��� �� ���� ���� ������� ��� �
� �������� ���� � � �� ����� (4) ���!��" $���� ����%�&'����� ���*�� � ��'���� � �����$ �������� � � ��� � � �� ����� (*) Department of Systems and Computing Engineering, Universidad de los Andes, Bogotá D.C., Colombia. 5 � 7 ���89�� �� � �7� �� �:9;;����� �7� �� �:9;:
Palabras claves ! ��������� � � ��$ ?�� � � � ��� ��� K �� � � ���� � � $����� K � � ���Q ����
��@ ������ ��" $���� � ���� ���� ground transportation-Planning-computer simulation, urban development.
Resumen En las etapas de planeación y evaluación de proyectos de infraestructura es necesario manejar grandes cantidades de información. Las ciudades son sistemas complejos F� � � 7
� � �� ��� ������ ����� � �� �>
����� �� ��� modelos permitirán medir el impacto de los cambios de infraestructura, simular escenarios hipotéticos y evaluar resultados. Este artículo describe una metodología para generar automáticamente modelos espaciales urbanos desde fuentes SIG. Un diagrama de Voronoi es usado para dividir grandes regiones urbanas, y a continuación � < ������J� ���� � �R���* ���
������ ��� � ������ de modelos de aplicación son presentados, uno usado ����� � ���� ����� K � � � �Q �������� H���� ����?� ���
�� �� 7 � ��� � �� ?�
� � � �>
� � �� � F� � ��� ����� ��� �������?���� ��� ���� � � � ���� ��$� $��� ��� �� � changes, simulating hypothetic scenarios and evaluating results. This paper describes a methodology for the automatic generation of urban space models from GIS sources. A Voronoi diagram is used to partition large urban � � � ��� ����7� F�
���� < �J� ���$� � � ��* ������ some examples of application models are presented, one �� ��$���� ���� ���� � ��$� ��$ ��� � �� �
�� � > ���� �����
� ��� ����� ��� �������?���� ��� ���� � � � ���� ��$���� � ���� ����ting hypothetic scenarios and evaluating results. Challenges remain: the data may be heterogeneous, it may be unordered, or may come from multiple sources. The classical Geographical Information Systems (GIS) approach uses layers as �� ��� �� �
� � �� �W� ������� �� �� � �� �� �� �� ��7� � �� � ���� ����� ����� �7 ��> ����� �� �����?���>�� ���$���7-
jects. The classical approach offers overlapping layers for � � ��� � ���� �� ������ ?�
� �� �� � ��������� H�$ � �� ��$���� � ��� � �� � �@"���� ��
Handling the Distribution Issues (shared regions): " ���� �� ���� ���� J � � �� ��� ��7 ?
�� � � 7� ��� ���� � ��� �� � ���� �$� ���� �� $���� � � 7 ?
� ��7��� �� � � �� ��� F� � ���&� � $�� ������ ��� � � ����> �7
� � < �� 7 ?
� > ��� �� �� �$� �����
� ������ ��� � �� � �� are calculated automatically in the data entry step. &� � ��� � ?�� �� ���$����� ��� � � ������� � �� ����|��� � ������� ��&� �<�� � ������7� ��$� � ������� ����� �� ��� to its boundaries. Changes on the variables inside this subset
21
22
SECCIÓN TÉCNICA
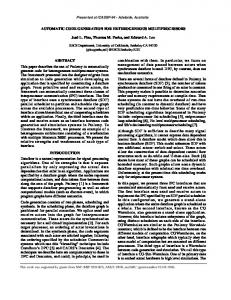
Figure 2. ���� ���� � ���� ������������� � ������� �� ������ ��� � � �
must be replicated to the corresponding neighbor intersection. The second type is a region outside the polygon near to its boundaries. This space is controlled by the neighbor polygons and it must replicate the information of the neighbor polygons. Fig. 2 illustrates the region encased in the Voronoi ������ � _���]� �� �`� � �� � � ���� �� � � � �� ? �� ��7��� ������ ��_?� `� The automatic generation of the shared regions is contro�� �� 7�� �� � $ �
� � � � � � �� ?� ��� � �� �� � � � J � �$� the shared regions. A group of parallel lines to the Voronoi ������ � � � � $ �
� � � � � � � �� ���� � � � �$� � � < �� �� corresponding enlarged, shared polygon. The intersections 7 ?
� ���� ��7���
���� �������� �� �� � �����
������� �� < � � �<�� � �� ����� ��� � � ���&� � �� � � �� 7 ?
� � �����
�
���� �������� �� �� ���� ��7��������� �� < � � �� �� �� �� �� ��
Urban Model: Structuring the Voronoi Polygon We propose three categories of elements for describing the ��
� �$� �� ������ \� J� ��� � � �� �� ?��]�� � �� �� � objects.
Zones: '�J� � ���� ?��� �
� � �����
� ��� > � � ��$� � �|���noi polygon, so it is not necessarily a convex polygon. Zones � �� �
��7� ��� � ��� � � ���7� ����� W� � ����> ��� � ��� ������ � � ���?� �����] � � �� ���� � � ����7� ���� � ����� ����� � �� < ���� � ���> �� � �|��� � ������� W� � � ��� ��� �� � � ������� �?� ������ � �7 �� �� ��� �� J� ��� �� � � ��� ��� �� ?� ��� 7 �� �� �� ��� �� �J� ��� &� ������ ��$��� � � �J� ���� ��� � � �� ��������> ��� �
�� ��� � ���?����7 �� �� �� � ������ ?��]�� � � � ?��]\� � � ?��]�� �� �� � � � � � Z�� �� �?��� ���� �� along a street. � ���J�� _&�? � �F��� `\� ���J��� �� � ��7� �� ��
� ���� ��� ?� � �� ��� ������� � ��� �� ��� ��
Sergio Arturo Ordóñez et al. / Revista de Ingeniería, #36, 2012, pp. 20-24
� �� J� ���� � �\�&� ���� J� ���� � ���� � ?��� �
� � ��� regions that affect the mobility of mobile actors from one or more types. Generally they are marked on the pavement. � ' �����\�' ���� ��� �� �
���7� ��� ���?� � ���� �� has been broken. They may refer to, for example, structural damage on a street.
Stretches and Stretches Networks: '�� � ���_��������� ��� ��
`� ����J� �?� � ���7 � ��� ���� ������> ��'�� � ���������� � � � ��$���> �
��?� ��� dicates the course of movement of mobile actors using the � � ���� '� � � ��� ���� >
� ��> � ?�� � � � � �� �$� ��> �
��� ] ���� ��?���? ����� � �� � ?���� �� '� � � ��� ?��]� �� �� ������ � � �$� � � �� ��� � � ���
?��]�� � �� � � � ��> �
� ���� � $��� ��7 � � �� ���� _$��� H���� �� �� ���7 � � ?��]��� � � � � � � ?��]��� ��7?��� ?��]��� ��`�
� ����� � ��� ?��]� ���������sociated to a mobile actor type. The stretches data sources �� �� ��� ������� ��? ��� � � � ��$���> �
������� � nomenclature, number of lanes, etc.
Point Urban Objects: A point urban object represents the space positioning of an urban object of interest. Examples of objects of interest ?� �������7 �� �� �
�� � � ��?����� � �
���� �
�������� � � �� ��� �� ��� ����� �� ��� �? > ��� ? � �
< �� > � ���� ��$� � �� � �7� � ��� 7 ���� � �$� � �� �
� �� ���7� ���7 � ���
� �
< �� ?�� �� ���$� such signs. � ���� > �> � ����� � �\����� > �> � ����� � ����� � ���� � ��> �� � ���H���� ���$� � ��] ���$�� � ��� �?�� �� signs and restrictive signs. � '� > �> � ����� � �\��� > �> � ����� � ���� �
������grammed behavior. Examples of this kind of signal are ��$ ����� �� � ���� � �� � F� � � � ��� � � �� �
� � �� � ���� ���� �� regions.
Function Definitions: �� �������Ȟ): returns the degree of vertex Ȟ �� � � � ���� �� ��i, pj): returns the euclidean distance between points pi and pj
Sergio Arturo Ordóñez et al. / Revista de Ingeniería, #36, 2012, pp. 20-24
A
E
ment Si ��?� � �� �� � �� ��
�� ��~ ��� ��pAi and pBi be end points of Si �� �
�� ��� ?����� ���� �
� � ��? ���7 � considered in their representation (latitude and longitude). III. For ( Si , SJ S|( pM|pM Si ^ pM Sj )) four line seg�
��? ���7 ��� � ��� ����� �� ��S�? ��
���� ��SAi: (pAi , pM), SBi:(pM , pBi ), SAj: (pAj , pM), SBj:(pM , pBj). Then Si and Sj are eliminated from S��� ��� ��� ��
�? �� � � same initial and end points is eliminated from S also. VI. A planar graph Gv < A,V � ��7� � ��?� � �V = {Ȟ: ( Si � S|pAi = Ȟ V $% = Ȟ)} and A = {a:( Si �S|{pAi , pBi}=a)}. Thus, ( Ȟ �V|degree(Ȟ) > 0). V. (Optional) A clustering algorithm is applied to V grouping elements of V ? �� � �
�� �$� A in common and ? �� �� ������ ���� � � � � � � � �� '� � �� � �� �> ��� � point is calculated for each group and it is added to V. Then, the points of each group are eliminated from V. The elements of A� ?��� � ?�� > � � �� ? � � � � � �� are also eliminated. The elements of A�?��� �� �> � H� ?������� � ���� ���� � � �> � H�? �� � ����� ��� �
� average point. VI. '���� � ��> ��|� ��� < �� � � �$����? ��?��\ � � ���� ����Ȟ�: Ȟ��9�^�degree�Ȟ � ��}� � � ���Ȟ�: Ȟ��9�^�degree�Ȟ � ��} � " �� � � ���Ȟ�: Ȟ��9�^�degree�Ȟ �>��} VII. A Voronoi Diagram Vor(V`� ��7� � �� < ��� � � ���� ��� graph V planar regions: R = {r: ( p r|p R2 ^ ( Ȟ V|( w V|euclidDistance(w,p) � $� � � �� 7 ?
� � �
�� $���� R and elements from V, point(r)and region(Ȟ). Construction ensures ( r R|isConvexPolygon(r)}, ( r R|( w V|w�point(r) ^ w r)) and ( r R|( p r|( a A|isNode(a,point(r)) ^ p a) V ( a A|¬isNode(a,point(r))^ p a))). VIII.�'� � � �$� ?��� �
� � ��� � � � �� _zones) are created over each element of R��&� ��� < �� � �$� � � �zones(r). � �� �� � ������ �� ?� � � isConvexPolygon(zones) is
� ���?���� �� ��'�J� � ��� < ��7����$� � � ���������teristic of the city, for example blocks or parks. As such, J� �Z�� < � ��������7 � H�� � ��?�
���$� � � ��� ������ � � ���$� � �� ��
��?� �� ��7 � H��� ���*��thermore, zones could overlap, so they are not a partition over an element of R.
E
I. A stretch� ����� �� �� �� ��
�� �������� ?��]� II. ����� ����� ?��]� � � ��� �� � �� �
�� 7�� �� � � � �-
��� �� � ����� �������F��� ���� � �� < ��C = {c : c squareTiling(R2)}. If the phenomenon of interest must be modeled in three dimensions a cubic lattice can also be � < �� X. (Optional) A partition over C� �� � < �� ��� $����?�\� I = {i: ( c i|c C ^ ( r R|center(c) r))}. Thus, each element of I�� < ����� ��� ������� ����� ��� ��ted to an element of R��&� ��� < �� � �7 � � > �$� � � � discretePolyg(r) that returns the corresponding element from I. XI. (Optional) Each element of C, from an I element related to a region r, is related to a set of elements of zones(r). zones(c) = {z:( r R, i I|z zones(r) ^ i = discretePolyg(r) ^ c i ^ center(c) z))} XII. (Optional)����� ��� � � ���� ��
�� �����$����?�\ � E = {e: ( c a|c C ^ ( r �discretePolyg(r) V distEPPol(center(c),r) < D))}. E is not a partition of C. Each element of E is a discrete polygon related to an element of R��&� ��� � �� �� ��
�� ��\��� �� entry, data processing and data persistence. The application ?���� > ��� ���� ���>��$��� � ��� ��
���� ���� ������ �sing steps and MySQL for the persistence step. A preliminary � �� ��� F� � �� �������
� � ��� ��F��� ��� �� � ��� �ting data points from the different data sources. To accom�� �� �� � ��� ��� > � ��$ ?�� � ����� ? � � � > ��� �� �� manually alter the GIS data. The data entry step reads the GIS data containing the reF� � �� $���� � �� �� �� � � ��
� ����� � GIS processing API, GEOTOOLS [5]. GEOTOOLS opens GIS� ����� �� J� ��� � � �� � �� ��7 � � �� ����� * ��� 8� ���?�� ��|��� � � ������ � ? �� $���� � � � �� �� �� 7���]�� � �� � �
���" ���������?�� � �� ��� ���� � �� �� ����9���� ���? � �
��� ���7� ��� ��?� �������� � � �� ���?��" � �����
��$��� � � AQM� ��7 ������ ��? ������� ���$������ � ��$���� � ���7� � mobility simulator, using the automobile vehicle actors. Fig. � ���� �� ����|��� � ������� �? ���
� � ��7� �� ���$���� the land lots data and air parcels over the streets space.
CONCLUSIONS A methodology for generating an urban model based on spatial partitions of existing GIS��� ��?��������� �� ���� �� �� support distributed applications, for example, micro simulation-based models for urban phenomena. The strategy of using intersections to systematically divide the city GIS representation and the use of Voronoi diagrams have offered good results. The geometric features of Voronoi � �����������?���� �� H
�� � ���� �� � ������� ���� �� ������ in concepts such as neighbor intersections and shared zones. The presented implementation supports the construction �$���� ���$���� � � 7� ��� ���� � ���&?�� H���� ���$������ � ���� � ��? � ��� �
�\���� ���� ���� � ��$���7� ���7 � �� ��
��
�� � �� � � � �� F��� �� � ���� � ��
�� > �� potential this automatic approach may have, it also exposes � �
��$��� ��� > ���$ ?�� � ����� �� ��� �� ����������� �� �� ���� ��$���� � �@"���� ��$� F�
����>� ��7� � � developing countries.
REFERENCES [1] J.C. Muller, et al. GIS and Generalization: Methodology and Practice. London: Taylor and Francis. 1995, pp. (19-56). [2] B. Jiang, C. Claramunt. “A Structural Approach to the ��� ��@
��� J� � ��$�� ��7� �� �
�% ?��]��An International Journal on Advances of Computer Science for Geographic.Vol., 8 No. 2 June, 2004, pp. 157- 171
Figure 3.�� ��� ����� ���� � ���� ���������" # �$ ��������� ��
Figure 4. ���� �� ������ ������ � ����� � � Polygon Rendered Buildings.
Using the Model: Urban Air Quality Modeling We are also developing an Air Quality Model (AQM), in order to provide a Computer Fluid Dynamics infrastructure based on the Lattice Boltzmann Method (LBM), to an air F��� �� � ���� ���� &� � AQM needs information about the land lots and the buildings on them, and the streets on each Voronoi polygon, in order to feed the LBM�? �����������$�
[3] T.H. Kolbe. “Representing and Exchanging 3D City ��� ��� ? �� � �@�~�� " � 3D Geo-Information Sciences. J. Lee & S. Zlatanova (Eds.). Berlin: 2009 (pp. 15–31). [4] M. De Berg. Computational Geometry: Algorithms and Applications. Berlin: Springer-Verlag, 2000. pp (147162). w�{�£@ �&������&� �¤�
������ ��>��@"��&���] ��@ ��&������ '���� �:9��:9;9��'>� ��7� \�� �\???�� � ��������� [6] J. Ibarra, J. Hernández, S. Ordoñez. (Nov, 2009). “MultiModal Simulation for Urban Mobility Analysis: An Approach Based on a Model of Behavior and Infrastructure� �� ��' ���� ���� \�13th Congress of Iberoamerican Society of Digital Graphics (SiGraDi 2009).