Analele Universit˘ a¸tii din Timi¸soara Vol. XLI, Fasc. special, 2003 Seria Matematic˘ a–Informatic˘ a
Automatic Clustering for the Web Usage Mining Presented at 5th Int. Workshop on Symbolic and Numeric Computer Science Mireille ARNOUX, Yves LECHEVALLIER, Doru TANASA Brigitte TROUSSE Rosanna VERDE
Abstract. In this paper we present an approach based on two hybrid clustering methods for Web Usage Mining (WUM). The WUM process contains three steps: pre-processing, data mining and result analysis. First, we give a brief description of the WUM process and Web data, followed in section 2 by the presentation of the pre-processing step and the data warehouse that we employed. Two hybrid clustering methods based on Principal Components Analysis (PCA), Multiple Classification Analysis (MCA) and Dynamic Clustering, are used for analysing the Web logs taken from INRIA’s Web servers. The results obtained after applying these methods and the corresponding interpretations are presented in section four of the article. Finally, we provide some perspectives and future work. Key words: automatic clustering, Web Usage Mining, WWW, Web logs, pre-processing, Data Warehouse AMS Subject Classification: 62-07
1. Introduction The spectacular development of the Web that occurred in last couple of years generated a boom of data related to its activities. To analyse (or rather excavate) these new types of data new methods appeared and were grouped under the generic term of ”Web Mining”. The domain of Web Mining is composed of three main axes: • Web Content Mining: advanced text analysis integrating Web particularities such as hypertext links and Web pages’ semantic structure, • Web Structure Mining: hypertext links analysis in order to classify Web pages and/or Web sites,
26
M.Arnoux et al.
• Web Usage Mining: analysis of the users’ behaviour on one/several Web sites. In this paper we will focus on the Web Usage Mining. 1.1. Web Usage Mining When designing large web sites, one needs to take in account the web site usability from the user point of view. This study (the WUM) of the users’ navigations extracted from the web server’s files or proprietary traces may help the webmaster to understand the user behaviour and then to rethink the structure and design of his/her web site or to detect users’ problems and improve the navigability. The WUM analysis, also, allows the webmaster to optimise the response of the Web server (Web caching) and to make recommendations to the user.
Web site structure
Data Mining
Pre− processing
Web log files
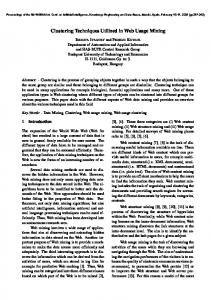
Fig. 1.
Transformed logs (BD)
Analysis
Patterns, Rules, Clusters
Results
The WUM schema
A Web Usage Mining process is commonly split in three phases: preprocessing, data mining and results analysis (Fig. 1). 1.2. Web Usage Data The Web log files are the input data in a Web Usage Mining process. The Web site structure (hyperlinks graph) and the users’ profiles may constitute supplementary data for such a process. First we need to solve, the problem of organising these various and bulky data. A database structure is necessary. More precisely, this should be a data warehouse as its characteristics (orientation, subject, integration, history and non-volatility) are useful (Kimball, 2001). The data warehouse is developed for decision purposes. The data warehouse is feed by mechanisms of extracting, transforming and loading data from the log files.
Automatic Clustering for the Web Usage Mining
27
HTTP Log Files According to the HTTP client-sever protocol, the client accessing a resource will send a request to the server containing this resource, e.g.: GET http://www.inria.fr/accueil.html At the other side, INRIA’s Web server interprets the HTTP request, accesses the requested resource and delivers it to the client. As most of the software programs, these operations are recorded in a log file. The log file allows us to have a detailed trace of the Web server activity. We use the ECLF log file format for the HTTP log files as described in (Luotonen, 1995). 2. Pre-processing The objective of the pre-processing step is to identify and structure user navigations. This step is based on two main processes: data cleaning and data transformation. At the end of this phase, the Web logs will be placed in a database warehouse. 2.1. Pre-processing of the Web log files Data Cleaning: Data cleaning in the Web log files consists in deleting un-useful requests from the log files. These requests are, usually, for images or multimedia files. Identifying Web robots and deleting the requests coming from these robots is another task of this process. Data Transformation: The statistical unit for the analysis was the request. But, to perform more complex analysis, including clustering, we need to group together several requests. All the requests made by a single user during the analysed period constitute his/her session. A session is further split in several navigations, each navigation representing a single visit to the Web site. A navigation ends when a time threshold of at least 30 minutes exists between two consecutive requests. User/Session Identification Identifying users/sessions from the log file is not a simple task because of several factors like: proxy servers, dynamic addresses, the case of two or more users using the same computer (library, Internet caf´e, etc.) or the same user that uses more than one browser or computer. In fact, by using the log file we know only the computer’s address and the User Agent of the user. This is not sufficient in most of the cases that is why there are other methods that can provide more information. The most used are: cookies, dynamic Web pages (with a session ID in the URL), registered users, modified browsers etc. In (Cooley, 2000) the author differentiated
28
M.Arnoux et al.
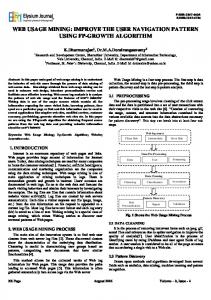
users by their navigation history. For Inria’s Web log files, we used the couple (Host, User Agent) for the user identification. For privacy reasons1 , we have replaced the original host name with an identifier that still keeps the information about the domain extension (country code or organization type: .com , .edu, .org etc.). For our organization’s host we recorded more detailed information such as: the research unit and the research team / service. To obtain the server session of each user we sorted the log file by (Host, User Agent) and then by time. This session contained all the accesses (requests) of this user in the analysed period. Splitting a session in several navigations as previously described is a straightforward process doesn’t need to be further detailed. The interested reader can find further details concerning the pre-processing of Web log files in (Cooley, 2000, Tanasa, 2003). 2.2. Building a WUM Data Warehouse After the steps described above, the Web Usage data can be used to populate the database (DB). The DB is a lasting data warehouse where all the viewpoints are kept. It is different form all other DBs presented in the literature as they are more short-lived or more specialised. First, we will present our model then the main related works. Our DB schema for WUM Our DB model for WUM is a star schema and it is currently implemented using the Access software from Microsoft (Fig. 2). The facts: The facts came from the log files filtered, ordered and enriched with data calculated as we have presented in the previous sections. The study is centred on the user, therefore the fields are mainly the duration and the size read when he/she accesses a Web page. As we intend to have a user track better than the usual server log files, we need to capture the user satisfaction when he/she reads a Web page. The ”satisfaction” can be explicitly expressed (using a survey or a questionary) or deduced from his/her behaviour. The dimensions. The selected dimensions can be split up into: • Dimension related to the URL and the page viewed. It is the view Content. Many classifications are possible, just from the file extension but also from other information from the Web site (e.g. the position of the file in the file hierarchy). 1 Useful when sharing log files or publishing results. To encrypt host name or IP address we use a modified script from Lire (www.logreport.org)
Automatic Clustering for the Web Usage Mining
Fig. 2.
29
The DB relational schema
• Dimension related to the date. It is the view Access regularity. The usual hierarchy second, minute, hour, day, month, year can be used as well as any other hierarchy with more specialized periods. • Dimension related to the session and the user. It is the view User. A session is issued from the user (when he/she stops requesting for a relatively long time). In our context the user belongs to the following hierarchy : domain → research unit → research team/service. But others classifications are allowed based on different criterions as we shall see further. The description may include the relevant class with this meaning. • Dimension related to the referrer and the navigation. It is the view Navigation. The referrer allows (although with some uncertainties) to map out the user navigation which may be linear or with many returns. To help the user in a collaborative view on his/her search in the web site it is essential to classify these navigations. • Dimension related to the transaction status. It is the view Access efficiency. The server log files give the result as status success, failure, redirection, forbidden access. Here, once again, we can
30
M.Arnoux et al.
define another status type within the context of the request emission rather than the request treatment: for example, when a recommendation system and a precise user tracking are used, we can report whether the current page has been recommended. The hierarchies of dimensions: In this study, the existence of multiple hierarchies of dimensions is essential. Our main goal for the current implementation whith Access software was efficiency. So, we have introduced a foreign key for each element of dimensions. However, in the Access schema, the hierarchies of dimensions are only seen in the way the tables are grouped (session under IP and user agent) or the hierarchies are directly written in the fields of a table (URL under topic2, under topic1). These hierarchies are very used in a data warehouse for roll-up or drill-down operations depending on whether more synthetic or more detailed data is wanted. We plan an implementation with Oracle9i which offers multiple hierarchies of dimensions and has effective tools for online analysis processing (OLAP, ROLAP). Moreover, Oracle9i Warehouse Builder stores metadata according to the standard Common Warehouse Metamodel (CWM) and it automates the extraction, translation and the loading process (ETL) of data sources. 2.3. Comparison with Existing Works Data from Web Usage are often used for Web site access statistics or for forecast of requested pages. In order to do this, the data are filtered and then organised and stored according to two essential ways: a) Dedicated structures are used, essentially graphs and vectors. Graphs and trees are used when complex navigation models must be processed. For example WUM (Spiliopoulou, 1999) (Web Utilisation Miner) uses weighted aggregation trees to represent the navigation traffic along roads corresponding to the logical structure of the Web site. WUM proposes a language named MINT with a syntax close to SQL in order to make requests about the routes in the navigation tree. N-dimensional vectors are also used when the space of navigation is well known. WEBMiner (Mobasher, 2002) represents a transaction as a vector in the space of the reachable pages. On the other hand, in this work, some other information about users and documents are used for the analysis. There is a general request language to access the data but then different structures are used according to the goal of the analysis. b) Data are only stored in files or relational tables. This is the case for
Automatic Clustering for the Web Usage Mining
31
many widespread software for web traffic analysis. Files and tables are often flat and basic and they are hidden from the scene. Nevertheless we think that such representations can be better developed and can federate all the aspects of the web usage data in the same stucture avoiding the many representations of the precedent method (one structure for navigation, one for user profile, etc.). We choose this method as they do in the following works. In (Bonchi, 2001) the authors implement a data warehouse as a relational database with Microsoft SQL Server. The goal is to optimise memory caching thanks to data analysis. Facts are from log files and with calculated fields as LastAccess and NextAccess, the distances (numbers of lines in the log file) between the current access to the same URL and the last or the next one. The field PageDelay is the number of seconds from the last request for a page to the current request for a page issued from the same user. Thanks to this field the pages are divided into links and contents, the first ones being read quickly and the others slowly. For us this is related to a visit and it is different from our notion of session which is larger. The dimensions are not in specific tables; only to the dimension URL is given an ID in addition to its character string because strings are very slow to process. Other information from the Web site are added; for example the depth of the requested file in the logical structure of the site. At last, we point out two interesting things: the transactions temporal ordering and the field Class (in the table WebLog) which can be later valued to classify the transactions. We also use temporal ordering and the results issued of our classification can be XML coded and placed in a field of a dimension table. WebLogMiner (Zaiane, 1998) is a web usage mining software using a data warehouse and building a multi-dimensional cube to apply OLAP techniques. Among these dimensions, there are the ones found in the log files (URL, type and size transmitted, date, duration, user, agent, domain, status) and two more dimensions FieldSize and Event. FieldSize is related to the structure of the site and Event is related to a typical action of the user (use a V-group, add a message, read a message). It is very close to our concerns to describe the site and to have a better tracking of the user actions. With WebLogMiner, in the dimensional model, a fact is a user click described by its n dimensional values. It is equivalent to a fact table without explicit attributes, all fields being foreign keys. In our work, we need vol-
32
M.Arnoux et al.
ume and satisfaction as explicit attributes in the fact table. WebLogMiner gives all statistics about web traffic analysis but also builds models of users and shows trend analysis. It is near our objectives of clustering detailed in the next section. 3. Clustering Methods After the pre-processing step, the data from the log file is structured in sessions and navigations and stored in a DB. We can now proceed at the analysis. This step objectif is to discover different types of user behaviours or categories of user behaviours using different approaches (Sauberlich, 2002) : sequences analysis algorithms, cluster analysis, predictive models, neural networks and automatic clustering. 3.1. Related Works Although there are numerous methods of clustering used in Data Mining, only few are used in the Web Usage Mining: BIRCH in (Fu, 1999), CLIQUE in (Perkowitz, 1998), EM in (Cadez, 2000). A plausible reason for this comes from the difficulty of adapting these methods to the particularities of Web data: the big size of the data or the large number of variables (Web pages). In (Mobasher, 2002), the authors compare two clustering methods, but they don’t take the order of the requests into account. The sessions (transactions in this paper) are represented by binary vectors balanced by page views. The weight of a page can be the value of time function or a function that considers the type of the page. PACT, the clustering method, groups the sessions of the users. First, a similarity function is applied. Then profiles are defined as being couples (page, weight). PACT has been compared to CLIQUE (Perkowitz, 1998) and the authors affirm that it outperforms CLIQUE. In (Fu, 1999), the sessions are generalised by means of an induction based on the attributes. This induction reduces the dimensions of the data. For instance, www-sop.inria/axis/teaching/stid-projet2.html is organised as a hierarchy such as the following: www-sop.inria → axis → teaching → stidprojet2.html. The authors then use BIRCH (Zhang, 1996) to cluster the generalised data. The method has been tested on the log of the UMR’s server. The log contained 2.5 millions lines, but the tests were conducted on 500 000 lines. The number of users was 26 107 and the number of pages was 21 203. However, upon the authors, BIRCH gets less efficient when data dimension is increased, so the generalization is limited to a few levels.
Automatic Clustering for the Web Usage Mining
33
3.2. Our approach The objective is to develop a strategy which analyses the relations between the structure of the Web site and the log file. To reach it, we apply two different hybrid clustering methods on different types of Web data (continuous and qualitative). 3.3. Clustering Method for Numeric Web Data The first analysis method is the hydrid clustering on the log file, the objects are ”navigations” and the variables are continuous. This hydrid clustering uses Principal Compoment Analysis (PCA) for visualization of the correlations between variables defined on the log file and Dynamic Clustering Method on the principal factors given by PCA. The objective of the Dynamic Clustering Method is to find a group of homogenous ”navigations”. Dynamic Clustering method can be summarized as : Step 1: Initialisation Let k objects of a set of ”navigations” at random, be the ”representation” of the k clusters. Let us call them A1 ,...Ak . Step 2: Affectation step All navigations Xi are assigned to cluster k iff d(Xi , Ak ) is minimum. Step 3: Representation Step A new representation Ak is computed, it is the average of the elements of the cluster k. Step 4: Stability If all navigations do not change the cluster Stop, else go to step 2.
A pre-processing of the log file is necessary in order to calculate the six following active variables for each navigation which are used for the PCA analysis: PRequest SEL NBrequest DureeTotale Repetition MDur´ee OK MSize OK
ratio of successful requests total number of requests total duration of the navigation ratio related to the repeated requests average duration of a request inside the navigation average size of reached page
The navigations clustering phase will be followed by the description of the clusters and their position on a factorial plan. 3.4. Clustering Method for Qualitative Web data The second analysis is again an hybrid clustering method applied on qualitative variables. It realizes a Multiple Correspondence Analysis on a set of navigations related only to the first two Web sites: www and www-sop. Each variable
34
M.Arnoux et al.
corresponds to the semantic topic of each considered Web site, it is a qualitative variable. After the MCA, we use a Dynamic Clustering Method with a khi2 metric and we obtain some groups of navigations and their interpretations. For this analysis, we need to structure together the set of Web pages in semantic topics . The algorithm that we used is again Diday’s moving clouds method (Diday, 1971), belonging to the family of the kmeans algorithms. This algorithm seeks for a partition P of E consisting in k clusters and an array L of k prototypes so that it minimises: ∆(P • , L• ) = M in{∆(P, L) | P ∈ Pk , L ∈ Dk }, where Pk is the set of E’s partitions in k non empty clusters. This criterion D expresses the adequation between the partition P and the array of k prototypes. It is often defined as the sum of the distances between all the objects s of E and the prototype gi of the cluster Ci - the nearest of them. For this method, we define two new navigation parameters by each considered Web server: SyntacticTopic-WebServer SemanticTopic-WebServer
vector of WebServer syntactic topics vector of WebServer semantic topics
4. Application on INRIA’s Dataset To test our approach, we choose to use data from three of INRIA’s Web Servers: www.inria.fr, www-sop.inria.fr and www-futurs.inria.fr. There are many links between these Web servers and one of the purposes of our analysis was to detect groups of topics consulted together. 4.1. Raw Data The Web logs were collected for a period of two weeks, between the 1st and 15th of January 2003. The data summary is presented in Tab. 1. Web servers Period Number of requests Requests after pre-processing Number of sessions Number of navigation
Table 1.
{www, www-sop, www-futurs}.inria.fr 1 - 15 January 2003 6 040 312 673 389 115 825 174 015
Data summary for our experiment
4.2. Preprocessing (related to our clustering method) For the first analysis, we decided to keep only the “long” navigations, i.e. navigations
Automatic Clustering for the Web Usage Mining
35
having a duration superior to 60 seconds. The second condition was that the number of visited pages must be superior to a threshold of 10 pages. Finally, the third condition was that the “browsing” speed (i.e. the ratio between the duration of the navigation and the number of visited pages) must be superior to a threshold of 4 sec./page. After applying these constraints to our DB of navigations we selected 9 700 navigations. The number of valid requests (i.e. the status code was between 200 and 399) for these navigations was 282 705. On this set of navigations we applied the first clustering technique. For the second analysis, we choose from the first set of navigations only those navigations that had requests only on the Web sites: www and www-sop. The number of navigations with requests on the Web site www-futurs site was very small (28), so we decided to remove them. Finally, the number of navigations that verified all these conditions was 3 969. 4.3. Data Warehouse According to the relational model from Fig. 2, in the data warehouse, we had three types of information: • information about the Web site usage (requests, navigations), • information about the users (IP, domain name, country, etc.) and • information about the Web site (URLs, topics). The first type was already presented in the previous section. We discuss the other two below. The information about the users During the period analysed, a total of 115 825 users made requests to the three Web servers. Most of the users came from France (30.7%) and from those 1 989 users came from one of INRIA’s research units. If the research unit was “Sophia Antipolis” (i.e. 429 users) then, we also knew the research team or service to which the user belongs. The information about the Web site There were 86 640 URLs requested from the three Web sites. According to their syntax, the URLs were grouped in semantical topics. We gave the definition of the semantic topic at the first level for both Web sites (www and www-sop). To each syntactic topic of first level corresponded a semantic topic of first level. For example, the URL http://www-sop.inria.fr/axis/ software/index.html has ‘‘axis’’ as the first syntactic topic and ‘‘research team’’ as the semantic topic. We had 58 different semantic topics for both Web sites.
36
M.Arnoux et al.
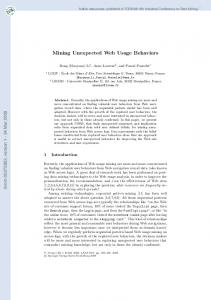
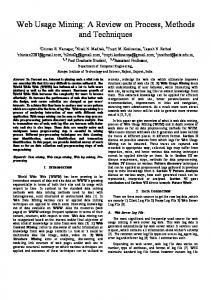
4.4. First Analysis Results (continuous variables) The results for the PCA are shown in the correlation circle (Fig. 3) and in the clusters map (Fig. 4). There are 7 different clusters, but clusters 1, 2, 4 and 5 are the most significant ones. Cluster 1 contains navigations that are generally short. The average duration and number of visited pages are shorter than the average value for all 9 700 navigations. An interesting cluster, although small (only 17 navigations), is the cluster number 6. It contains very long navigations (with a average of 887.76 pages/navigation), coming from the .net domain extension, usually made at night and on the 1st of January. We think that these navigations are done by Web robots because it is known that these tools, generally, crawl Web sites at night and at the beginning of the month.
Fig. 3.
The Correlation Circle
4.5. Second Analysis Results (qualitative variables) With the MCA we obtained 11 clusters. For example, the cluster 10 (Tab. 2) represents 19.01% of the navigations. This cluster contains the navigations which
Automatic Clustering for the Web Usage Mining
Fig. 4.
37
The PCA result
visit the Web pages of the INRIA reporting activity (activity reports, technical reports and other reports). In this case the goal of these users interets is precise, the visitor interest is to read the activity reports of the INRIA researchers. This real life application shows the interest of our methodology. Label www ra www rrrt www rapports sop rapports
Table 2.
V.Test 240.13 12.85 10.68 7.17
Cluster/Freq 85.27 28.82 44.13 35.31
Freq/Cluster 66.49 3.00 0.56 0.45
Global 14.82 1.98 0.24 0.24
Description of cluster 10
5. Conclusion and Future Work In this paper we proposed two methodologies for classifying Web Usage data. Our approach uses two hybrid clustering methods (PCA or MCA followed by a Dynamic Cluster-
38
M.Arnoux et al.
ing Method) to analyse the pre-processed data issued from Web logs. We tested the methodologies on a real life dataset (Web logs from INRIA) and we obtained coherent results. Our near objective is to realise a correlation between these two analysis. This can be done, eventually, by introducing new parameters for the characterisation of the Web Usage data. We also plan to introduce a hierarchy on the semantic topics (the information about the Web site). REFERENCES F. Bonchi, F. Giannotti, C. Gozzi, G. Manco, M. Nanni, D. Pedreschi, C. Renso, and S. Ruggieri. Web log data warehousing and mining for intelligent web caching. Data Knowledge Engineering, 39(2):165–189, 2001. I. V. Cadez, D. Heckerman, C. Meek, P. Smyth, and S. White. Visualization of navigation patterns on a web site using model-based clustering. In In Proceedings of the sixth ACM SIGKDD International Conference on Knowledge Discovery and Data Mining, pages 280–284, Boston, Massachusetts, 2000. R. Cooley. Web Usage Mining: Discovery and Application of Interesting Patterns from Web Data. PhD thesis, University of Minnesota, May 2000. E. Diday La methode des nuees dynamiques. Revue de Statistique Appliqu´ ee, XIX(2):19–34, 1971. Y. Fu, K. Sandhu, and M. Shih. A generalization-based approach to clustering of web usage sessions. In Proc. of the 1999 KDD Workshop on Web Mining, San Diego, CA. Springer-Verlag, volume 1836 of LNAI, pages 21–38. Springer, 2000. Ralph Kimball. Entrepˆ ots de donn´ ees. Editions Vuibert, 2001. Y. Lechevallier, D. Tanasa, B. Trousse, and R. Verde Classification automatique : Applications au Web Mining. In 10` emes Rencontres de la Soci´ et´ e Francophone de Classification (SFC03), Neuchˆ atel, September 2003. A. Luotonen. The common log file format. http://www.w3.org/Daemon/User/Config/ Logging.html, 1995. B. Mobasher, H. Dai, T. Luo, and M. Nakagawa. Discovery and evaluation of aggregate usage profiles for web personalization. Data Mining and Knowledge Discovery, 6(1):61–82, January 2002. M. Perkowitz and O. Etzioni. Adaptive web sites: Automatically synthesizing web pages. In AAAI/IAAI, pages 727–732, 1998. CISIA. SPAD Reference Manuals. In Centre International de Statistique et d’Informatique Appliquees., France 1997. M. Spiliopoulou, L. C. Faulstich, and K. Winkler. A data miner analyzing the navigational behaviour of web users. In Proc. of the Workshop on Machine Learning in User Modelling of the ACAI’99 Int. Conf., Creta, Greece, July 1999. F. S¨ auberlich and K.-P. Huber. A framework for web usage mining on anonymous logfile data. In Exploratory Data Analysis in Empirical Research, Proceedings of the 25th Annual Conference of the Gesellschaft f¨ ur Klassifikation e.V., March 2001, pages 229–239. Springer-Verlag, 2002. D. Tanasa and B. Trousse. Le pr´ etraitement des fichiers logs web dans le “Web Usage Mining” multi-sites. In Journ´ ees Francophones de la Toile (JFT’2003), July 2003. Osmar R. Zaiane, Man Xin, and Jiawei Han. Discovering web access patterns and trends by applying OLAP and data mining technology on web logs. In Advances in Digital
Automatic Clustering for the Web Usage Mining
39
Libraries, pages 19–29, 1998. T. Zhang, R. Ramakrishnan, and M. Livny. Birch: An efficient data clustering method for very large databases. In Proc. of the 1996 ACM SIGMOD Intl. Conf. on Management of Data, Montreal, June 1996, pages 103–114. ACM Press, 1996.
AxIS Team-Project, INRIA Sophia Antipolis, 2004, Route des Lucioles, BP 93, 06902 Sophia Antipolis, FRANCE E-mail:
[email protected]
Received August 2003