{slh, dawant}@vuse.vanderbilt.edu. Abstract. Automatic volumetric measurements of brain structures and substructures is a prerequisite for longitudinal studies ...
Automatic Computation of Brain and Cerebellum Volumes in Normal Subjects and Chronic Alcoholics S. L. Hartmann1 , M. H. Parks2 , H. Schlack2 , W. Riddle3 , R. R. Price3 , P. R. Martin2 , and B. M. Dawant4 1
4
Department of Biomedical Engineering, 2 Department of Psychiatry, 3 Department of Radiology, Department of Electrical and Computer Engineering, Vanderbilt University, Nashville, Tennessee, USA {slh, dawant}@vuse.vanderbilt.edu
Abstract. Automatic volumetric measurements of brain structures and substructures is a prerequisite for longitudinal studies as well as studies aimed at measuring and quantifying differences between populations. This study tests the hypothesis that a fully automatic, atlas–based method can be used for the computation of the volume encompassed by the dura, the volume of the brain, and the volume of the cerebellum from which indices of atrophy are estimated. The method has been tested on normal volunteers and alcoholic patients. It has been validated both by comparing contours obtained manually and automatically and by repeating the measurements on serial acquisitions. Results demonstrate that the method is both robust and accurate, even in the presence of large morphological differences due to severe atrophy caused by chronic alcoholism.
1
Introduction
A number of atlas–based methods have been proposed in the recent past to label and segment structures and substructures in medical images [1]. These techniques involve the segmentation of a reference volume and its non–rigid registration to the volume to be segmented. Possible approaches include the use of landmarks in which the deformation is computed based on control points and interpolated through the remainder of the volume. But, the automatic or semi– automatic identification of these control points remains challenging. Other techniques attempt to maximize intensity similarity on a voxel–by–voxel basis. These methods have the advantage of being fully automatic but they may be affected by large morphological differences between brain volumes. Results reported in the literature typically involve normal subjects or patients with pathologies that do not drastically alter the shape of the brain, such as schizophrenia or epilepsy. In these applications, small deformations are sufficient to warp one brain onto the other. In contrast, the study presented herein involves chronic alcoholics with A. Kuba et al. (Eds.): IPMI’99, LNCS 1613, pp. 430–435, 1999. c Springer-Verlag Berlin Heidelberg 1999
Automatic Computation of Brain and Cerebellum Volumes
431
very severe brain atrophy. Severe atrophy considerably reduces the size of the cerebellum and enlarges the sulci and the ventricles. This decreases the similarity between the atlas and the subject volumes, thus challenging deformation algorithms. This work tests and evaluates the robustness of an automatic method for the computation of pre–atrophy brain volumes and the post–atrophy brain and cerebellum volumes.
2 2.1
Methods Data Sets
Seven normal volunteers and seven patients with a history of alcoholism were used in theis study. Multiple 3–D magnetic resonance (MR) image volumes were obtained of each subject. Normal subjects were scanned three times within a period of three weeks (n=5) or within a period of 5 months (n=2). Alcoholic subjects were admitted to a detoxification program, and the first scan was obtained within 5 days of abstinence. The second scan was obtained within one month, followed by a third scan at approximately 3 months after the first scan. An additional image volume obtained with the same imaging parameters was used as an atlas. All image volumes were acquired with a General Electric 1.5 Tesla Signa MR scanner using a spoiled gradient echo pulse sequence. Each volume consists of 124 sagittal slices, and each slice has dimensions of 256 × 256 pixels. Voxel dimensions were .94 × .94 × 1.3 mm3 . 2.2
Image Registration
The registration algorithm consists of two major steps. First, a seven–parameter (three rotation angles, three translation vectors, and one scaling factor) transformation that brings the two volumes into global correspondence is computed. Next, the volumes are deformed using a non–rigid transformation to bring these two volumes into local correspondence. Both of these steps are fully automatic. Because the method used in step (2) is also used to compute the transformation in step (1) the local transformation method is described first. All the algorithms used in this study were written in IDL (Interactive Data Language, Research Systems, Inc.) and executed on a Sun Ultra 1 workstation (Sun Microsystems, Mountain View, CA). Local Registration: Recently, Thirion [2] presented the problem of image matching in terms of demons (by analogy with Maxwell’s demons). This is a general framework in which object boundaries in one image are viewed as semi– permeable membranes. The other image, considered as a deformable grid, diffuses through these interfaces driven by the action of effectors (the demons) situated within the membranes. Various kinds of demons can be designed to apply this paradigm to specific applications. In the particular case of deformations based on voxel–by–voxel intensity similarity the demons paradigm is similar to optical flow methods. It is an independent implementation of this approach that
432
S. L. Hartmann et al.
has been used in this study [3]. This algorithm results in a deformation field (i.e., a displacement vector for every voxel in the volume) that can be used to warp one image onto the other. Global Registration: Prior to applying the deformation algorithm, the images to be matched are brought into approximate correspondence using a seven–degrees–of–freedom transformation. Displacement vectors computed as described in the previous section were used to identify a set of points in the first image and a corresponding set of points in the second image. These homologous points are then used to compute the global transformation. Typically, the global transformation computed with this approach is not as accurate as one computed with other methods, such as mutual information. However, it has the advantage of being fast and is sufficiently accurate to serve as a reliable starting point for the deformation algorithm. 2.3
Segmentation
The atrophy indices of interest require pre– and post–atrophy brain volumes as well as cerebellum volume. Pre–atrophy brain volumes are difficult to obtain, so instead, the intra–dural volume was used as the reference to which brain volumes are compared. The intra–dural volume in the atlas was determined by careful manual delineation. Contours were outlined in each slice of the sagittal volume, and a binary mask of the intra–dural volume was created. This same method was repeated to obtain a binary volume of the cerebellum (both hemispheres) in the atlas volume. The region was segmented to include the entire cerebellum region, and individual folia were not followed. Note that the first volume also included the cerebellum. In order to segment the intra–dural region and the cerebellum in subject volumes, the atlas was first registered to each volume. The deformation field was then applied to the binary atlas volumes to create intra–dural and cerebellum masks in each individual volume. 2.4
Volume Measurements
The intra–dural brain volume of each subject is determined simply by the volume of the mask created by projecting the atlas mask onto each individual volume. The brain volume (white and gray matter) is obtained by thresholding the intra– dural image to eliminate cerebrospinal fluid. The threshold value was manually chosen in the atlas volume. In order to compensate for inter–scan intensity variations, this threshold level was automatically adjusted to the proper value for subject volume using a histogram equalization technique. This threshold was then applied to the segmented intra–dural images, and a brain volume was determined. The cerebellum volumes were computed in the same manner as the brain volumes, using a separate intensity threshold.
3
Results
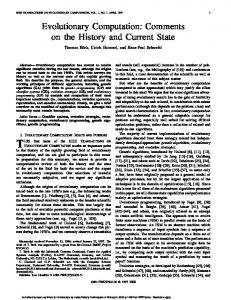
Figure 1 illustrates qualitatively the type of results that were obtained. The left panel shows one slice in the atlas volume. The right panel shows the slice
Automatic Computation of Brain and Cerebellum Volumes
433
with the same index in one of the patient volumes. Observe the large amount of atrophy (enlarged sulci and ventricles and atrophied cerebellum) visible in the patient volume. The middle row shows the slice with the same index in the volume obtained by warping the normal brain volume onto the atrophied brain volume. After deformation, the ventricles in the normal brain volume have been dramatically enlarged, the thickness of the corpus callosum has been reduced, sulci have been enlarged, and the overall shape of the head has been modified, but the integrity of the cortical structures has been preserved. Figure 2 illus-
Fig. 1. Results of the elastic registration algorithm
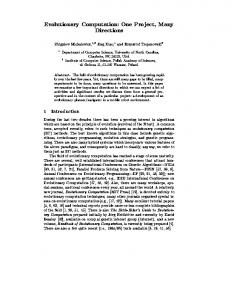
trates representative results for the automatic segmentation of the cerebellum. This figure shows one slice in each of three alcoholic subject volumes with the cerebellar contours obtained with the automatic technique overlaid in white. Observe the ability of the algorithm to produce accurate results even when the shape and orientation of the cerebellum varies greatly from one volume to the other. To evaluate our results quantitatively we differentiate between repeata-
Fig. 2. Automatic cerebellum segmentation results for three alcoholic subjects
bility and accuracy. The data set used in this study includes three acquisitions per subjects (both for the normal and the alcoholic volunteers). This permits
434
S. L. Hartmann et al.
the evaluation of the consistency and repeatability of our measurements. Indeed, changes are not expected in the volume encompassed by the dura in either the normal or the patient population and only minor changes (if any) are expected in the brain and cerebellar volumes for the normal population. Changes related to abstinence may be observed both in the brain and the cerebellum volumes for the patient population. Consistent values for structures that are not expected to change in serial scans of the same subject are thus good indicators of the reliability of our measurements. Accuracy has been assessed by comparing the results obtained automatically to results obtained by manual delineation. 3.1
Repeatability
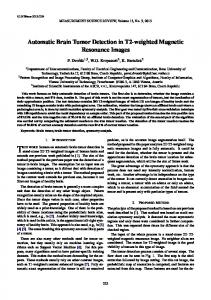
Figure 3 shows the intra–dural volumes obtained for both the normal and the patient population. For each subject the figure shows the volume computed for each acquisition. Space restrictions preclude the inclusion of similar figures for the cerebellar volumes but results were comparable.
Fig. 3. Intra–dural volumes, determined automatically, for each normal and alcoholic subject used in this study
3.2
Accuracy
For each and every volume, four slices were segmented manually (two for the brain and two for the cerebellum). These slices were chosen by determining the range on which the structures were visible in the image volumes and randomly selecting two slices per structure within this range. Ranges, and therefore selected slices, were different for the cerebellum and for the brain. The similarity between contours obtained manually and contours obtained automatically were computed using a similarity index S derived from the kappa statistic [4]. This index varies between 0 and 1 (1 indicates perfect agreement between two contours while 0 indicates no overlap) and is sensitive to both differences in size and
Automatic Computation of Brain and Cerebellum Volumes
435
structure orientation. This strategy resulted in 84 brain and cerebellum contours for the normal population and 84 contours for the alcoholic subjects. The mean similarity indices for the normal subjects were 0.98 for the intra–dural volume and 0.95 for the cerebellar volume. These indices were 0.97 and 0.94 for the alcoholic subjects.
4
Discussion
This study demonstrates that fully automatic, robust, and accurate segmentation of the whole brain and cerebellum can be accomplished using atlas–based methods. To the authors’ knowledge, this is the first time that results have been reported on a study involving atlas–based segmentation of brains with pathologies that alter brain morphology to the extent observed in this data set. Intra– dural volumes demonstrate the excellent repeatability of the results. Accuracy was tested by comparing contours delineated manually and contours delineated automatically. Arguably, manually delineated contours are not the ultimate gold standard. But, in this case the contours were drawn by the same rater on the atlas and on each individual slice used for the evaluation. The entire atlas was also delineated twice and similarity indices of 0.98 and 0.96 were observed for the intra–dural and cerebellum volumes, respectively. The average similarity indices we have observed between manual and automatic delineation on the slice selected for evaluation are therefore comparable to the intra–rater variability. Thus, results obtained on this data set support the hypothesis that automatic delineation is as reliable and accurate as manual delineation when the manual segmentation is performed by a single individual.
Acknowledgment This work was supported in part by NIH grant R01 AA 10583.
References 1. Maintz, J.B., Viergever, M.A.: A survey of medical image registration. Medical Image Analysis 2 (1998) 1–36 2. Thirion, J–P.: Image matching as a diffusion process: an analogy with Maxwell’s demons. Medical Image Analysis 2 (1998) 243–260 3. Hartmann, S.L.: Automatic segmentation of medical images using optical flow based atlas deformation. Master’s Thesis, Department of Biomedical Engineering, Vanderbilt University (1998) 4. Zijdenbos, A., Dawant, B.M., and Margolin, R.: Morphometric analysis of white matter lesions in MR images: method and validation. IEEE Transactions on Medical Imaging 13 (1994) 716–724