Automatic detection of hypernasal speech signals using nonlinear and entropy measurements J.R. Orozco-Arroyave.1,3 , J.D. Arias-Londo˜no2 , J.F. Vargas-Bonilla1 and Elmar N¨oth3 1
Department of Electronics Engineering, Universidad de Antioquia, Colombia. 2 Department of Systems Engineering, Universidad de Antioquia, Colombia. 3 Pattern Recognition Lab, Universit¨at Erlangen-N¨urnberg, Germany. Corresponding author:
Abstract Automatic hypernasality detection in children with Cleft Lip and Palate is classically performed by means of acoustic analysis; however, recent findings indicate that nonlinear dynamics features could be useful for this task. In order to continue deepening in this issue, in this paper the discriminant capability of 4 different nonlinear dynamics features along with a set of 6 entropy measurements is studied. The whole set of features is optimized using an automatic feature selection technique based on principal component analysis. The decision about the presence or absence of hypernasality is made by employing a support vector machine. The system is tested over two databases, one considers the five Spanish vowels and the words /coco/ and /gato/, and the other one considers different German words. The performance of the system is presented in terms of accuracy, sensitivity, specificity and receiver operating curves. According to the results, the accuracy of system increases when nonlinear and entropy measures are combined. Index Terms: Hypernasality, Cleft Lip and Palate, nonlinear dynamics, entropy measures.
1. Introduction The Cleft Lip and Palate (CLP) is the second most frequent congenital malformation worldwide [1] and it is characterized by an incomplete formation of the structures that separate nasal from oral cavities, generating different morphological and functional disorders such as hypernasality, hyponasality, glottal stop, among others [2]. As hypernasality is the most common pathology suffered by patients with CLP, the research community is interested in the development of robust systems for its detection and evaluation [3, 4]. Automatic detection of hypernasal voices can be addressed considering classical measurements such as temporal and amplitude perturbation, noise estimates and Mel-Frequency Cepstral Coefficientes (MFCC). In [5] pronunciation features and twelve MFCCs are implemented to detect articulation problems in 26 CLP patients, reporting success rates of 71.1% for vowels. On the other hand, the spectrum analysis has also been used for the automatic detection of hypernasality. In [6] an analysis considering group delay functions applied over the speech spectrum is presented and the reported results show accuracies of 100%, 88.15% and 80.25% for vowels /a/, /i/ and /u/, respectively. On the other hand, features extracted from nonlinear dynamics (NLD) techniques, have been employed successfully in the discrimination of different speech pathologies including hypernasality [4, 7]. Those results are supported in the fact that
[email protected]
there are evidence of nonlinear behavior in the speech production process, for instance, nonlinear pressure-flow relationship in the glottis or the nonlinear stress-strain relationship in the vocal fold tissues which is related to the velopharyngeal insufficiency [8], one of the functional problems associated to CLP. In [4], it is showed that the performance of NLD features is similar to the performance of the classical analysis and could be used to provide complementary information for the detection system. Besides, different entropy measures have been used for the automatic detection of pathological voices [7]. Bearing this in mind, this paper goes a step forward in the analysis of complexity features in the detection of hypernasal voices. The characterization is performed using four NLD measures and six different entropy measures taken from the reconstructed attractor. After, the most relevant features are selected using a features selection technique that is based on the Principal Component Analysis (PCA), and the decision about whether a voice record is hypernasal or healthy is taken by using a Support Vector Machine (SVM). Finally, with the aim of presenting the results in terms of clinical accepted concepts, they are reported in terms of specificity, sensitivity, accuracy and area under de receiver operating curve (AUROC). The rest of the paper is organized as follows: section 2 contains the description of the characterization process, section 3 presents the feature selection technique and the classification process, section 4 describes the experiments, section 5 contains the results, and section 6 presents the conclusions derived from this work.
2. Characterization stage The estimation of NLD features from time series requires the previous reconstruction of the space state which is based on the time-delay embedding theorem. This theorem establishes that where there is a single sampled quantity of a dynamical system, it is possible to reconstruct a state space that is equivalent or diffeomorphic to the original state space that is unknown. Points in the state space form trajectories, and a set of trajectories from a time series is known as attractor [9]. After the reconstruction of the attractor, two groups of features are estimated, one set includes correlation dimension (D2 ), Largest Lyapunov Exponent (λ1 ), Hurst exponent (H) and Lempel-Ziv complexity LZ. The other set includes approximate entropy (AE ), Gaussian kernel Approximate Entropy (GAE ), Sample Entropy (SE ), Gaussian Kernel Sample Entropy (GSE ), Recurrent Period Density Entropy (RP DE) and a measure derived from a Detrended Fluctuation Analysis (DF A) related to the self-similarity of a stochastic process.
2.1. Nonlinear dynamics
2.2. Entropy estimates
The Correlation Dimension is a measure of the space dimensionality occupied by the points in the reconstructed state space. In this work, (D2 ) is implemented according to the Takens estimator method [9]. The estimation requires the use of the correlation sum (C(r)), which is the number of possible pair of points closer than a given distance r in a particular norm. Intuitively, such sum can be thought as the probability of having pairs of points in specific regions of the attractor according to a sphere of radius r. In formal terms, it is defined as:
In general, entropy is a measure of the uncertainty of a random variable. The most common definition of entropy is the Shannon entropy, which is expressed as ∑ H(X) = − p(x) log p(x) (4)
C(r) =
N ∑
Cim (r)
(1)
i=1
x∈χ
where X is a random variable with alphabet χ and its probability mass function is p(x). When there is a stochastic process with a set of independent but not identically distributed variables, the rate at which the joint entropy grows with the number of variables n is given by
where, Cim (r)
N ∑ 2 = Θ (r − ∥⃗xi − ⃗ xj ∥) N (N − 1) j=i+1
H(X) = − lim
n→∞
(2)
N is the number of points in the state space, Θ the Heaviside function and (∥·∥) is a norm defined in any consistent metric space. D2 is defined theoretically for an infinity amount of data (N → ∞) and for small r, thus its general expression is written as: ∂ ln C (r, N ) (3) D2 = lim lim r→0 N →∞ ∂ ln (r) Another property of the nonlinear systems is its sensitivity to the initial conditions, which can be measured through the estimation of the Lyapunov spectrum. Theoretically, if a system has at least a positive Lyapunov exponent, the trajectories in state space will diverge exponentially. Therefore, the Largest Lyapunov exponent indicates weather or not such divergence exists. The estimation of the average divergence rate of neighbor trajectories in the state space, is calculated according to the Ronsenstein method [9]. In this algorithm, once again the nearest neighbors to every point in the trajectories must be estimated. In this case, a neighbor must fulfill a temporal separation greater than the “period” of the time series, to be considered as a nearest neighbor. It is possible to state that the separation of points in a trajectory is according to the expression d(t) = Ceλ1 t , where λ1 is the maximum Lyapunov exponent, d(t) is the average divergence taken at the time t, and C is a normalization constant. Assuming that the j − th pair of nearest neighbors approximately diverge at a rate of λ1 , it is possible to obtain the expression ln(dj (i)) = ln(Cj ) + λ1 (i∆t), where λ1 is the slope of the average line that appears when such expression is drawn on a logarithmic plane [9]. On the other hand, the randomness of the voice signals can be estimated with the Lempel-Ziv Complexity (LZ), according to the algorithm presented in [10]. The method consists in finding the number of different “patterns” present in a given time series. As the algorithm only considers binary strings; for the practical case, 0 is assign when the difference between two successive samples is negative, and 1 when such a difference is positive or null (see [10] for additional details). Finally, Hurst exponent (H) is calculated in order to estimate possible long term dependences in the voice recordings. Given a time series x(n) with n = 1, 2, ..., L, the estimation of H is based on the rank scaling method proposed by H. Hurst in [9]. Hurst demonstrated that the relation between the variation rank (R) of the signal, evaluated in a segment, and the standard = cT H , where c is a deviation of the signal S is given by R S scaling constant, T is the duration of the segment and H is the Hurst exponent.
n 1∑ H (Xi ) n i=1
(5)
For the case of a state space, it can be partitioned into hypercubes of content ϵm and observed at time intervals δ, defining the Kolmogorov-Sinai entropy (HKS ) as: HKS = − lim
δ→∞ ε→0 n→∞
1 nδ
∑
p (k1 , ..., kn ) log p (k1 , ..., kn )
k1 ,...,kn
(6) where p (k1 , ..., kn ) is the joint probability that the state of the system is in the hypercube k1 at the time t = δ, k2 at t = 2δ, etc. For stationary processes, it can be shown that HKS = lim lim lim (Hn+1 − Hn ). δ→0 ε→0 n→∞
Considering that in practical terms it is not possible to compute entropy for n → ∞, in the literature have been proposed different methods for approximating HKS . One of them is the Approximate entropy (AE ), which is designed for measuring the average conditional information generated by diverging points on a trajectory in the state space [11]. For fixed m and r, AE is estimated as in the equation 7 [ ] AE (m, r) = lim Φm+1 (r) − Φm (r) (7) N →∞
where Φm (r) =
1 N −m+1
N −m+1 ∑
ln Cim (r), and Cim (r) is de-
i=1
fined in the equation 2. The main drawback of AE is its dependence on the signal length due to the self comparison of points in the attractor. In order to overcome this problem, the sample entropy (SE ) was proposed. SE is defined as ) ( Γm+1 (r) (8) SE (m, r) = lim − ln m N →∞ Γ (r) The only difference between Γ and Φ is that the first does not evaluate the comparison of embedding vectors with themselves. Another modification of AE is the Gaussian kernel approximate entropy GAE . It takes advantage on the fact that Gaussian kernel function can be used to give greater weight to nearby points by replacing the Heaviside function by the following equation [12]. ( ( )) ∥⃗xi − ⃗xj ∥1 dG (⃗ xi , ⃗xj ) = exp − (9) 10r2 The same procedure of changing the distance measure can be applied to define the Gaussian kernel sample entropy GSE .
On the other hand, considering that the voice signal has two components [13], deterministic and stochastic, the deterministic component can be analyzed by means of the recurrence period density entropy (RP DE), consider a hypersphere of radius r > 0, containing a embedded data point ⃗ x(ti ). The time tr = tj − ti is the recurrence time, where tj is the instant at which the trajectory first returned to the same hypersphere. If R(t) is the normalized histogram of the recurrence times estimated for all embedded points into a reconstructed attractor, the RP DE can be defined as in the equation 10 [13] − RP DE =
tmax ∑
R(i) ln R(i)
i=1
ln tmax
(10)
where tmax is the maximum recurrence time in the attractor. Besides, the stochastic component of the voice signals can be analyzed by means of the detrended fluctuation analysis (DF A) to estimate the scaling exponent α in non-stationary time series as is indicated in [13].
entropy measures. Each feature set is divided following a bootstrapping strategy, using 70% of the data for training and the remaining 30% for validation. The same set of NLD features used in [4] is included in this work for the sake of comparison.
5. Results Table 1 shows the results obtained in the experiments with different feature sets and with the different phonations (vowels and words). It can be seen that the results with only NLD features are lower than in the cases where the entropy measures are included. As it is highlighted in table 1, for the vowels /a/, /i/ and /u/ the best results are obtained by combining NLD features and entropy measures. For vowels /e/ and /o/, entropy measures achieve similar results than NLD features. The results in the row labeled as Union are obtained considering the combination of the features in the highlighted rows of the table 1. It is clear that the combination of the best set of features per vowel yields an improvement in the performance of the system and it is due to the inclusion of information provided by the five vowels in the discrimination process. The use of the Spanish words /coco/
3. Feature Selection and Classification For feature selection process, a PCA-based algorithm is applied as in [14] and for the decision of whether a voice recording is hypernasal or healthy a Support Vector Machine (SVM) with a Gaussian kernel is implemented.
4. Experimental Setup 4.1. Databases This methodology is tested on two databases, the first one is provided by Grupo de Control y Procesamiento Digital de Se˜nales(GCyPDS) at Universidad Nacional de Colombia, Manizales. It contains 238 voice recordings from children between 5 and 15 years old, who uttered the Spanish vowels and the words /coco/ and /gato/. 108 of the children were labeled as healthy by a phoniatry expert, and the remaining 130 were labeled as hypernasal. All recordings were sampled at 48kHz with 16 bits of resolution. The second database is provided by Pattern Recognition Laboratory at the University of Erlangen-N¨urnberg. The dataset used here contains 468 voice recordings with German words uttered by children with CLP. 39 of the recordings were labeled by a phoniatry expert as hypernasal and the other 429 were labeled as belonging to other kind of pathologies derived from the CLP malformation. For this case, the signals were recorded at 16 kHz with 16 bits. 4.2. Experiments The signals are processed following a short-time procedure, and to have enough number of points for the reconstruction of the attractor, the window length is set at 55ms as in [7]. After characterization, the mean value and standard deviation is calculated for each feature vector ξi,k : i = 1, . . . N , and k = 1, . . . , L, where N is the number of voice recordings and L is the number of windows per voice register. Thus, the dataset is X ∈ RN×M , where M is the number of features considered in each experiment. Different combinations of the feature set are tested. First, only the NLD features are included (M = 8). Second, only the entropy measures (M = 12) and finally, the combination of the NLD and entropy measures is evaluated (M = 20). These different datasets are built to compare their performance and to analyze the impact of considering the information provided by the
Table 1: Classification results with the Spanish vowels. Vowel
Features SM NF Accuracy Sensitivity Specificity AUROC NLD PCA 7 81.13±5.36 83.44±6.76 79.23±8.33 0.87 NLD WS 8 82.39±4.94 81.56±5.97 83.08±6.64 0.88 /a/ Ent PCA 9 83.66±2.50 86.56±4.67 81.28±4.20 0.90 Ent WS 12 89.44±2.42 87.50±4.66 91.03±4.05 0.95 NLD+Ent PCA 14 88.31±3.58 88.13±5.47 88.46±4.56 0.93 NLD+Ent WS 20 90.56±1.76 89.39±3.36 91.54±2.43 0.96 NLD PCA 7 85.07±4.26 84.06±5.79 85.90±6.54 0.87 NLD WS 8 84.65±4.06 87.50±3.29 82.31±6.89 0.89 /e/ Ent PCA 7 88.31±3.05 91.88±4.22 85.38±2.97 0.95 Ent WS 12 88.87±3.95 93.13±6.88 85.38±5.14 0.95 NLD+Ent PCA 11 87.61±2.47 88.13±3.23 87.18±4.98 0.93 NLD+Ent WS 20 87.89±3.71 89.06±6.46 86.92±3.91 0.95 NLD PCA 6 81.69±4.20 82.50±9.22 81.03±5.30 0.87 NLD WS 8 87.46±2.77 90.00±4.37 85.38±5.28 0.91 /i/ Ent PCA 7 87.46±4.57 81.25±11.60 92.56±4.43 0.92 Ent WS 12 88.17±3.13 85.94±6.79 90.00±4.26 0.94 NLD+Ent PCA 13 85.77±5.53 84.38±4.42 86.92±8.75 0.94 NLD+Ent WS 20 89.86±3.03 88.44±4.67 91.03±4.40 0.95 NLD PCA 8 84.79±4.78 84.69±6.15 84.87±7.78 0.91 NLD WS 8 83.38±3.92 81.88±7.63 84.62±4.83 0.90 /o/ Ent PCA 8 84.23±4.39 84.38±6.91 84.10±6.82 0.91 Ent WS 12 87.32±2.39 85.00±6.56 89.23±5.10 0.93 NLD+Ent PCA 15 87.61±3.97 85.00±6.56 89.74±6.84 0.93 NLD+Ent WS 20 86.34±3.45 85.00±7.48 87.44±4.43 0.92 NLD PCA 8 82.11±4.65 83.44±4.67 81.03±6.64 0.87 NLD WS 8 82.11±4.93 79.06±7.80 84.62±4.98 0.85 /u/ Ent PCA 7 83.10±2.89 84.06±8.39 82.31±6.45 0.86 Ent WS 12 82.82±2.88 84.69±5.79 81.28±7.16 0.86 NLD+Ent PCA 14 82.68±2.82 81.25±5.10 83.85±6.05 0.86 NLD+Ent WS 20 83.80±2.59 84.06±4.98 83.59±3.67 0.88 N/A PCA 53 91.13±2.21 92.50±4.93 90.00±2.25 0.96 Union N/A WS 84 91.27±1.60 95.31±3.04 87.95±3.21 0.97 SM: Selection Method, WS: Without Selection, NF: Number of Features, N/A: Not applicable
and /gato/ is supported in the fact that both words have plosive and velar phonemes, and therefore they could be useful to evaluate the velopharyngeal competence in CLP patients [2]. The results showed in the table 2 indicate that it is possible to evaluate hypernasal voices by means of the analysis of this kind of words. Note that once again, the best results are obtained when both kind of measures are considered. Table 2: Classification results with the words /coco/ and /gato/. Vowel /coco/
/gato/
Features NLD NLD Ent Ent NLD+Ent NLD+Ent NLD NLD Ent Ent NLD+Ent NLD+Ent
SM PCA WS PCA WS PCA WS PCA WS PCA WS PCA WS
NF 6 8 7 12 15 20 6 8 6 12 12 20
Accuracy 77.14±6.17 79.71±8.57 78.57±6.06 81.43±5.43 83.14±6.09 82.29±5.84 82.86±5.71 81.71±4.89 84.29±8.86 84.29±4.31 85.71±5.22 86.00±4.75
Sensitivity 82.50±10.94 86.88±11.95 81.25±11.02 81.25±7.80 85.00±7.91 85.63±9.34 80.63±9.06 86.88±9.52 86.88±13.96 84.38±10.72 87.50±8.84 82.50±8.23
Specificity 72.63±11.58 73.68±11.64 76.32±7.94 81.58±9.69 81.58±9.69 79.47±13.69 84.74±10.94 77.37±10.83 82.11±9.99 84.21±8.95 84.21±8.95 88.95±8.02
AUROC 0.84 0.81 0.85 0.87 0.88 0.87 0.86 0.85 0.91 0.92 0.91 0.95
The results obtained with German words are presented in the table 3. It is important to say here that in this database all registers are from children with CLP, thus in this case the addressed issue is not to identify hypernasal form healthy voices but to identify hypernasality from other kind of voice pathologies suffered by CLP patients such as hyponasality, glottal stops, phonatory tension, among others. These results indicate that this methodology is also useful for the evaluation of German words and even that it can be used for the identification of hypernasality among other voice pathologies in CLP patients. Figure 1 shows the ROC curves obtained for the best results Table 3: Classification results with different German words. Vowel German words
Features NLD NLD Ent Ent NLD+Ent NLD+Ent
SM PCA WS PCA WS PCA WS
NF 7 8 6 12 13 20
Accuracy 75.12±7.85 76.20±7.91 75.25±9.61 73.64±8.68 80.08±6.88 80.66±8.18
Sensitivity 74.96±12.20 77.02±13.59 76.61±14.95 74.55±12.54 83.64±11.34 81.24±11.83
Specificity 75.29±12.01 75.37±11.44 73.88±14.31 72.73±11.20 76.53±11.04 80.08±11.84
AUROC 0.80 0.84 0.80 0.80 0.88 0.87
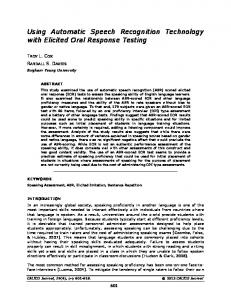
on each database (Spanish vowels, Spanish words and German words). For Spanish words, the best result corresponds to the word /gato/; it can be explained because, the pronunciation of that word requires to hold the velum up longer and needs to perform additional articulation movements of the tongue to the corrected anterior palatal fistula [15]. The discriminant capability of the methodology is illustrated in figure 2, which shows the cumulative distributions for the false scores (gray) and for the positive scores (black) in the evaluation of the Spanish vowel /a/.
Figure 1: ROC with the best results
1
−4
−2
0
2
4
6
8
10
0 12
Likelihood threshold
Figure 2: Likelihood threshold for the Spanish vowel /a/
6. Conclusions A characterization methodology based on the NLD features and entropy measures for the detection of hypernasal voices is presented. According to the results, entropy measures contribute
additional information to the one provided by NDL features. The method works properly in the evaluation of sustained vowels and also in Spanish and German words. In general, the accuracy levels and the confidence intervals are improved when the entropy measures are included in the characterization process.
7. Acknowledgements This research was carried out under Grants of “Convocatoria 528 para estudios de doctorado en Colombia, generaci´on del bicentenario, 2011” and also of “Comit´e para el Desarrollo de la Investigaci´on” (CODI), through the project MC11-1-03.
8. References [1] “Congenital malformations worldwide”. International Clearinghouse for Birth Defects Monitoring Systems, Amsterdam, Holland. Tech. Rep., 1991. [2] Rullo, R., Di Maggio, D., Festa, V.M. and Mazzarella, N., “Speech assessment in cleft palate patients: a descriptive study”, Int. J. of Pediatric otorhinolaryngology, 73(5):641-644, 2009. [3] Maier, A., Haderlein, T., Eysholdt, U., Rosanowski, F., Batliner, A., Schuster M. and N¨oth E., “PEAKS - A system for the automatic evaluation of voice and speech disorders”, Speech Communication, 51:425-437, 2009. ´ [4] Orozco-Arroyave, J.R., Murillo-Rend´on, S., Alvarez-Meza A., Arias-Londo˜no, J.D., Delgado-Trejos, E., Vargas-Bonilla, J.F. and Castellanos-Dom´ınguez, C.G., “Automatic selection of acoustic and non-linear dynamic features in voice signals for hypernasality detection”, Proc. of 14th INTERSPEECH, Florence, Italy, pp. 529-532, 2011. [5] Maier, A., H¨onig, F., Hacker C., Shuster M. and N¨oth E., “Automatic Evaluation of Characteristic Speech Disorders in Children with Cleft Lip and Palate”, Proc. of 11th INTERSPEECH, Brisbane, Australia, pp. 1757-1760, 2008. [6] Vijayalakshmi, P., Nagarajan, T. and Jayanthan Ra, V., “Selective pole modification-based technique for the analysis and detection of hypernasality”, Proc. of IEEE TENCON, pp. 1-5, 2009. [7] Arias-Londo˜no, J.D., Godino-Llorente, J.I., S´aenz-Lech´on, N., Osma-Ru´ız, V. and Castellanos-Dom´ınguez, G., “Automatic detection of pathological voices using complexity measures, noise parameters, and mel-cepstral coefficients”, IEEE Transactions on Biomedical Engineering, 58(2):370-379, 2011. [8] Birch, M.J. and Srodon, P.D., “Biomechanical Properties of the Human Soft Palate”, The Cleft Palate-Craniofacial Journal, 46(3):268-274, 2009. [9] Kantz H. and Schreiber T., “Nonlinear time series analysis”, 2nd ed. Cambridge, U.K: Cambridge University Press, 2004. [10] Kaspar, F., Shuster, H.G., “Easily calculable measure for complexity of spatiotemporal patterns”, Physical Review A, 36(2): 842–848, 1987. [11] Costa, M., Goldberger, A. and Peng, C. “Multiscale entropy analysis of biological signals”, Physical Review E, 71:1-18, 2005. [12] Xu, L.S., Wang, K.Q. and Wang, L., “Gaussian kernel approximate entropy algorithm for analyzing irregularity of time series”, Proc. of the International Conference on Machine Learning and Cybernetics, pp. 5605–5608, 2005. [13] Little, M.A., McSharry, P.E., Roberts, S.J., Costello, D.E. and Moroz, I.M., “Exploiting nonlinear recurrence and fractal scaling properties for voice disorder detection”, Biomedical Engineering Online, 6(23): 1-19, 2007. [14] Daza-Santacoloma, G., Arias-Londo˜no, J.D., Godino-Llorente, J.I., S´aenz-Lech´on, N., Osma-Ru´ız, V. and CastellanosDom´ınguez, G., “Dynamic feature extraction: An application to voice pathology detection”, Intelligent Automation and Soft Computing., 15(4):665-680, 2009. [15] K.L. Moll and R.G. Daniloff, “Investigation of the timing of velar movements during speech”, Journal of the Acoustical Society of America, 50(2): 678-684, 1971.