Recognition` from many years, it has become one of the most prominent part of modern technological systems. Thus, ... cepstrum based pitch detection algorithms [7], the V-U decision is taken based on the amplitude of largest peak in the.
Volume 4, Issue 4, April 2014
ISSN: 2277 128X
International Journal of Advanced Research in Computer Science and Software Engineering Research Paper Available online at: www.ijarcsse.com
SUV Detection Algorithm for Speech Signals Agnel Waghela1, Rohan Reddy2, Shivangi Rai3, Aditya Pawar4, Namrata Gharat5 1-4 BE Student, Electronics and Telecommunication Department 5 Faculty of Electronics and Telecommunication Department K.J. Somaiya Institute of Engineering and Information Technology, Sion, Mumbai, India Abstract— One of the most influential device in human lives is the `Computer`. The usage of computers is increasing exponentially in every other field existing on this earth. No doubt it simplifies the way we handle data. It also helps in easily exchanging information among humans, with everyday new technologies coming up for making the sharing of data more and more easy. But it does require some input when an interface is utilized to transfer data. Currently most common form of input provided is touch or by mouse and keyboard. With pioneering research in `Speech Recognition` from many years, it has become one of the most prominent part of modern technological systems. Thus, `Speech` is also considered as an input to computer, making it a natural and faster way of providing input to computers. A high degree of accuracy is required for good speech recognition system. The predominant problems faced are silence detection and removal, voiced unvoiced distinguishing, detection of word boundary, noise removal. This paper discusses the implementation of an algorithm which automatically detects the silence, voiced and unvoiced parts of a speech signal, which can drastically improve the accuracy of a speech recognition system. The algorithm is based on three important characteristics of a speech Signal – Zero Crossing Rate, Short Time Energy and Fundamental Frequency. Keywords— Short Time Energy, Zero Crossing Rate, Spectrum Tilt, SUV detection algorithm, SUVDA I. INTRODUCTION The NEED for deciding whether a given speech signal should be classified or segmented as voiced part, unvoiced part or silence (considered as absence of speech) arises in many speech analysis systems. A broad variety of approaches have been described in speech literature to make the approximate decision [1] – [6]. Most of the times the decision of voicedunvoiced (V-U) usually made along with analysis of pitch of the speech segment. For example, in the well-known cepstrum based pitch detection algorithms [7], the V-U decision is taken based on the amplitude of largest peak in the computed cepstrum. In actual practice, some additional features are required which must be included in the designed decision procedure. Because no one parameter obtained from the speech signal can accurately contribute in making the approximate but close to ideal decision for the segmentation of the speech signal. In this paper, we are describing a method which uses number of speech derived measurements for classifying a given speech segment into three classes: silence, voiced segment and unvoiced segment (SUV). The SUV detection approach provides an effective method of combining the individual contributions of each measurements—which individually may not be enough to distinguish between the three classes—into a single output capable of providing reliable separation between each of the three classes. Then, based on the measurements and standard facts for each of the classes the discrimination is done. A SUV detection algorithm (SUVDA) is designed to automatically generate an output which contains individual flag values for each of the three classes. For example, the output signal generated by SUVDA will contain 0.1 corresponding to a sample value which is classified as silence and 0.2 for unvoiced, while 0.3 for voiced sample. Thus, the final output shall contain a constant signal which has the above amplitudes based on the class of the speech segment. The SUVDA takes into account three features namely – Zero Crossing Rate, Short Time Energy, Spectrum Tilt Contour. Each of these three features are computed individually by using the windowing technique. II. PREPROCESSING STEP This step serves various purposes in any speech processing application. It includes noise removal, pre-emphasis, windowing, framing etc. Only windowing and framing was needed for classification of speech as recording was done in silence or very little background noise. A. Windowing and Framing Speech is very variable in nature but when studied over a short duration of time it has characteristics which are similar. Hence instead of working on a whole signal, it is divided into frames which is known as segmentation. Some times after segmentation it is possible that part of the signal feature is in one frame and remaining in the next. To avoid this problem the signal is divided with some overlapping of samples to minimize the distortion. Such a process is called as windowing [14]. © 2013, IJARCSSE All Rights Reserved
Page | 958
Agnel et al., International Journal of Advanced Research in Computer Science and Software Engineering 4 (4), April - 2014, pp. 958-963 There are different types of windows which are used for speech processing. Some of these windows are Rectangular window, Bartlett window, Hamming window etc. The most widely used for speech processing is hamming window as it introduces least amount of distortion. III. FEATURE EXTRACTION In feature extraction, the speech signal is converted in feature vectors containing only the information that is needed for the classification purpose. There are two types of features. First, the temporal features, which are simple to extract with physical interpretation like the energy of signal, zero crossing rate, maximum amplitude, minimum energy, etc. Second, the spectral features, are the ones obtained by converting into frequency domain like fundamental frequency, spectrum tilt or pitch detection and estimation using cepstrum [9]. For this algorithm only temporal features were used. There are some algorithm which make use of both spectral as well as temporal features [8]. A. Zero Crossing Rate The zero crossing rate is the measure of the number of times in given time interval or frame that the amplitude of speech signal passes through a value of zero. In the context of discrete-time signals, a zero crossing is said to occur if successive samples have different algebraic signs [10]. In mathematical terms short time zero crossing rate can be defined as the weighted average of the number of times the speech signal changes sign within the time window [Rabiner and Schafer 2007]. ∞
𝑍𝑛 =
0.5 𝑠𝑔𝑛 𝑥 𝑚 − 𝑠𝑔𝑛 𝑥 𝑚 − 1
𝑤 𝑛−𝑚
𝑚 =−∞
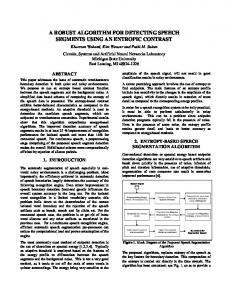
Where 1 𝑥≥0 −1 𝑥 < 0 Since 0.5|sgn{x[m]} – sgn{x[m-1]}| is equal to 1 if x[m] and x[m–1] have different algebraic signs and 0 if they have the same sign and, it follows that Zn is a weighted sum of all the instances of altering sign that fall within the support region of the shifted window w[𝑛–m]. Figure 1 shows the plot of the original speech signal of word ‗Edition‘ spoken by Male Speaker M1 and corresponding plot of the Short Time Zero Crossing Rate. 𝑠𝑔𝑛 𝑥 =
Fig 1. Short Time Zero Crossing Rate of word ‗Edition‘ B. Short Time Energy The amplitude of the Speech signal varies over time. The energy of speech signal provides us a representation which reflects these amplitude variations. For a discrete-time signal x[n], the short time energy measure at a sample n is defined as 𝑛
𝐸𝑛 =
(𝑥[𝑚])2
𝑚 =𝑛−𝑁+1
Since Speech signal is highly variable in nature and is assumed to have stationary properties only within short time frame so short time energy is calculated after windowing. So the definition modifies as ∞
𝐸𝑛 =
(𝑥[𝑚]𝑤[𝑛 − 𝑚])2
𝑚 =−∞
Here n lies between zero and N-1 where N is length of the window. Figure 2 shows the plot of the original speech signal of the word ‗Edition‘ spoken by Male Speaker M1, and the corresponding plot of the Short Time Energy. © 2013, IJARCSSE All Rights Reserved
Page | 959
Agnel et al., International Journal of Advanced Research in Computer Science and Software Engineering 4 (4), April - 2014, pp. 958-963
Fig 2. Short Time Energy plot of word ‗Edition‘ C. Spectrum Tilt Voiced segments have high Energy in low frequency and unvoiced segments have high energy in high frequency. The result is opposite Spectrum Tilts. The spectrum tilt can be represented by the first order autocorrelation or first reflection coefficient given by following equation: 𝑁 𝑖=1 𝑠 𝑖 𝑠(𝑖 − 1) 𝑆𝑡 = 2 𝑖=1 𝑠 (𝑖)
Plot of the Spectrum tilt for the word ‗Edition‘. Fig 4. It is seen that for most of the speech signals, when a smoothing filter (median filter was used) is applied on the spectrum tilt, the spectrum tilt of the voiced region has a value of close to 1 as shown in Figure 3, whereas the spectrum tilt of the unvoiced region has a value less than 0.7. Thus, a threshold of 0.7 was set for the classification of voiced regions properly [13]. IV. DYNAMIC THRESHOLD COMPUTATION For the classification purpose some threshold needs to be set. If the threshold value was set to some static value then it was observed that the energy of the voiced region was well above it, but in some cases the energy of the unvoiced region was also above it. Hence the threshold value was calculated dynamically to the speech data [12]. For calculating the threshold value after getting the feature vector of the energy following process was carried out: Compute the histogram of the feature sequence‘s values Detect the histogram‘s local maxima. Let M1 and M2 be the position of the 1 st and 2nd local maxima respectively. The threshold value is computed using the following equation: Fig 3.
© 2013, IJARCSSE All Rights Reserved
Page | 960
Agnel et al., International Journal of Advanced Research in Computer Science and Software Engineering 4 (4), April - 2014, pp. 958-963 𝑊. 𝑀1 + 𝑀2 𝑇= 𝑊+1 Where W is a user-defined parameter. Large values of W obviously lead to threshold values closer to 𝑀1 . The computed threshold is named as ‗T_STE‘ for representing the threshold for the feature vector of Short Time Energy. V. ALGORITHM DESCRIPTION For most of the signals it was observed that the zero crossing rate for the silence region was around 0.05 and for unvoiced region it much higher, hence this was considered to be threshold ‗T_ZCR‘ corresponding to the Zero Crossing Rate feature vector for classification purpose. In some cases, the zero crossing rate of the unvoiced region was less due to constant background noise. Hence, zero crossing alone could not be used for the classification purpose. The energy of voiced region is always higher than the silence and unvoiced region, whereas the energy of the unvoiced region is less than voiced region but greater than silence region. Hence possibility of having errors due to the zero crossing rate is solved using short time energy for the purpose of classification. There are some methods which only used zero crossing rate and short time energy for classification [11]. Sometimes the energy of the unvoiced region also rises enough which is above the threshold to be declared as voiced region. To avoid this problem Spectrum tilt was used, which clearly showed that the Spectrum tilt of the unvoiced region was always below 0.7. Thus it was now possible to identify clearly all the three regions. After analysing the features obtained from the speech signal, the SUVDA was designed as follows: 1. Store the sound file in the vector y(n), where n is the length of the speech signal. 2. Compute the feature vectors — Zero Crossing Rate store as ZCR(n), Short Time Energy as STE(n), Spectrum Tilt as ST(n). 3. Compute the Dynamic threshold T_STE for the feature vector Short Time Energy. 4. Mapping of the feature vectors to the length of the original signal. 5. Now if the ZCR at n-th sample was lesser than T_ZCR and STE > T_STE and ST > 0.7 then the sample was declared as ‗silence‘ sample. 6. If the ZCR > T_ZCR and STE > T_STE and ST < 0.7 then it was declared as ‗unvoiced‘ sample. 7. If either of the above two conditions fail then the sample is ‗voiced‘ sample. 8. Finally, an output vector is created which contains three flag values corresponding to each of the three classes. Figure 4 shows the flowchart of the proposed SUVDA.
Fig 5. © 2013, IJARCSSE All Rights Reserved
Flowchart of SUVDA
Page | 961
Agnel et al., International Journal of Advanced Research in Computer Science and Software Engineering 4 (4), April - 2014, pp. 958-963 VI. RESULTS The final output will contain a step signal which exhibits three different amplitudes corresponding to the three classes. The final output will contain a constant value for a particular region of the speech signal. Hence, the region of the one class can be segmented out and stored. Then the segment can be further used for processing by any recognition system as and when required at ease. Figure 5 shows the final output mapped on to the original signal with clear distinction of the three classes using the user–defined flag value. The accuracy of the algorithm was found out for three different users on 6 English and 4 Hindi words. Out of which two were male speakers and the third was a female speaker. The accuracy was computed for 10 words each of which were recorded thrice. The following table shows the overall accuracy obtained for each speaker. TABLE I. Accuracy Table for each Speaker and Overall Accuracy of the Algorithm Words % % % Spoken Accuracy Accuracy Accuracy 1st Speaker 2nd Speaker 3rd Speaker ―Short‖ 95.23 97.85 98.57 ―Sip‖ 98.16 96.12 98.20 ―Please‖ 96.04 98.06 98.73 ―Father‖ 96.42 94.28 94.29 ―Nation‖ 96.86 96.85 98.56 ―Place 97.84 97.38 97.84 ―Fish‖ 95.42 97.26 93.73 ―Om‖ 95.11 97.32 97.44 ―Kalam‖ 98.23 93.38 95.61 ―Saat‖ 97.53 96.58 95.72 Overall 96.68 96.51 96.87 Accuracy Average 96.6867 Accuracy The Final output for the word ‗Edition‘ generated by the algorithm is as shown below in the Figure 5.
Fig 6.
The Final Output of the Algorithm
VII. CONCLUSIONS The use of three parameters has enabled us to make a better decision in the classification of the three classes. Since, any one parameters did not give proper classification between silence, unvoiced and voiced. The algorithm in itself being simple, yields good results than the more complicated methods. Fairly any set of measurements or methods can be used for the classification purpose as long there is some physical basis for reliable classification. The main limitation of the SUV detection algorithm is when a signal is affected by noise, the ability of proper detection as it does in noise-free signals, reduces. Thus, to improve the efficiency of the algorithm some quality noise removal algorithms or enhancement algorithms can be used. ACKNOWLEDGMENT Thank you Prof. Namrata Gharat for guiding throughout the project. Thank you Prof. Jayashree Khanapuri for helping with the concepts and the implementation. REFERENCES [1] K. Abdullah-Al-Mamun, F. Sarker and G. Muhammad, ―A High Resolution Pitch detection algorithm based on AMDF and ACF,‖ J. Sci. Res. 1(3), 508-515 August 2009. [2] Mojtaba Radmard, Mahdi Hadavi and Mohammad Mahdi Nayebi, ―A new method of Voiced/Unvoiced Classification based on clustering,‖ in JSIP, vol. 2, 336-347, October 2011. [3] Bishnu S. Atal and Lawerence R. Rabiner, ―A Pattern recognition approach to Voiced-Unvoiced-Silence Classification with Applications to Speech Recognition,‖ in IEEE Trans., Acoustics, Speech, Signal Processing, vol. ASSP-24, no. 3, June 1976. [4] M. M. Sondhi, ―New methods of pitch extraction,‖ IEEE Trans. Audio Electroacoust., vol. AU-16, pp. 262-22, June 1968. © 2013, IJARCSSE All Rights Reserved
Page | 962
[5] [6]
[7] [8] [9] [10]
[11]
[12]
[13] [14]
Agnel et al., International Journal of Advanced Research in Computer Science and Software Engineering 4 (4), April - 2014, pp. 958-963 J. D. Markel, ―The SIFT algorithm for fundamental frequency estimation,‖ IEEE Trans. Audio Electroacoust., vol. AU-20, pp. 367-377, Dec. 1972. Etan Fisher, Joseph Tabrikian and Shlomo Dubnov, ―Generalized likelihood Ratio Test for Voiced-Unvoiced decision in noisy speech using the harmonic model,‖ in IEEE Trans. Audio, Speech and Lang. Processing, vol. 14, no. 2, Mar. 2006. A. M. Noll, ―Cepstrum pitch determination,‖ Journal of Acoustic Society Amer., vol. 41, pp. 293-309, Feb 1967. Stephen A. Zahorian, Princy Dikshit and Hongbing Hu, ―A Spectral-Temporal method for Pitch Tracking,‖ in INTERSPEECH, ICSLP, pp. 1710-1713, 2006. R. W. Schafer and L. R. Rabiner, ―System for Automatic Formant Analysis of Voiced Speech,‖ in Journal of Acoustic Society Amer., vol. 47, pp. 634-648, 1970. Bachu R. G., Kopparthi S., Adapa B., Barkana B. D., ―Separation Of Voiced And Unvoiced Using Zero Crossing Rate And Energy Of The Speech Signal,‖ in American Society for Engineering Education (ASEE) Zone Conference Proceedings, 2008, pp. 1-7. D. S. Shete, S. B. Patil and S.B. Patil, ―Zero crossing rate and Energy of the Speech Signal of Devanagari Script,‖ in IOSR Journal of VLSI and Signal Processing, vol. 4, issue 1, ver. I, pp. 01-05, e-ISSN: 2319-4200, p-ISSN: 2319-4197, Jan. 2014. Theodoros Giannakopoulos, ―A Method for Silence Removal and Segmentation Of Speech Signals, Implemented In Matlab,‖ Department of Informatics and Telecommunications University of Athens, Greece, 2009. Software available at https://www. mathworks.com/matlabcentral/fileexchange/28826-silence-removal-in-speech-signals. Shaila D. Apte, ―Speech and Audio Processing,‖ edition 2007. Gupta, R, 2006. Speech Recognition for Hindi, M. Tech Thesis, Dept. Computer Science and Eng. IIT Bombay, Bombay
© 2013, IJARCSSE All Rights Reserved
Page | 963