Zuccon et al. Health Information Science and Systems 2015, 3(Suppl 1):S4 http://www.hissjournal.com/content/3/S1/S4
RESEARCH
Open Access
Automatic detection of tweets reporting cases of influenza like illnesses in Australia Guido Zuccon1,2*, Sankalp Khanna2, Anthony Nguyen2, Justin Boyle2, Matthew Hamlet2, Mark Cameron3 From HISA Big Data in Biomedicine and Healthcare 2013 Conference Melbourne, Australia. 18-19 April 2013
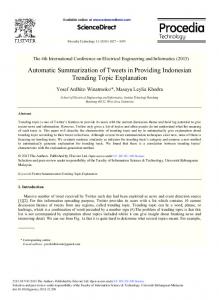
Abstract Early detection of disease outbreaks is critical for disease spread control and management. In this work we investigate the suitability of statistical machine learning approaches to automatically detect Twitter messages (tweets) that are likely to report cases of possible influenza like illnesses (ILI). Empirical results obtained on a large set of tweets originating from the state of Victoria, Australia, in a 3.5 month period show evidence that machine learning classifiers are effective in identifying tweets that mention possible cases of ILI (up to 0.736 F-measure, i.e. the harmonic mean of precision and recall), regardless of the specific technique implemented by the classifier investigated in the study. Introduction Early detection of disease outbreaks is a crucial capability for hospitals and public health officials to effectively allocate resources to control the spread of diseases and treat affected patients [1,2]. In Australia, state agencies keep track of the number of patients tested positive for influenza and influenza like illnesses (ILI). National initiatives attempt to obtain timely reporting through measures such as the Australian Sentinel Practices Research Network (ASPREN) (http://www.aspren.com. au/, last visited October 13, 2014), the National Health Call Centre Network (http://www.health.gov.au/internet/ main/publishing.nsf/Content/national-health-call-centrenetwork-team-overview, last visited October 13, 2014) and community level surveillance through FluTracking (http://www.flutracking.net/, last visited October 13, 2014). These systems, although enlarging the population base that is monitored, suffer poor participation rates [3] and high costs. Figure 1 outlines the disease prevalence pyramid, where the width of each layer represents the population size involved or monitored. The benefits of expanding the data sources used to produce disease outbreak notifications to * Correspondence:
[email protected] 1 Information Systems School, Queensland University of Technology, Brisbane, Australia Full list of author information is available at the end of the article
web data and social media [4], in particular Twitter, are numerous. The data is publicly available, its access cost is low, the participation rate is high (http://www.nielsen. com/us/en/insights/news/2010/australia-getting-moresocial-online-as-facebook-leads-and-twitter-grows.html, last visited October 13, 2014) and the user base is generally broad, although not uniform with respect to age groups and geographic areas. By leveraging information published in Twitter, real time reporting across a large fraction of the population may be possible. Previous studies that monitored Twitter in the US [5] and UK [6,7] have found that it is possible to produce highly correlated predictions for influenza-affected patients from the use of Twitter alone. However, the use of Twitter is not without its problems. The volume of tweets is exceedingly large, with users producing over 200 million tweets per day globally as of mid 2011 (http://blog. twitter.com/2011/06/200-million-tweets-per-day.html, last visited October 13, 2014). The content of a message is highly condensed and often expressed differently than natural language due to the size limitation of a tweet (140 characters). To render the data useful for predictions, it must be collected and analysed in real time, and its manual processing may not be timely nor cost efficient. This necessitates an automatic system that can classify tweets reporting influenza cases with high accuracy. Previous work by Collier and Doan [8] has shown evidence
© 2015 Zuccon et al.; licensee BioMed Central Ltd. This is an Open Access article distributed under the terms of the Creative Commons Attribution License (http://creativecommons.org/licenses/by/4.0), which permits unrestricted use, distribution, and reproduction in any medium, provided the original work is properly cited. The Creative Commons Public Domain Dedication waiver (http:// creativecommons.org/publicdomain/zero/1.0/) applies to the data made available in this article, unless otherwise stated.
Zuccon et al. Health Information Science and Systems 2015, 3(Suppl 1):S4 http://www.hissjournal.com/content/3/S1/S4
Page 2 of 10
Figure 1 Disease prevalence pyramid and notification data sources; dotted line is proposed. Adapted from [10].
that Naive Bayes (NB) and Support Vector Machine (SVM) classifiers, informed by a limited set of textual features created by extracting only terms contained in an health ontology, were able to classify tweets with respect to common syndromic categories. This paper presents a study of detecting mentions of influenza from Twitter messages originating from Victoria, Australia, which is characterised by a smaller and more geographically diverse population (higher population density and high-speed/large-bandwidth internet access in metropolitan areas, and low population density and lowspeed/small-bandwidth internet access in rural and regional areas) than those studied in previous work. The paper reports a thorough evaluation of an array of machine learning approaches for identifying Twitter messages that may indicate cases of ILI. Correlation with confirmed influenza cases was not within the scope of this work. Investigated methods go beyond the two popular classifiers tested previously by others, i.e. Naive Bayes and Support Vector Machine, expanding the analysis to other learning approaches such as decision trees (C4.5/J4.8, Random Forests, Logistic Model Trees), and perceptrons and regression models (Voted Perceptron, Linear Logistic regression, Multinomial Logistic Regression). The results suggest that machine learning techniques are able to discriminate among tweets containing mentions of influenza or relevant symptoms and irrelevant messages. In addition, our experiments show that SVM classifiers do not always return the highest performance, and alternative approaches (e.g. Multinomial Logistic Regression and Random Forests) return
higher performance under specific settings. However, the results also reveal that there is only limited differences in performance across the different types of classifiers. This suggests that future research efforts on the detection of influenza related tweets should be directed beyond improving machine learning techniques, in particular addressing how disease outbreak monitoring systems should cope with false positive notifications produced by the proposed automatic methods, as well as true influenza mentions that are not captured (i.e. false negatives).
Collection of Twitter messages and manual assessment We obtained tweets posted in a 3.5 month period (May to August 2011), corresponding to the peak Australian flu season, all of which originated from users based in Victoria. This amounted to just over 13.5 million tweets. The tweets were captured using the ESA-AWTM architecture [9] that leverages the Twitter API, incorporating other services such as Yahoo! and Google maps to add extra metadata (e.g. location data). Initial analysis of these tweets revealed that around 0.1-0.2% of all 13.5 million tweets reported influenza cases [10]. In order to retain a significant amount of positive influenza reporting tweets from our data to train a classifier, but still be able to efficiently deploy computational methods, the Twitter stream was filtered to store only messages that contained keywords (and their derivatives) that may indicate cases of influenza. These keywords are listed in Table 1 and were selected by considering typical influenza symptoms as well
Zuccon et al. Health Information Science and Systems 2015, 3(Suppl 1):S4 http://www.hissjournal.com/content/3/S1/S4
Page 3 of 10
Table 1 Keywords that may indicate or exclude cases of influenza (a) Included keywords. flu
sick
headache
fever
unwell
chills
antibiotics
ache
cough
throat
cold
doctor
fatigued
tissues
stomach
runny
sneeze
pneumonia
down with
vomit
snot
influenza
Stuffy
tylenol
diarrhea
nausea
vicks
shivering
(b) Excluded keywords. doctor who
jab
vaccine
shot
pandemic
fully sick
weather
Bieber
sick of
as extending the keywords reported in previous research (e.g. Sadilek et al. [11] and Signorini et al. [12]). Note that re-tweets were removed. The application of this filtering process retained approximately 100,000 messages that were potentially influenza-related (0.75% of the initial data). From these approximately 100,000 tweets, a set of 10,483 tweets was randomly selected for manual classification to assess their likelihood of reporting a case of influenza. Seventeen volunteer assessors from The Australian e-Health Research Centre, CSIRO were asked to use a scale of 0-100 to select how likely they thought a tweet was representative of the user reporting a case of influenza (either with themselves or in others): 0 being no flu, 100 being certain of a flu. Figure 2 presents the results of this manual classification. The majority of filtered tweets (78.12%) were assessed as not related to ILI, although interestingly, 6.49% of tweets were assessed as certainly related to ILI. In addition, 363 tweets, from the set of those that were manually classified, were assessed by multiple volunteers (three classifications per tweet on average), as an effort to measure inter-assessor agreement. The average standard deviation between the scores of tweets with multiple assessors was 4.89, indicating that the classification labels assigned by different assessors were comparable. Shorter tweets did have a higher standard
deviation on average, as might be expected given that they contain less information. However, the differences between their scores were not judged large enough to require them to be treated differently. If a tweet was reviewed by more than one assessor, its average score was used for the remainder of the analysis.
Automatic flu classification: statistical machine learning classifiers Problem definition
The problem of detecting ILI-related Twitter messages is casted into a binary classification problem: classify a tweet as being ILI-related or not. The collected ground truth indicates the likelihood of a tweet to be ILIrelated as a percentile score (i.e. between 0 and 100). Percentile scores were transformed into binary classes according to a threshold th which “defines an influenza related tweet”. We refer to “definition of influenza related tweet” as the process of collapsing percentile scores assigned to tweets into a binary classification (i.e. ILI-related or not). Thus a “loose definition” corresponds to considering as influenzarelated also tweets that have been assigned a relatively low score (e.g. 50). A “strict definition” instead corresponds to considering as influenza-related only tweets assigned with a high score (e.g. 100). Classifiers
The machine learning classification methods evaluated in this study for the task of identifying influenzarelated tweets are listed below. We investigated classifiers from three wide families of machine learning approaches, namely linear classifiers, support vector machines and decision trees. The corresponding Weka version 3.6.7 [13] implementations of these classifiers were used in the empirical experiments. Linear classifiers
Figure 2 Manually classified tweets, bucketed by likelihood of influenza or ILI score.
• standard Naive Bayes classifier. • Linear logistic regression classifier (SimpleLogistic in Weka). • multinomial logistic regression classifier with ridge estimator [14] (Logistic in Weka).
Zuccon et al. Health Information Science and Systems 2015, 3(Suppl 1):S4 http://www.hissjournal.com/content/3/S1/S4
• Voted Perceptron which takes advantage of data that is linearly separable with large margins. Support Vector Machine (SVM) classifiers
• Support Vector Machine (SMO in Weka) that uses a polynomial kernel and the sequential minimal optimization algorithm by Platt [15]. • Support Vector Machine (SPegasos in Weka) that uses a linear kernel and a stochastic variant of the primal estimated sub-gradient solver method by Shalev-Shwartz et al. [16].
Decision trees
• C4.5 Decision Tree learner (J48 in Weka) that builds a decision tree based on information entropy as measured on training data. • Random Forest, an ensemble classifier method that constructs multiple decision trees during the training phase. • Logistic model trees classifier (LMT in weka) where logistic regression functions are used at the leaves of the tree.
Details of the classification approaches and their implementation can be found in the Weka documentation; standard settings were used as defined in the software package. Features
The Medtex text analysis software [17] was used to extract features from the free-text of Twitter messages. Medtex is a medical text analysis platform that has been used in previous studies on cancer reporting [18-20], radiology reconciliation [21], and medical information retrieval [22]. Medtex architecture is characterised by a messaging framework built on the concept of message queues, producers (senders), and consumers (receivers). Because multiple message consumers can be set up in parallel to receive messages from the same queue, Medtex provides high text analysis throughput, making it an ideal framework for analysing large streams of Twitter data. While some of the specific clinical text analytic capabilities of Medtex were not used in this study (e.g. SNOMED CT and UMLS concept extraction), we extended the platform to include information extraction capabilities for specific entities that are present in Twitter messages, such as the presence of Twitter usernames (e.g. @Username), hash-tags indicating specific topics (e.g. #Topic), and emoticons (e.g. :-) and ;(). The features extracted from tweets using the Medtex software include:
Page 4 of 10
• word token n-grams: a continuous sequence of n word tokens in a tweet; we extracted both bi-grams and tri-grams (n = 2 and n = 3); • binary feature representing the presence of a http:// token, identifying that the tweet contains a link to a web page; • binary feature representing the presence of the token @ followed by a sequence of characters, identifying that the tweet has been directed to a Twitter user or presents a mention of that user; • binary feature representing the presence of hashtags, i.e. tokens that start with the symbol # used to mark keywords or topics in a tweet; • binary feature that represents the presence of a positive (negative) emoticon, i.e. a metacommunicative pictorial representation of a facial expression that conveys a positive emotion like happy, love, etc. (a list of positive and negative emoticons is given in Table 2); A total of 26,698 unique features formed the feature vocabulary for the entire set of annotated tweets used in the experiments reported in this article.
Experimental settings To evaluate the effectiveness of the machine learning approaches investigated in this article, we set up an evaluation framework that consisted of a first set of experiments using the 10-fold cross-validation methodology and a subsequent set of experiments where the classification models learnt in the cross-fold experiments were validated on unseen data (i.e. data not used for creating the models). To this aim, we first constructed a balanced dataset for cross-validation experiments, that contained an equal number of positive (influenza-related) and negative (not influenza-related) instances. Specifically, the dataset contained 90% of the positive instances (i.e. tweets that had been annotated as being influenzarelated) and an equal amount of negative instances. These instances were randomly sampled from the respective classes. This dataset was subsequently randomly partitioned in 10 folds, and for each iteration of the cross-validation algorithm a Table 2 List of emoticons associated with positive and negative emotions Emoticons Positive Emotions
• word tokens: strings identified by word boundaries such as white spaces and punctuation; • word stems: the root stems of the word tokens (if available); stems were extracted using the Porter stemmer algorithm [23];
Negative Emotions
:) :=) :-) :D :=D :-D :d :=d :-d 8) 8=) 8-) B) B=) B-) :o :=o :-o :O :=O :-O :* :=* :-* :P :=P :-P :p :=p :-p :$ :-$ :=$ :\"> ]:) >:) 8-| B-| 8| B| 8=| B=| :x :-x :X :-X :# :-# :=x :=X :=# :? :-? :=? :( :=( :-( ;( ;-( ;=( (:| :| :=| :-| :^) |-) I-) I=) |( |-( |=( |-() :& :-& :=& :@ :-@ :=@ x( x-( x=( X( X-( X=( :S :-S :=S :s :-s :=s
Zuccon et al. Health Information Science and Systems 2015, 3(Suppl 1):S4 http://www.hissjournal.com/content/3/S1/S4
unique combination of 9 folds were used for learning a classification model and the excluded one was used for testing the obtained model. A second dataset was then formed by combining the remaining 10% of positive instances with the remaining amount of negative instances: this dataset was used to validate on unseen data the models learnt through cross-validation. The described procedure was iterated for each ‘likelihood of influenza score’ threshold level (th), i.e. datasets were constructed for each threshold value: datasets varied in size across threshold values, due to the difference in number of positive instances when considering strict (e.g. th = 99) or relaxed (e.g. th = 49) thresholds for defining an influenza-related tweet. The use of unseen data to validate the models created using n-fold cross validation further reduces risks that the obtained results are due to over-fitting.
Classification effectiveness Effectiveness on 10-fold cross validation
Precision and recall values obtained by the studied classifiers in the 10-fold cross-validation experiments and with different threshold values th are detailed in Table 3 and the F-measure values are plotted in Figure 3. The F-measure summarises the precision-recall evaluation, being a balanced average of the two measures. Because the dataset used for the cross-validation experiments is balanced (same number of positive and negative instances), the two target classes (i.e. influenza and notinfluenza) have equal importance. A majority class classifier then would achieve a maximum of 0.5 precision/ recall/F-measure value. The confusion matrices for each setting of classifier and threshold value are reported in Table 4. Figure 3 suggests that overall, all classifiers achieve better performance when a loose definition of influenza related tweets is used, i.e. when 49 ≤ th ≤ 74, with the
Page 5 of 10
best F-measure value achieved by multinomial logistic regression classifier (Logistic, 0.736 F-measure at th = 59). When stricter threshold values are used, then the F-measures of all classifiers decrease, this decrement occurring somewhere in the interval of threshold values between 74 and 84, with F-measures being overall stable between 84 and 99. The values of precision and recall (Table 3) report a similar finding, although losses in performance are different across precision and recall for different classifiers. For example, the Random Forests classifier exhibits a higher loss in precision than that in recall when passing from a threshold value of 49 to 99. Conversely, the Naive Bayes classifiers exhibits similar losses in performance across both precision and recall when considering threshold values of 49 and 99. Figure 3 confirms findings of previous studies, that Support Vector Machine approaches are generally better than Naive Bayes in determining if a tweet is reporting ILI cases, e.g. [8]. However, our study reports on the performance of a wider range of classifiers. The empirical results show that there are a number of classifiers that guarantee performance that are usually bounded by those of SVMs and Naive Bayes, and exceed SVMs performance in specific circumstances. For example, while the multinomial logistic regression classifier (Logistic) generally achieves F-measures higher than Naive Bayes but lower than SVMs, it does improve over SVMs when the threshold value is 59. The multinomial logistic regression classifier in fact proves to be comparable to the best SVM approach (SMO - polynomial kernel and sequential minimal optimisation algorithm) when a relaxed definition of influenza is used to classify tweets. When a more strict definition of flu-related tweets is adopted, the performance of Logistic degrades, indicating poor robustness across threshold values of this logistic regression classifier for this task. A similar conclusion can be drawn for the other logistic regression approaches investigated in this study. In fact, the linear logistic regression classifier
Table 3 Precision (prec) and recall (rec) values with respect to the ‘likelihood of influenza’ threshold level obtained by the studied classifiers when evaluated using 10-fold cross-validation th > 49 rec
prec
th > 59 rec
prec
th > 74 rec
prec
th > 84 rec
prec
th > 89 rec
prec
th > 94 rec
prec
th > 99 rec
prec
NaiveBayes
.752
.668
.752
.695
.742
.687
.736
.632
.732
.636
.734
.639
.734
.641
J4.8
.760
.682
.750
.693
.747
.685
.748
.638
.755
.643
.751
.640
.749
.634
SMO
.760
.664
.759
.710
.748
.696
.746
.654
.755
.645
.746
.643
.745
.645
SPegasos
.764
.674
.761
.703
.747
.685
.749
.647
.755
.647
.749
.643
.747
.647
VotedPerceptron
.762
.682
.750
.703
.740
.700
.730
.653
.732
.651
.730
.635
.721
.650
Logistic
.753
.690
.751
.722
.736
.706
.725
.665
.730
.650
.728
.642
.728
.650
SimpleLogistic LMT
.758 .765
.674 .684
.751 .760
.714 .694
.738 .744
.676 .685
.747 .748
.644 .638
.750 .754
.645 .642
.752 .752
.639 .634
.749 .751
.632 .637
RandomForest
.765
.684
.761
.698
.742
.687
.749
.634
.754
.636
.753
.627
.746
.637
Bolded results indicate the best performance achieved for each threshold value.
Zuccon et al. Health Information Science and Systems 2015, 3(Suppl 1):S4 http://www.hissjournal.com/content/3/S1/S4
Page 6 of 10
Figure 3 Classifier effectiveness (F-measure) at different threshold values.
truth annotations and their classification value according to the studied classifiers (left column: classified as influenza, i.e. true positive (TP) cases; right column: classified as non-influenza, i.e. false negative (FN) cases). Vice versa, the second row indicates the number of tweets that have been assessed as not reporting influenza cases; the leftmost value corresponds to non-influenza tweets that have been erroneously classified as being influenzarelated false positive - FP), while the rightmost value corresponds to non-influenza tweets that have been correctly classified (i.e. true negative - TN).
(denoted SimpleLogistic) produces F-measures comparable to that of SVMs when the threshold is set to 59, 89, 94; however it does perform poorly with other threshold values, i.e. 49, 74, 99. We now examine the results reported in Table 4 i.e. the confusion matrices produced by each classifier in the cross-validation experiments. Confusion matrices provide a crude but finer-grain understanding of classifier performance than summary measures like F-measure. For each matrix in the table, the first row indicates the number of tweets that are influenza-related according to the ground
Table 4 Confusion Matrices for 10-fold cross-validation experiments th > 49
th > 59
th > 74
th > 84
th > 89
th > 94
th > 99
predicted classes I
true classes
NI
I
NI
I
NI
I
NI
I
NI
I
NI
I
NI
984
489
809
355
672
306
426
248
410
235
394
223
392
220
I
324
1149
267
897
234
744
153
521
150
495
143
474
142
470
NI
989
484
824
340
674
304
430
244
414
231
393
224
394
218
I
319
1154
270
894
230
748
141
533
135
510
131
486
131
481
NI
980
493
812
352
679
299
434
240
417
228
397
220
395
217
I
313
1160
261
903
228
750
145
529
135
510
133
484
133
479
NI
SPegasos
981 313
492 1160
812 261
352 903
679 228
299 750
435 146
239 528
417 137
228 508
397 133
220 484
395 131
217 481
I NI
VotedPerceptron
998
475
828
336
677
301
432
242
421
224
396
221
402
210
I
324
1149
279
885
231
747
154
520
155
490
144
473
152
460
NI
1005
468
832
332
687
291
440
234
419
226
396
221
399
213
I
334
1139
279
885
250
728
164
510
156
489
146
471
145
467
NI
987
486
814
350
669
309
428
246
414
231
392
225
388
224
I
311
1162
271
893
220
758
149
525
135
510
129
488
130
482
NI
NaïveBayes J4.8 SMO
Logistic SimpleLogistic LMT RandomForest
119
45
93
37
75
34
428
246
414
231
390
227
389
223
I
1700
5673
1882
6143
2032
6386
150
524
135
510
129
488
130
482
NI
985
488
817
347
682
296
427
247
410
235
388
229
386
226
I
309
1164
264
900
233
745
142
532
137
508
128
489
126
486
NI
I indicates the positive class, i.e. instances reporting ILI cases, while NI indicates the negative class, i.e. non-ILI instances. Bolded results indicate the highest true positive (TP) value obtained for each threshold value; results highlighted in italics indicate the lowest false positive (FP) value obtained for each threshold value.
Zuccon et al. Health Information Science and Systems 2015, 3(Suppl 1):S4 http://www.hissjournal.com/content/3/S1/S4
If identifying more influenza-related tweets is of key importance, then the best classifier that achieves this is the one with the larger number of TP instances (or vice-versa, the lower number of FN). In Table 4 the highest TP value has been highlighted in bold for each threshold value. For low-mid threshold values (49 ≤ th ≤ 84), the multinomial logistic regression classifier (Logistic) returns the highest number of TP instances. For higher threshold values, the highest number of TP instances is returned by the voted perceptron (th = 89, 99) and SVMs classifiers (th = 94), although Logistic provides a very similar result. If on the other hand producing a low amount of false positive influenza alerts is of key importance, then the most suitable classifier is the one that produces the lowest amount of FP instances (or vice-versa, the highest number of TN); this has been highlighted in italics in Table 4. While the Random Forests classifier produces the lowest number of FP instances at low and high threshold values (th = 49, 94, 99), not one classifier exhibits consistently lower FP instances for mid values of the threshold (59 ≤ th ≤ 89). Effectiveness on unseen data
The results obtained by the classifiers when validated against unseen data are analysed next. Tables 5 and 6 report respectively the F-measure values and the confusion matrices produced by the classifiers. The classifiers exhibit lower F-measures when validated on the unseen dataset than when tested in the cross-validation settings. This is because the dataset used for cross-validation was balanced across the two classes (same number of influenza-related and non influenza-related instances), while the dataset used in this second experiment is heavily imbalanced towards the negative class. This means that there are many more non-influenza tweets than the influenza ones: in fact, the percentage of influenza-related tweets in this dataset varies across the different threshold values and ranges between 2.22% for th = 49 and 0.74% for th = 99 (while in the balanced dataset was 50%). Nevertheless, the
Page 7 of 10
results confirm the observation made in the crossvalidation settings that automatically classifying tweets under a loose definition of influenza is easier than under the strict settings, i.e. all classifiers obtain higher F-measures for low threshold values than for high threshold values. The SPegasos variation of SVM does however constitute an exception, as inconsistent F-measure values are measured across the range of threshold values; in particular, performance yielded at the lowest threshold are worse than that at any other threshold value. The values reported in the confusion matrices for SPegasos (Table 6) highlight that this classifier is unable to correctly identify a large percentage of positive instances (TP) while it correctly identifies non-influenza cases (TN) at a higher rate than other classifiers, therefore yielding often larger values of F-measure due to the imbalanced nature of the dataset. The results discussed in the previous paragraph suggest that considering F-measure values may lead to performance underestimation: an error rate for negative instances has a proportional larger contribution than a similar error rate on positive instances. To avoid this, we calculate the balanced accuracy yielded by each classifier under the different threshold settings. Balanced accuracy  (i.e. the average accuracy obtained on either class) is defined as [24]: 0.5 ∗ TP 0.5 ∗ TN Aˆ = + TP + FN TN + FP
(1)
When contrasted with the standard accuracy measure, balanced accuracy presents the advantage that  is high if a classifier performs equally well on both classes, while  is low when high (standard) accuracy is obtained only because the classifier is advantaged or penalised by an imbalanced dataset, like in this case. A majority class classifier (in this case a classifier that assigns every instance to the negative class) and a minority class classifier (all instances assigned to the positive class) will obtain a balanced accuracy equivalent to chance (i.e. 0.5). The balance accuracy obtained by the classifiers investigated in this study is reported in Table 7.
Table 5 F-measure values with respect to the threshold level obtained by the studied classifiers when evaluated on unseen data th > 49
th > 59
th > 74
th > 84
th > 89
th > 94
th > 99
NaiveBayes
.110
.084
.064
.036
.034
.031
.031
J4.8 SMO
.119 .118
.083 .086
.064 .067
.037 .038
.035 .035
.033 .033
.033 .033
SPegasos
.050
.101
.058
.108
.073
.079
.079
VotedPerceptron
.117
.085
.066
.037
.034
.032
.031
Logistic
.117
.085
.066
.037
.033
.030
.030
SimpleLogistic
.120
.088
.068
.037
.035
.033
.033
LMT
.120
.089
.068
.037
.035
.033
.033
RandomForest
.119
.089
.066
.038
.035
.032
.033
Zuccon et al. Health Information Science and Systems 2015, 3(Suppl 1):S4 http://www.hissjournal.com/content/3/S1/S4
Page 8 of 10
Table 6 Confusion Matrices obtained when testing on unseen data th > 49
th > 59
th > 74
th > 84
th > 89
th > 94
th > 99
I
I
I
predicted classes I NaiveBayes J4.8 SMO SPegasos VotedPerceptron Logistic SimpleLogistic LMT RandomForest
NI
I
NI
I
NI
I
NI
true classes NI
NI
NI
110
54
91
39
74
35
44
31
43
29
39
30
39
29
1725
5648
1950
6075
2124
6294
2298
6762
2414
6707
2413
6767
2416
6775
118
46
95
35
77
32
45
30
43
29
40
29
40
28
1701
5672
2054
5971
2219
6199
2300
6760
2324
6797
2351
6829
2353
6838
NI
117 1696
47 5677
94 1954
36 6071
78 2133
31 6285
46 2320
29 6740
43 2324
29 6797
40 2351
29 6829
40 2353
28 6838
I NI
5
159
10
120
5
104
7
68
4
68
5
64
5
63
30
7343
58
7967
57
8361
48
9012
33
9088
53
9127
53
9138
121
43
95
35
73
36
46
29
44
28
42
27
41
27
1788
5585
2000
6025
2025
6393
2382
6678
2465
6656
2497
6683
2514
6677
121
43
95
35
78
31
46
29
43
29
38
31
40
28
1776
5597
2002
6023
2170
6248
2392
6668
2463
6658
2396
6784
2529
6662
119
45
89
41
76
33
45
30
43
29
40
29
40
28
1700
5673
1855
6170
2060
6358
2189
6871
2324
6797
2351
6829
2353
6838
119
45
95
35
76
33
45
30
43
29
39
30
40
28
1700
5673
1912
6113
2045
6373
2300
6760
2324
6797
2263
6917
2353
6838
119
45
94
36
77
32
44
31
41
31
38
31
39
29
1725
5648
1881
6144
2153
6265
2187
6873
2242
6879
2263
6917
2271
6920
I NI I
I NI I NI I NI I NI I NI I NI
I indicates the positive class, i.e. instances reporting ILI cases, while NI indicates the negative class, i.e. non-ILI instances. Bolded results indicate the highest true positive (TP) value obtained for each threshold value; results highlighted in italics indicate the lowest false positive (FP) value obtained for each threshold value.
Values of balanced accuracy generally decrease as the threshold values increase: this confirms the previous analysis. In addition, balance accuracy reveals that the SVM instance implemented by SPegasos performs just above chance across all threshold values. This suggests that the model learnt by SPegasos on the cross-validation data is poorly applicable to the unseen data contained in the second dataset. Performance of other classifiers do however scale on unseen data. The best values of balance accuracy across each threshold value are highlighted in bold in Table 7. The observation that the Naive Bayes classifiers constitutes a lower bound in classification performance in the cross-validation experiments is confirmed in this second experimental setting. The SMO implementation
of SVM classifier is confirmed to provide consistently high performance. The finding observed under the crossvalidation settings that the multinomial regression classifier Logistic performs similar to SMO for low threshold value while losing effectiveness for higher vales is confirmed in this experiment. Vice versa, in this second experiment the other linear regression classifier, SimpleLogistic, is found to provide similar results to SMO across the different threshold values.
Conclusions In this paper we have investigated the performance of machine learning classifiers for the task of detecting Twitter messages that mention possible cases of influenza
Table 7 Balanced accuracy values (Â) with respect to the threshold level obtained by the studied classifiers when evaluated on unseen data th > 49
th > 59
th > 74
th > 84
th > 89
th > 94
NaiveBayes
.718
.729
.713
.667
.666
.651
th > 99 .655
J4.8 SMO
.744 .742
.737 .740
.721 .731
.673 .679
.671 .671
.662 .662
.666 .666
SPegasos
.513
.535
.520
.544
.526
.533
.534
VotedPerceptron
.748
.741
.715
.675
.670
.668
.665
Logistic
.748
.741
.729
.675
.664
.645
.657
SimpleLogistic
.748
.727
.726
.679
.671
.662
.666
LMT
.748
.746
.727
.673
.671
.659
.666
RandomForest
.746
.744
.725
.673
.662
.652
.663
Zuccon et al. Health Information Science and Systems 2015, 3(Suppl 1):S4 http://www.hissjournal.com/content/3/S1/S4
or ILI. Our experiments considered a number of standard textual features, such as word tokens, stems and n-grams; in addition, we did consider features that are specific to Twitter messages, such as the presence of Twitter usernames, hashtags (i.e. #String), URLs and emoticons. The creation and investigation of new alternative features is left for future research. Previous studies have shown the effectiveness of SVMs over Naive Bayes classifiers. While our study confirms this result, we show that Naive Bayes’s performance can often be considered as the lower bound of a wide range of alternative classifiers and that there are a number of classifiers that perform similarly (or better under specific settings) than SVMs. In particular, the instance of SVM with linear kernel and stochastic gradient descent (SPegasos) tested in our study showed limited robustness when tested on a heavy imbalanced unseen dataset, although confirming good performance on cross-validation experiments with balanced data. Differences in performance between the cross-validation experiments and those on unseen data may highlight the importance of the training methodology used to form the classifiers, and in particular whether to balance or stratify the datasets used during the training and testing phases. Chai et al [25] found that classification methods trained, validated, and tested on balanced datasets overestimated classification performance when compared with testing on imbalanced (stratified) data. Similar results were found in our study, where classifiers’ F-measure in the crossvalidation experiments (with a balanced dataset) were higher than those achieved in the unseen dataset experiments (with an imbalanced dataset). To overcome this issue and present a meaningful analysis of the result obtained on unseen data, we used the balanced accuracy measure [24], that overcomes the issue of a biased classifier that has taken advantage of an imbalanced test set, like in the case for the SPegasos classifier in our experiments. We leave further investigation and analysis of training/testing methodology designs to future work. Finally, the results also reveal that often there is only limited difference in performance across the different investigated classifiers. This suggests that future research efforts for the detection of ILI related tweets should be directed beyond improving machine learning techniques, in particular addressing how disease outbreak monitoring systems should cope with false positive notifications produced by the proposed automatic methods. Knowing the exact number of true ILI-related tweets may be not necessary in the settings of a disease outbreak monitoring system, as increases or decreases in trends of tweets classified as likely to be ILI-related may be sufficient to correctly suggest disease outbreaks. This hypothesis requires further investigation and is left for future work.
Page 9 of 10
Competing interests The authors declare that they have no competing interests. Authors’ contributions GZ, SK, AN and JB conceived the study and participated in its design and coordination of the research. GZ, SK, AN, JB and MH contributed to the design of the Twitter annotation tool, Twitter annotations, and the interpretation of the results. GZ and MH developed, modelled, and performed evaluations and statistical analysis. MC provided the Twitter data set generated by the ESA-AWTM software. All authors have contributed to the drafting of the manuscript and have read and approved the final version. Acknowledgements The authors wish to acknowledge the Australian e-Health Research Centre staff for their collective efforts in annotating Twitter messages. Declarations The costs of publication associated to this article were funded by the Australian e-Health Research Centre. This article has been published as part of Health Information Science and Systems Volume 3 Supplement 1, 2015: Proceedings of the Health Informatics Society of Australia Big Data Conference (HISA 2013). The full contents of the supplement are available online at http://www.hissjournal. com/supplements/3/S1/ Authors’ details 1 Information Systems School, Queensland University of Technology, Brisbane, Australia. 2The Australian e-Health Research Centre, CSIRO Digital Productivity Flagship, Brisbane, Australia. 3CSIRO Digital Productivity Flagship, Canberra, Australia. Published: 24 February 2015 References 1. Ferguson NM, Cummings DA, Cauchemez S, Fraser C, Riley S, Meeyai A, Iamsirithaworn S, Burke DS: Strategies for containing an emerging influenza pandemic in Southeast Asia. Nature 2005, 437(7056):209-214. 2. Longini IM, Nizam A, Xu S, Ungchusak K, Hanshaoworakul W, Cummings DA, Halloran ME: Containing pandemic influenza at the source. Science 2005, 309(5737):1083-1087. 3. Clothier HJ, Fielding JE, Kelly HA: An evaluation of the Australian Sentinel Practice Research Network (ASPREN) surveillance for influenza-like illness. Communicable diseases intelligence 2005, 29(3):231. 4. Hartley D, Nelson N, Arthur R, Barboza P, Collier N, Lightfoot N, Linge J, Goot E, Mawudeku A, Madoff L, et al: An overview of Internet biosurveillance. Clinical Microbiology and Infection 2013. 5. Achrekar H, Gandhe A, Lazarus R, Yu SH, Liu B: Predicting flu trends using twitter data. Computer Communications Workshops (INFOCOM WKSHPS), 2011 IEEE Conference on, IEEE 2011, 702-707. 6. Lampos V, Cristianini N: Tracking the flu pandemic by monitoring the social web. Cognitive Information Processing (CIP), 2010 2nd International Workshop on, IEEE 2010, 411-416. 7. Lampos V, Cristianini N: Nowcasting events from the social web with statistical learning. ACM Transactions on Intelligent Systems and Technology (TIST) 2012, 3(4):72. 8. Collier N, Doan S: Syndromic classification of Twitter messages. Electronic Healthcare Springer; 2012, 186-195. 9. Yin J, Karimi S, Robinson B, Cameron M: ESA: emergency situation awareness via microbloggers. Proceedings of the 21st ACM international conference on Information and knowledge management, ACM 2012, 2701-2703. 10. Hamlet M, Zuccon G, Khanna S, Nguyen A, Boyle J, Cameron M: Monitoring social media for communicable disease surveillance: An Australian study. Big Data in Health and Biomedicine 2013, 46-47. 11. Sadilek A, Kautz HA, Silenzio V: Predicting Disease Transmission from GeoTagged Micro-Blog Data. AAAI 2012. 12. Signorini A, Segre AM, Polgreen PM: The use of Twitter to track levels of disease activity and public concern in the US during the influenza A H1N1 pandemic. PloS one 2011, 6(5):e19467.
Zuccon et al. Health Information Science and Systems 2015, 3(Suppl 1):S4 http://www.hissjournal.com/content/3/S1/S4
Page 10 of 10
13. Witten IH, Frank E, Hall MA: Data Mining: Practical Machine Learning Tools and Techniques: Practical Machine Learning Tools and Techniques. Elsevier; 2011. 14. Le Cessie S, Van Houwelingen J: Ridge estimators in logistic regression. Applied statistics 1992, 191-201. 15. Platt JC: 12 Fast Training of Support Vector Machines using Sequential Minimal Optimization 1999. 16. Shalev-Shwartz S, Singer Y, Srebro N, Cotter A: Pegasos: Primal estimated sub-gradient solver for svm. Mathematical Programming 2011, 127:3-30. 17. Nguyen AN, Lawley MJ, Hansen DP, Colquist S: A simple pipeline application for identifying and negating SNOMED clinical terminology in free text. HIC 2009: Proceedings; Frontiers of Health Informatics-Redefining Healthcare, National Convention Centre Canberra, 19-21 August 2009 Health Informatics Society of Australia (HISA); 2009, 188. 18. Nguyen A, Moore J, Lawley M, Hansen D, Colquist S: Automatic extraction of cancer characteristics from free-text pathology reports for cancer notifications. Health Informatics Conference 2011, 117-124. 19. Nguyen A, Moore J, Zuccon G, Lawley M, Colquist S: Classification of pathology reports for cancer registry notifications. In Health Informatics: Building a Healthcare Future Through Trusted Information-Selected Papers from the 20th Australian National Health Informatics Conference (Hic 2012). Volume 178. Ios PressInc; 2012:150. 20. Butt L, Zuccon G, Nguyen A, Bergheim A, Grayson N: Classification of Cancer-related Death Certificates using Machine Learning. Australasian Medical Journal 2013, 6(5):292-299. 21. Zuccon G, Wagholikar A, Nguyen A, Chu K, Martin S, Lai K, Greenslade J: Automatic Classification of Free-Text Radiology Reports to Identify Limb Fractures using Machine Learning and the SNOMED CT Ontology. AMIA Clinical Research Informatics 2013. 22. Zuccon G, Koopman B, Nguyen A, Vickers D, Butt L: Exploiting medical hierarchies for concept-based information retrieval. Proceedings of the Seventeenth Australasian Document Computing Symposium, ACM 2012, 111-114. 23. Porter MF: An algorithm for suffix stripping. Program: electronic library and information systems 1980, 14(3):130-137. 24. Brodersen KH, Ong CS, Stephan KE, Buhmann JM: The balanced accuracy and its posterior distribution. Pattern Recognition (ICPR), 2010 20th International Conference on, IEEE 2010, 3121-3124. 25. Chai KE, Anthony S, Coiera E, Magrabi F: Using statistical text classification to identify health information technology incidents. Journal of the American Medical Informatics Association 2013. doi:10.1186/2047-2501-3-S1-S4 Cite this article as: Zuccon et al.: Automatic detection of tweets reporting cases of influenza like illnesses in Australia. Health Information Science and Systems 2015 3(Suppl 1):S4.
Submit your next manuscript to BioMed Central and take full advantage of: • Convenient online submission • Thorough peer review • No space constraints or color figure charges • Immediate publication on acceptance • Inclusion in PubMed, CAS, Scopus and Google Scholar • Research which is freely available for redistribution Submit your manuscript at www.biomedcentral.com/submit