Nov 11, 2013 - are the range of points in 9 different directions in 3D space. Comparison of .... This was done as a follow up of an approach proposed by Luo.
ISPRS Annals of the Photogrammetry, Remote Sensing and Spatial Information Sciences, Volume II-5/W2, 2013 ISPRS Workshop Laser Scanning 2013, 11 – 13 November 2013, Antalya, Turkey
AUTOMATIC EXTRACTION OF INSULATORS FROM 3D LIDAR DATA OF AN ELECTRICAL SUBSTATION M. Arastounia, D.D. Lichti
Department of Geomatics Engineering, University of Calgary, 2500 University Drive, NW, Calgary, Canada, T2N 1N4 (marastou, ddlichti)@ucalgary.ca Commission V/WG V-3
KEY WORDS: LiDAR, Point Cloud Processing, Segmentation, Object Recognition, Knowledge-Based Classification
ABSTRACT: A considerable percentage of power outages are caused by animals that come into contact with conductive elements of electrical substations. These can be prevented by insulating conductive electrical objects, for which a 3D as-built plan of the substation is crucial. This research aims to create such a 3D as-built plan using terrestrial LiDAR data while in this paper the aim is to extract insulators, which are key objects in electrical substations. This paper proposes a segmentation method based on a new approach of finding the principle direction of points’ distribution. This is done by forming and analysing the distribution matrix whose elements are the range of points in 9 different directions in 3D space. Comparison of the computational performance of our method with PCA (principal component analysis) shows that our approach is 25% faster since it utilizes zero-order moments while PCA computes the first- and second-order moments, which is more time-consuming. A knowledge-based approach has been developed to automatically recognize points on insulators. The method utilizes known insulator properties such as diameter and the number and the spacing of their rings. The results achieved indicate that 24 out of 27 insulators could be recognized while the 3 un-recognized ones were highly occluded. Check point analysis was performed by manually cropping all points on insulators. The results of check point analysis show that the accuracy, precision and recall of insulator recognition are 98%, 86% and 81%, respectively. It is concluded that automatic object extraction from electrical substations using only LiDAR data is not only possible but also promising. Moreover, our developed approach to determine the directional distribution of points is computationally more efficient for segmentation of objects in electrical substations compared to PCA. Finally our knowledge-based method is promising to recognize points on electrical objects as it was successfully applied for insulators.
1. INTRODUCTION According to the US Department of Energy (2012), today's electricity system is 97.97% reliable, yet power outages and interruptions that cost the US Government at least $150 billion each year still occur. A considerable percentage of these outages are caused by animals like birds, mammals, reptiles, etc. As electrical substations are constructed in open areas, animals can reach them easily and by touching them, not only will they be electrocuted but also they cause electrical outages and huge maintenance costs. This can be prevented by insulating the conductive parts of electrical substations with protective covers. To do so, a 3D plan of the electrical substation is required. Since the design and the configuration of equipment at electrical substations are dynamic and can change over time, any existing as-designed plans are not useful. Manual collection of measurements is not feasible since safety restrictions require the substation to be deenergized, which is extremely expensive. Therefore, the measurements need to be taken by non-contact remote sensing devices like laser scanners.
1. 2. 3. 4.
Data collection Point cloud segmentation Object recognition from segmented points 3D modelling of recognized objects
The main focus of this paper is point cloud segmentation and insulator recognition. The first research question is: which method is suitable to segment the point cloud? The second is: how insulators can be extracted out of segmented points? In this paper, the introduction is presented in the first section which is followed by related work in section two. Specifications of the dataset and the sensor are mentioned in section three. The methodology is described in the fourth section and the results and discussion are presented in section five. The sixth section gives the conclusions and discusses the future work. The methodology is described after the dataset specifications since its description requires knowledge of the acquired data.
2. RELATED WORK 2.1 Electrical outages
The ultimate objective of this research is to develop automated methods to make 3D as-built plans of electrical substations using LiDAR data. This paper specifically aims to extract the insulators as one of the key objects in electrical substations. The process of 3D modelling using LiDAR data has four steps:
Heck and Harness (2008) inspected the negative effects of electrical outages not only on economics, but also on society, politics and biology. Harness (2012) had a comprehensive review of how different birds and reptiles can cause electrical outages. He also investigated the electrical objects which have
This contribution has been peer-reviewed. The double-blind peer-review was conducted on the basis of the full paper. doi:10.5194/isprsannals-II-5-W2-19-2013
19
ISPRS Annals of the Photogrammetry, Remote Sensing and Spatial Information Sciences, Volume II-5/W2, 2013 ISPRS Workshop Laser Scanning 2013, 11 – 13 November 2013, Antalya, Turkey the highest potential to cause electrical outages in case animals come into contact. He concluded that most outages are preventable by establishing proper animal clearance. Burnham et al. (2004) studied outages caused by only birds and proposed some modifications to the existing standard designs as a solution. The modifications are pole-line reconfiguration, the use of cover-up materials, etc. This research was followed by Sundararajan et al. (2004) in which some procedures are recommended to reduce bird-related outages on transmission lines, in substations and on overhead distribution lines. Insulation of electrical objects is proposed by Burnham et al. (2004) and Sundararajan et al. (2004) as a solution to electrical outages problem. In this paper, insulation of the conductive parts of electrical substations is also proposed based on a new approach of utilizing a 3D as-built plan of the electrical substation obtained from LiDAR data. 2.2 Object extraction from LiDAR data
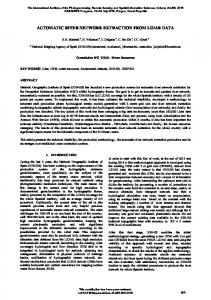
3. DATASET AND SENSOR An electrical substation in Airdrie, a city near Calgary, Canada, was scanned using a Leica HDS 6100 laser scanner. This laser scanner is a phased-based instrument with 5 mm distance accuracy up to 25 m and horizontal and vertical angular accuracy of 125 µrad. To cover the whole area, scanner data were acquired with a levelled instrument from seven stations. Among various scanning resolution options available in the aforementioned laser scanner, scanning was performed with super high resolution i.e. the point spacing of 3.1*3.1 mm2 at a distance of 10 m and 5.8*5.8 mm2 for a distance of 50 m. A point-based registration technique using flat, signalized targets was performed, which resulted in a point cloud having more than five hundred million (510 103 272) points. Figure 1 depicts the registered 3D point cloud, colour-coded according to intensity, utilized as the dataset for this research.
A large amount of research on the extraction of various objects from LiDAR data from different environments has been conducted. However, not much research has been done on the extraction of objects from electrical substations. Since the majority of objects in electrical substations are cylindrical, methods to extract cylinders from different environments can be useful in the electrical substation environment as well. Vosselman et al. (2004) review many techniques to extract various surfaces, including cylinders, mainly by parametricdomain methods. Rabani and Van den heuvel (2005) presented an efficient Hough Transform algorithm for cylinder detection in an industrial site out of LiDAR data in parametric domain. Parametric–domain methods are computationally very expensive and thus not efficient for large datasets like the one utilized in this research.
Figure 1. The registered 3D point cloud of the electrical substation
4. METHODOLOGY Pu et al. (2011) developed an automated method for extracting objects for road inventories. To detect poles, which are cylindrical objects, they divide each object into horizontal slices and analyse the centre and the length of diagonal of each slice. This was done as a follow up of an approach proposed by Luo and Wang (2009). The idea proposed by Pu et al. (2011) has been modified in this research to be utilized to recognize points on insulators. Gonzalez-Aguilera et al. (2012) converted LiDAR data to images and integrated them with photographic images to extract and model objects of electrical substations by applying photogrammetric techniques. Although the proposed method achieved good results, it is not suitable for our research as it integrates LiDAR data with images. That is so because we are investigating the feasibility of recognizing objects of an electrical substation using only LiDAR data. Brodu and Lague (2012) proposed a new segmentation approach to classify 3D point clouds of complicated natural scenes. They determined the local behaviour of a point cloud at different scales by inspecting the 3D structure of each point’s neighbourhood. By doing so, they could determine if the neighbouring points of each point are distributed in 1D, 2D or 3D. The idea of studying 3D structure of points’ neighbourhood and local behaviour of point cloud along different directions is modified in this research to be applied in the electrical substation environment.
First an automated approach based on the histogram of the points’ elevation is proposed to automatically eliminate the points on the ground. Afterwards, a subset of dataset is considered on which the rest of the developed methods are applied. Later on, a new segmentation method based on the distribution direction of points is described which is followed by a knowledge-based approach to recognize insulators. 4.1 Eliminating points on the ground Since points on the ground constitute a large proportion of the dataset, removing them provides us with the opportunity to concentrate on a smaller number of points on the objects of interest at the electrical substation. To do so, an automatic approach using a height constraint was developed in which the elevation of the ground is automatically determined and then all points on or lower than the ground are eliminated. Here it is assumed that the ground in the area of electrical substations is relatively flat, which is in accordance with the specifications for the design of electrical substations. Our automatic threshold selection approach uses the points’ height histogram. Once the peak of the histogram, which corresponds to the ground, is found, the values and the gradient of the adjacent bins to the right are analysed. The threshold used to remove the ground is determined once the bin entries have decreased dramatically and remain small. This corresponds to passing from groups of points on the ground with large number of points to groups of offground points with a small number of points.
This contribution has been peer-reviewed. The double-blind peer-review was conducted on the basis of the full paper. doi:10.5194/isprsannals-II-5-W2-19-2013
20
ISPRS Annals of the Photogrammetry, Remote Sensing and Spatial Information Sciences, Volume II-5/W2, 2013 ISPRS Workshop Laser Scanning 2013, 11 – 13 November 2013, Antalya, Turkey The performance of our method is compared with Otsu’s method which is “a non-parametric and unsupervised method of automatic threshold selection for picture segmentation” (Otsu, 1979). Otsu’s method defines classes in a way to be as separate as possible. To do so, only the zero- and first-order cumulative moments are utilized. Figure 2 presents the points’ elevation histogram and the thresholds selected by our approach and Otsu’s method. One should note that elevation of laser scanner was about 1.1 m above the ground. Considering that, the threshold resulting from Otsu’s method, 0.724 m, corresponds to considering the elevation of the ground about 1.8 m above its real elevation which would lead to many segmentation errors. This demonstrates that the proposed histogram gradient approach is superior for this application. Moreover, it should be noticed that the ground in the electrical substation area is relatively flat, not completely and employing such an automated approach results in a more accurate and reliable ground elevation estimation. In addition, since the substation ground was covered with snow, ground’s elevation was unbalanced and histogram analysis was helpful to have a more precise estimate of it.
Figure 4. The subset of dataset utilized in this research 4.3 Segmentation The purpose of segmentation is to decompose a complex scene into sets of homogeneous objects that are further analysed to determine whether they are insulators. The proposed segmentation algorithm is a region growing method in which seed points are chosen randomly. It aggregates points into one segment if they are within certain vicinity from seed points and their neighbouring points are distributed along same direction. Here we propose a new approach to determine the distribution direction of points in which all neighbouring points of each point are projected on nine different directions in 3D Cartesian space. These consist of the three cardinal directions (along the X, Y and Z axes), and two directions in each of the XY, XZ and YZ planes at 45 to the cardinal axes. The directions are indicated in Figure 5.
Figure 2. Histogram of points’ elevation 4.2 Sample objects For our initial algorithm development, a subset of the dataset (after ground removal) is utilized. With 1.7 million points, this subset comprises many electrical objects found on such a site. Furthermore, in electrical substations there is a repetitive pattern of objects with the same type, size and shape, samples of which are included in our selected data subset. Figure 3 shows a view of the electrical substation in which the repetitive pattern of objects is obvious. Figure 4 indicates the dataset subset considered for this study in which there are some parts of fence, a circuit breaker appeared as a box in the foreground, some cables connected to bushings which are similar in appearance to insulators and located on top of the circuit breaker and a tall structure comprising metallic rods and insulators.
YX
Y
XY 45° X
ZX
Z
XZ
ZY
Z
45° X
YZ 45° Y
Figure 5. Three Cartesian axes and six non-Cartesian axes on which points are projected The neighbourhood points’ co-ordinates ranges in the nine directions are arranged in the distribution matrix presented in Equation 1. One should notice that distribution matrix is not symmetric. For instance, Range(xy) and Range(yx) correspond to the ranges on two different (perpendicular) axes in the XY plane.
Range ( x) Range ( xy ) Range ( xz ) (1) Distributi on Range ( yx ) Range ( y ) Range ( yz ) Range ( zx) Range ( zy) Range ( z )
Figure 3. The repetitive pattern of objects
Where: Range (x) = (maximum value of projected points on axis X) – (minimum value of projected points on axis X) etc.
This contribution has been peer-reviewed. The double-blind peer-review was conducted on the basis of the full paper. doi:10.5194/isprsannals-II-5-W2-19-2013
21
ISPRS Annals of the Photogrammetry, Remote Sensing and Spatial Information Sciences, Volume II-5/W2, 2013 ISPRS Workshop Laser Scanning 2013, 11 – 13 November 2013, Antalya, Turkey In this paper, only the diagonal elements of the distribution matrix are considered i.e. the range of projected points on Cartesian X, Y and Z axes. So, the Cartesian axis exhibiting the largest zero-order moment is considered as the principal direction of distribution of a point neighbourhood. In other words, the off-ground points are segmented based on the direction of the distribution of their point neighbourhood along three axes (X, Y and Z).
In Figure 7, the yellow arrow points in the primary direction of the point distribution of the insulator. The green lines depict slices on non-ring parts of insulators’ body with small number of points. The red lines indicate the slices on insulators’ rings with a large number of points.
The neighbourhood radius was determined so that a sufficient number of neighbouring points is utilized to derive reliable information about the direction of distribution. For this dataset, a neighbourhood radius of 15 cm was used. Since some objects are located very close to each other, a neighbourhood size greater than 15 cm can comprise points of other objects which can provide with misleading information about the distribution direction of the object under study. On the other hand, the neighbourhood size of smaller than 15 cm will not provide us with reliable information about the direction of distribution.
Based on properties of the insulators in Table 1, an insulator is expected to have a diameter of less than 25 cm and 6-8 rings with 3-4 cm spacing on its body.
Our proposed approach of determining the distribution direction is compared with principal components analysis (PCA) which is one of the most common methods to compute the distribution direction of points. The covariance matrix is required if PCA is employed. The construction of the covariance matrix, whose eigenvalue decomposition is subsequently performed, involves the computation of first- and second-order moments of the neighbourhood co-ordinates. The intention of our approach is to encapsulate the overall structure of the local neighbourhood with fewer computations by using zero-order moments, which can be evaluated by logical operations rather than by floating point operations as required in PCA. 4.4 Extraction of points on insulators In this section, insulators and bushings are extracted by considering their unique characteristics which differentiate them from other objects. Hereafter, both insulators and bushings are referred to as insulators for simplicity. The main characteristics of the insulators utilized for their recognition are the diameter and the rings. An object that has a certain number of rings in certain intervals and with a certain size will be recognized as an insulator. To determine the diameter, spacing, prior information substation is needed. Table about four different types of from manual inspection.
the number of rings and their about actual insulators at the 1 presents detailed information insulators in the dataset obtained
Table 1. Specifications of four types of insulators in the dataset Inner Outer Rings Insulator type/ No of diameter diameter spacing Specifications rings (cm) (cm) (cm) Type 1 7 17 6 4 Type 2 6 11 6 4 Type 3 4 8 8 3 Type 4 12 19 8 3 Figure 6 shows photographic image of an insulator of Type 1 and Figure 7 shows a point cloud of a Type 1 insulator in which it is evident that the number of points on the rings is noticeably higher than on insulator body (non-ring parts). This repetitive pattern of variation in the point density on ring and non-ring parts of insulators is used to detect the rings.
Our insulator extraction approach Figure 6. An divides each segment into slices along insulator in the its principal distribution direction electrical substation obtained from the segmentation step. Then it investigates the point density of each slice. Rings are recognized once a repetitive pattern of density changes is detected. Slices with high and low point density correspond to rings and non-ring parts (insulator body) respectively. Then if the extent of the rings along the axis perpendicular to the direction of distribution, corresponding to diameter, is with the range of insulator diameters given in Table 1, it is recognized as an insulator. Figure 7. An insulator in the In fact, the algorithm 3D point cloud investigates the possibility of the existence of insulators in each segment by inspecting the size and the pattern of variation in the point density of slices of that segment. The width of slices needs to be determined in a way that it provides reliable information about the point density variation along the direction of distribution. Considering size of insulators and point density of the dataset, the width of slices used was 0.5 cm. Rings can be recognized with high accuracy if each slice contains either a ring or a non-ring part of an insulator. Considering slices wider than 0.5 cm may lead to slices which contain both a ring and a non-ring part of an insulator. On the other hand, slices narrower than 0.5 cm would only increase the computational cost with no more considerable improvement of results. The following figures depict clearly how the insulator structure is recognized from the histograms. Figure 8 represents the histogram of a segment containing an insulator of Type 1 in which the green arrows point to histogram bins corresponding to insulator rings appearing as sudden increases in point density of some slices. It can also be seen that rings occur with a regular spacing of 4 cm in the histogram which is in accordance with the specifications of Type 1 insulator. Figure 9 shows the histogram of a planar segment containing the circuit breaker. It is evident in Figure 9 that although there are some peaks in the histogram, they do not have a regular pattern of a certain number of peaks in certain intervals. This is expected as there are no insulators in this segment. The first part
This contribution has been peer-reviewed. The double-blind peer-review was conducted on the basis of the full paper. doi:10.5194/isprsannals-II-5-W2-19-2013
22
ISPRS Annals of the Photogrammetry, Remote Sensing and Spatial Information Sciences, Volume II-5/W2, 2013 ISPRS Workshop Laser Scanning 2013, 11 – 13 November 2013, Antalya, Turkey of the histogram (0 to 25 cm) represents the points on the circuit breaker legs and the rest of the points higher than 25 cm are the ones on the body of circuit breaker with almost constant point density along the distribution direction.
Figure 8. Histogram of a segment containing an insulator
from horizontal to vertical orientation, comprise two segments. This is not unexpected since only the diagonal elements of the distribution matrix were used. The segmentation of the other substation structures is much more successful, comprising metallic rods and insulator. This is evident in Figure 11 which clearly indicates that all metallic rods and insulators have been grouped separately as different segments as shown by the different colours. The computational performance of our approach is compared with PCA by computing the distribution direction of 1 million points each with 5000 neighbouring points by both methods. The computational time of our developed method is 25% less than that of PCA which makes it computationally more efficient. This is expected as in our method only zero-order moments need to be computed while in PCA the first- and second-order moments are computed. Since PCA was not employed for segmentation, its results are not compared with the results obtained by our approach. 5.3 Recognizing points on insulators
Figure 9. Histogram of a segment containing a circuit breaker
The obtained results show that 24 out of 27 insulators were detected. The three un-detected insulators were highly occluded and many points on their surfaces were missing. Figure 12 shows an instance of an occluded insulator, shown by the red arrow, which is not detected while the blue insulator on the right is not occluded and was successfully detected.
Figure 11. A closer view of segmented points
To do the check point analysis, all points on the insulators were manually Figure 12. An occluded insulator cropped and saved as which is not detected shown by a check points. The red arrow detailed results of the check point analysis are presented in Table 2 as a confusion matrix. Moreover, Table 3 provides a summary of the check point analysis in terms of accuracy, precision and recall. Figure 10. Segmentation results
5.1 Ground points removal After removing the points on the ground, only 53 million points remained. In fact, about 89% of points lie on the ground and by removing them we could focus more on the other 11% of points lying on electrical equipment. 5.2 Segmentation The results of our segmentation algorithm are displayed in Figure 10. The fence in the background and the circuit breaker in the foreground are reasonably homogeneous but both suffer some over-segmentation. The cables, which make a transition
Actual points
5. RESULTS AND DISCUSSION
Table 2. Results of check point analysis Recognized points Confusion matrix Insulator Non-insulator points points Insulator 81,363 19,315 points Non-insulator 12,917 1,673,911 points
Table 3. Summarized results of insulator recognition Check point analysis results
Accuracy
Precision
Recall
98%
86%
81%
Figure 13 shows a view of detected insulators in which the blue and red colours correspond to insulator and non-insulator points, respectively. In Figure 13, the two yellow arrows
This contribution has been peer-reviewed. The double-blind peer-review was conducted on the basis of the full paper. doi:10.5194/isprsannals-II-5-W2-19-2013
23
ISPRS Annals of the Photogrammetry, Remote Sensing and Spatial Information Sciences, Volume II-5/W2, 2013 ISPRS Workshop Laser Scanning 2013, 11 – 13 November 2013, Antalya, Turkey indicate the only two groups of points which were incorrectly detected as insulators. Figure 14 indicates a closer view of detected insulators which shows in detail that the majority of insulators are detected out of a complex object which consists of metallic rods and insulators distributed along different directions. Figure 15 shows a closer view of six detected insulators on top of the circuit breaker. As is evident, some of the rings Figure 13. Detected insulators on some insulators were shown by blue colour not detected (yellow arrows) that is because the insulators shown in Figure 15 are different from the ones in Figure 14 in size and ring spacing. In fact, same constraints are employed to detect various types Figure 14. A closer view of segmented of insulators. This points can be improved by employing specific constraints to detect various types of insulators.
Figure 15. Detected and un-detected insulator rings
6. CONCLUSIONS AND FUTURE WORKS Based on the achieved results, the following conclusions can be made. First, the automatic object extraction from electrical substations using only 3D LiDAR data is not only possible but is also promising. Second our proposed method to find the principal direction of the distribution of points is computationally more efficient than PCA for segmentation of objects in electrical substations due to its achieved results and better computational performance. Third by defining suitable constraints, automatic knowledge-based object recognition is feasible in the electrical substation environment as it was successfully applied for insulators. Five aspects of this research will be pursued further. First, the segmentation will be improved to avoid over segmentations. Second, PCA will be employed for segmentation and its results will be compared with the results achieved by our segmentation approach. Third, the insulator recognition algorithm will be improved to detect the un-detected rings and insulators. Fourth,
other objects in the electrical substation will be recognized and finally the recognized objects can be utilized for 3D modelling.
ACKNOWLEDGMENTS Tecterra is greatly acknowledged for its financial support. Cantega Technologies is thanked for their support and arranging access to the electrical substation. The authors also acknowledge the valuable assistance of the following people for the data collection campaign: Dr. Ayman Habib, Dr. Mehdi Ben Hassen, Fangning He, Hossein Armeshi, Ivan Detchev and Abdullah Rawabdeh.
REFERENCES Brodu, N., Lague, D., 2012. 3D terrestrial lidar data classification of complex natural scenes using a multi-scale dimensionality criterion: Applications in geomorphology. ISPRS Journal of Photogrammetry and Remote Sensing, 68, pp. 121-134. Burnham, J., Carlton, R., Cherney, E.A., Couret, G., Eldridge, K.T., Farzaneh, M., Frazier, S.D., Gorur, R.S., Harness, R., Shaffner, D., Siegel, S., Varner, J., 2004. Preventive measures to reduce bird-related power Outages-part I: electrocution and collision. IEEE Transactions on Power Delivery, 19, pp. 18431847. Gonzalez-Aguilera, D., Del Pozo, S., Lopez, G., RodriguezGonzalvez, P., 2012. From point cloud to CAD models: Laser and optics geotechnology for the design of electrical substations. Optics & Laser Technology, 44, pp. 1384-1392. Harness, R., 2012. Power lines and substations- Problems and mitigation strategies. In: EDM International, Fort Collins, USA. Heck, N., Harness, R., 2008. AltaLink protects high-risk substations and sees wildlife-involved outages plummet. In: IEEE PES T&D Conference & Exposition, Chicago, USA. Luo, D., Wang, Y., 2009. Mining Wooden Pillar Features from Point Cloud. In: Information Technology and Computer Science, Kiev, Ukraine, pp. 65-68. Otsu, N., 1979. A Threshold Selection Method from Gray-Level Histograms. IEEE Transactions on Systems, Man and Cybernetics, 9, pp. 62-66. Pu, S., Rutzinger, M., Vosselman, G., Oude Elberink, S., 2011. Recognizing basic structures from mobile laser scanning data for road inventory studies. ISPRS Journal of Photogrammetry and Remote Sensing, 66, pp. 28-39. Rabani, T., Van den heuvel, F., 2005. Efficient hough transform for automatic detection of cylinders in point clouds. In: Laser Scanning 2005 Workshop, Enschede, The Netherlands, pp. 6065. Sundararajan, R., Burnham, J., Carlton, R., Cherney, E.A., Couret, G., Eldridge, K.T., Farzaneh, M., Frazier, S.D., Harness, R., Shaffner, D., Siegel, S., Varner, J., 2004. Preventive measures to reduce bird related power outages-part II: streamers and contamination. IEEE Transactions on Power Delivery, 19, pp. 1848-1853. US Department of Energy, 2012. The smart grid: an introduction. USA. Vosselman, G., Gorte, B.G.H., Sithole, G., Rabbani, T., 2004. Recognizing structure in laser scanner point clouds. International Archives of Photogrammetry Remote Sensing and Spatial Information Sciences, 36, pp. 33-38.
This contribution has been peer-reviewed. The double-blind peer-review was conducted on the basis of the full paper. doi:10.5194/isprsannals-II-5-W2-19-2013
24