ISPRS Annals of the Photogrammetry, Remote Sensing and Spatial Information Sciences, Volume I-7, 2012 XXII ISPRS Congress, 25 August – 01 September 2012, Melbourne, Australia
AUTOMATIC REGISTRATION OF MULTI-SOURCE DATA USING MUTUAL INFORMATION Ebadat G. Parmehr, Chunsun Zhang, Clive S. Fraser
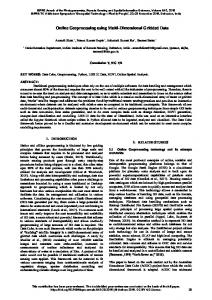
Cooperative Research Centre for Spatial Information, Department of Infrastructure Engineering University of Melbourne, VIC 3010, Australia
[email protected], (chunsunz, c.fraser)@unimelb.edu.au Commission VII, WG VII/6 KEY WORDS: LiDAR, Point Cloud, Optical Imagery, Multisensor, Integration, Registration
ABSTRACT: Automatic image registration is a basic step in multi-sensor data integration in remote sensing and photogrammetric applications such as data fusion. The effectiveness of Mutual Information (MI) as a technique for automated multi-sensor image registration has previously been demonstrated for medical and remote sensing applications. In this paper, a new General Weighted MI (GWMI) approach that improves the robustness of MI to local maxima, particularly in the case of registering optical imagery and 3D point clouds, is presented. Two different methods including a Gaussian Mixture Model (GMM) and Kernel Density Estimation have been used to define the weight function of joint probability, regardless of the modality of the data being registered. The Expectation Maximizing method is then used to estimate parameters of GMM, and in order to reduce the cost of computation, a multi-resolution strategy has been used. The performance of the proposed GWMI method for the registration of aerial orthotoimagery and LiDAR range and intensity information has been experimentally evaluated and the results obtained are presented.
The automatic registration of multi-sensor remote sensing data has generated much research interest in remote sensing and digital photogrammetry. This is driven by the increasing availability of large volumes of Earth observation data, and the need for automated integration of multi-sensor, multi-resolution imaging and ranging data to generate redundant and complementary spatial information products. Integration of data from complementary sensors such as LiDAR and electro-optical sensors plays a crucial role in many applications, especially in feature extraction and building reconstruction. These applications require accurately registered data to support subsequent information product generation.
instead of measuring the similarity between intensities. In other words, MI is a measure of statistical dependency between two data sets and this particular property has made the method suitable for registration of images from either the same or different sensor types. MI is based on the joint probability between the image intensities of corresponding pixels in both the reference and floating images. The maximum value of MI is expected to be achieved when the reference and floating images are geometrically aligned (Viola, 1995). MI-based image registration has been used in medical imaging in recent decades for a wide range of applications. While MI has proven to be effective in multimodal registration, the method can exhibit several important drawbacks in non-ideal situations when the convergence planes of MI are highly non-monotonic, with many local optima (Roche et al, 2000).
Although data supply companies invariably provide georeferenced and orthorectified data products, misregistration errors often exist between complementary data sets. Yet, accurate, automated registration is needed prior to data fusion and subsequent product generation. Conventional featuredbased image registration methods rely on the robust detection of corresponding features between images and this method can suffer from unevenly distributed features that degrade registration accuracy. In contrast, area-based methods quantify the similarity between images using selected similarity measures, such as the sum of squared intensity differences and normalized cross-correlation. While such measures have long proved effective, their application is limited to registration of data acquired from the same sensor type. Intensity-based image registration methods operate under the assumption that a strong relationship exists between the intensity distributions of images to be registered. They attempt to match intensity values by optimizing certain objective functions, such as the Mutual Information (MI) between two images (Maes et al., 1997; Viola, 1995).
Up until now, the general approach to address the problem of local optima in convergence planes of MI has been either to reduce the effect of non-corresponding pixels or to emphasise the influence of corresponding pixels. Gu et al.(2006) define a normalized joint feature weight map which shows the spatial feature similarity between neighbourhoods of corresponding voxels in overlapped regions of two images. Junli et al. (2008) consider different levels of importance for the reference and floating image in order to achieve more robust and accurate registration. Hassen et al. (2009) propose a method for image registration based on a local phase coherence feature and they use a diagonal weighting function based on MI, where more weight is given to the features having greater correspondence between images. Leventon et al. (1998) introduce a method that uses prior information on the expected joint intensity distribution of the images when they are correctly aligned using a prior registered training image.
1. INTRODUCTION
Chan et al. (2003) present a new method based on a priori knowledge of the class-label mappings between two segmented input images. Cremers et al. (2006) develop a Bayesian framework that allows the imposition of statistically learned
MI, which originated from information theory, measures the similarity between the probabilities of intensity of images
303
ISPRS Annals of the Photogrammetry, Remote Sensing and Spatial Information Sciences, Volume I-7, 2012 XXII ISPRS Congress, 25 August – 01 September 2012, Melbourne, Australia
prior knowledge about the joint intensity distribution into image registration methods. The prior is given by a kernel density estimate on the space of joint intensity distributions computed from a representative set of pre-registered image pairs. Zöllei et al. (2007) propose a MAP (maximum a posteriori) framework that employs a multinomial model of joint intensities with parameters for only prior known distributions. Chung et al. (2007) present a method based on a priori knowledge of the joint intensity distribution between image pairs at different image resolutions and the Kullback-Leibler (KLD) distance similarity measure to achieve superior robustness in multimodal image registration. So et al. (2011) propose a similarity measure constructed by using two Kullback-Leibler distances with the graph-cut algorithm, which is based on a priori knowledge of the joint intensity distribution of a pre-aligned image pair.
be represented in image form. The relationship between A and B, their mutual information, depends on of the registration of the images. The MI-based registration criterion postulates that the images are geometrically aligned if I of the transformation is maximal. Maximization of I equals minimization of and it directly depends on the joint distribution. Based on information theory, the joint distribution with more dispersion has higher entropy and vice versa. Therefore, the registered images have a joint distribution with minimum dispersion. The pattern of the joint distribution depends on the physical property of the data and it varies from one sensor to another. In the case of image registration for the same sensor, the joint distribution of corresponding intensities is diagonal, as shown in Figure 1, and it keeps this pattern even when there is misregistration, with more dispersion. The joint distribution for multimodal data sets is not unique and it can be identical for each modality. For instance, an example of the joint distribution of optical imagery and range image is shown in Figure2.
Contrary to method proposed in this paper, those referred to above do not define a general weighting function for the joint intensity distribution in registration of data from multiple sensors. Also, they do not provide an approach which is independent of prior knowledge in the estimation of the joint intensity distribution to remove the effect of local maxima in the registration result. Moreover, the above referenced methods have generally been tested on special medical images that provide a similar joint intensity distribution, where as every separate scene of remote sensing data tends to have a unique joint intensity distribution. In order to efficiently accommodate the registration of multi-sensor data, including airborne and space-borne imagery and ranging data, a novel method called General Weighted Mutual Information (GWMI) has been developed.
Figure 1. Joint distribution of same-sensor images, registered (left) and misregistered by 5 pixels (middle) and 10 pixels (right)
2. METHODOLOGHY 2.1 General Weighted Mutual Information The mutual information I(A,B) of A and B measures the degree of dependence of A and B as the distance between the joint intensity distribution and the distribution associated with the case of complete independence by means of the Kullback-Leibler measure (Maes, 2003):
Figure 2. Joint distribution of multi-sensor images, registered (left) and misregistered by 10 pixels (middle) and 20 pixels (right)
(1) In accordance with the diagonal pattern of the joint distribution in same-sensor image pairs, a Gaussian weight function along the diagonal of joint distribution has been proposed by Hassen (2009) to increase the effect of joint distribution members with greater correspondence. However, while this diagonal weighting function handles same-sensor image registration properly, it is unable to model the complex pattern of the joint distribution for multi-sensor image pairs.
where
is the joint distribution of the pair and and are the marginal distributions of and , respectively.MI is related to the notion of entropy in information theory by the following equation: (2) Here, and are the entropy of A and B, respectively, and is their joint entropy. , and are defined as
The proposed GWMI method is more comprehensive than the common diagonal weight function approach, since it describes the weight function for the joint distribution in a multi-sensor image registration, rather than for same-sensor imagery, via definition of a general weight function that is able to handle complex patterns of joint distribution. However, it can work with simple diagonal patterns. In addition, the proposed weighting function is not dependent upon prior knowledge of the joint distribution and it uses only information from the current joint distribution. MI-based registration methods attach the same importance for all members of the joint distribution, whereas with the GWMI approach denser regions of the joint distribution are assigned higher importance, and less value is given to noise or points in the joint distribution where
(3) (4) (5) Estimates for joint and marginal distributions can be obtained by simple normalization of the joint and marginal histograms of the overlapping parts of both data sets, which will subsequently be referred to as images, implying that a 3D point cloud would
304
ISPRS Annals of the Photogrammetry, Remote Sensing and Spatial Information Sciences, Volume I-7, 2012 XXII ISPRS Congress, 25 August – 01 September 2012, Melbourne, Australia
correspondences between the images are not found. Since the points where there are possible matches between the two images are emphasised, more accurate image registration results can be achieved.
estimates is that it is independent of computation of the first or second derivatives.
As the proposed GWMI method is the general form of weighted MI, a maximum value is sought in estimating the parameters of registration from the expression
The kernel density estimator is a non-parametric density estimator. In comparison to parametric estimators, where the estimator has a fixed functional form (structure) and the parameters are the only information that need to be stored, nonparametric estimators have no fixed structure and depend upon all the data points being used to reach an estimate. Generally, kernel estimators smooth out the contribution of each observed data point over a local neighbourhood using a Kernel function.The estimated density at any point x is
2.3 Kernel Density Estimator
(6) where is the weight given to each entry in the joint distribution. Obviously, the conventional MI-based approach is a special case where all . In this study, the parametric method of Gaussian Mixture Model (GMM) and the non-parametric approach of Kernel Density Estimation (KDE) are used to define the weights for the joint distribution.
(11) where K is the Gaussian kernel function, h is its bandwidth and (Silverman, 1998). Since the estimated density is independent of parameters that have been evaluated previously, less computational cost is anticipated. Furthermore, the kernel density estimator defines the weight function for the joint distribution with a higher level of precision.
2.2 Gaussian Mixture Model A GMM is a parametric probability density function represented as a weighted sum of Gaussian component densities. It is a mixture of K Gaussian components, each specified by a mean and full covariance matrix . The GMM is given by
3. IMPLEMENTATION (7)
In this implementation, optical imagery is considered as the reference image and both a DSM and intensity information from LiDAR form two separate floating images. Both of these are in the form of greyscale images. The orthoimagery and LiDAR data is nominally georeferenced with misregistration being assumed to extend only to components of horizontal translation. The registration flow can be seen in Figure 3.
where the kth Gaussian component is specified by and , and are the component weights, with and The term is a vector of all unknown parameters and the function denotes the normal (Gaussian) distribution (8) GMM parameters are estimated iteratively via a maximum likelihood approach using the Expectation-Maximization algorithm (McLachlan et al.,1988). A negative log-likelihood function for a data set is given by (9) This expression, Eq. 9, can be regarded as an error function. The Expectation-Maximization algorithm estimates new values for unknowns, using initial values of Gaussian Model parameters, and it sets them as initial values for the next iteration. The following update equations apply for the parameters of the mixture model:
Figure 3. Flowchart of the GWMI registration process. In the process of image registration, a “coarse to fine” strategy based on the Gaussian pyramid has been adopted to decrease computational load. Following formation of the image pyramids, the search for a maximum value of the weighted MI starts from the top pyramid level (the lowest resolution). Results are then used to set approximate values for the next highest search level, with the process continuing through to the lowest (highest resolution) level. Use of this approach successively reduces the search range at each successive pyramid level and thus greatly improves search efficiency and computation time.
(10)
where
Since the joint intensity distribution changes with the relative lateral shift of the images, formation of the joint probability distribution must accompany the transformation at each pyramid level. The joint probability can be approximated by either Parzen windowing or histogramming. Histogramming has
The main advantage of the Expectation-Maximization algorithm compared to other methods for finding maximum likelihood
305
ISPRS Annals of the Photogrammetry, Remote Sensing and Spatial Information Sciences, Volume I-7, 2012 XXII ISPRS Congress, 25 August – 01 September 2012, Melbourne, Australia
been used in this work because of its simplicity and efficiency. In histogramming, the joint histogram of intensities is employed to compute joint probability. Each entry of the joint histogram h(x, y) denotes the number of times intensity x in one image coincides with intensity y in the other image. Dividing the entries by the total number of entries yields a joint probability distribution and the probability distributions for each of the reference and floating images are separately found by summing over their rows and columns, respectively. The weight function for each joint probability is estimated via either the GMM or KDE methods. Finally, the transformation parameters are obtained once the maximum value of GWMI is found through the position of the peak in the convergence surface.
translations in X and Y. In order to define the search window for the floating image, a 10 meter horizontal perturbation (the maximum anticipated georeferencing error) was then applied within each tile. Two experimental registrations, namely registering the orthoimage with the LiDAR DSM, and the orthoimage with the LiDAR intensity image, were carried out. 4.1 Registration of the orthoimage and LiDAR DSM Figure 6 shows the procedure of registering the othoimage and LiDAR DSM image for a tile. Note that the resolution of the orthoimage is sufficiently high to clearly demarcate buildings, trees and streets, whereas these features are not as distinct in the lower resolution LiDAR DSM.
4. EXPERIMENTAL RESULTS AND DISCUSSION This section presents selected experimental results obtained with the proposed GWMI-based registration algorithm. The experimental data, shown in Figure 4, covered the Moonee Ponds area of suburban Melbourne and comprised 10cm GSD Aerial Orthoimagery acquired in April 2009, and a 1m raster LiDAR DSM surveyed in 2008 as well as LiDAR intensity data.
(a)
(c)
(b)
(d)
(e)
Figure 4. Orthoimage (top), LiDAR DSM (middle)and LiDAR intensity image(bottom) The registration of the orthoimagery and LiDAR data sets is impacted by the following factors: Firstly, they were acquired a year apart and changes had occurred within the scene, mainly in isolated buildings, but also to an extent in vegetation and roads. Secondly, the data sets were acquired at different resolutions, so the LiDAR data was resampled to 10 cm resolution. Thirdly, orthoimage is affected by occlusion, shadow and ghost image. Finally, there were small errors in the georeferencing and in the othoimage generation process, as indicated in Figure 5.
(f)
(h)
(g)
(i)
Figure 6. Orthoimage (a), LiDAR DSM image (b), joint distribution (c), GMM weight (d), KDE weight (e), 2D and 3D view of convergence surface of MI(f,h), 2D and 3D view of convergence surface of GWMI peak(g,i). Figure 5. Errors in orthoimage generation (red edge) and georeferencing (blue edge)
In the computation for the top layer of the pyramid, the LiDAR image is moved over the orthoimage and for each image movement a weight for the joint distribution is calculated. The values of MI and GWMI metrics are then plotted and the optimal translation parameters for registration are obtained at the peak of the convergence surface. The estimated shift
Due to the size of the data sets involved, the registration computation via MI and GWMI was conducted in 20 tiles of 200m by 200m,with the unknown parameters in each tile being
306
ISPRS Annals of the Photogrammetry, Remote Sensing and Spatial Information Sciences, Volume I-7, 2012 XXII ISPRS Congress, 25 August – 01 September 2012, Melbourne, Australia
parameters are then considered as initial values for the next lower layer of the pyramid, thus affording a smaller search window. As shown in Figure 6, the weight function estimated by GMM is found to be too smooth while KDE keeps details of the joint distribution. In order to estimate a detailed weight function by GMM, more Gaussian functions are required and this increases computation time. In comparison to GMM, KDE is more efficient in terms of cost of computation and level of detail. KDE has therefore been adopted as the primary method for defining the weight function.
method achieved true registration in 90% of the tiles. Although, GWMI obtained the best correspondence in the search area for most of the tiles and MI led to misalignment due to existence of local maxima, both methods failed to yield a correct registration for the tile shown in Figure 8. The main reason for obtaining incorrect result in this case is that a large area of the tile is flat and a low variation of height impacts adversely on the registration result.
The convergence surfaces for MI and GWMI at the highest level of the image pyramid are shown in Figure 6. It is noteworthy that the surface for MI has multiple peaks and it is not clear which peak is higher. Moreover, for 40% of the tiles the highest peak leads to incorrect registration parameters, whereas the peak of the GWMI convergence surface is invariably correct for 90% of the tiles. Figure 7 shows the registered data sets in a checkerboard form, which visually indicates the quality of registration.
(a)
(b)
(c)
(d)
Figure 8. Orthoimage (a), LiDAR height image (b) and 2D views of MI and GWMI peak respectively (c,d) 4.2 Registration of orthoimage and LiDAR intensity image An example of the favourable peaks for the registration of the orthoimage and LiDAR intensity image are shown for a selected tile in Figure 9. In contrast to the LiDAR DSM image, streets appeared clearly in the LiDAR intensity image, which in turn resembles an infrared image.
(a)
(b)
Figure 7. Registered orthoimage and LiDAR DSM image for a single tile(top) and enlarged view of highlighted area before registration (left), after registration (right). Identification of conjugate feature points from LiDAR data is very difficult in practise, as the LiDAR point cloud is sparse. Moreover, intensity-based image registration cannot always provide deterministic results and computation of registration errors is not always possible. Instead, alignment quality can be evaluated visually through the continuity of linear features from both images that smoothly cross the checkerboard borders, as highlighted by red circles in Figure7.
(c)
(d)
Figure 9. Orthoimage (a), LiDAR intensity image (b), 3D view of MI peak (c) and 3D view of GWMI peak (d) Although the same results for registration of the orthoimage and LiDAR intensity image were achieved by both MI and GWMI,
Registration by MI of the orthoimage and LiDAR DSM data failed for 50% of the tiles due to the appearance of multiple peaks in the convergence surfaces, while the proposed GWMI
307
ISPRS Annals of the Photogrammetry, Remote Sensing and Spatial Information Sciences, Volume I-7, 2012 XXII ISPRS Congress, 25 August – 01 September 2012, Melbourne, Australia
sharper peaks were obtained by GWMI, representing more robustness to local maximas shown in Figure10.
7. REFERENCES Chan, H., Chung,A. C. S., Yu,S. C. H., Norbash,A. and Wells III,W. M., 2003.Multi-modal image registration by minimizing Kullback-Leibler distance between expected and observed joint class histograms, In:IEEE Conference on Computer Vision and Pattern Recognition (CVPR),(2), pp.570-578.
Overall, the success rate of the GWMI registration in the test area was 92% as compared to 75% for MI, which demonstrated that the GWMI registration of imagery and range data performed well and produced accurate registration results, even in the presence of errors in the data, as indicated in Figure 11.
Chung,A. C.S., Gan,R. and Wells III,W. M., 2007. Robust Multi-modal Image Registration Based on Prior Joint Intensity Distribution and Minimization of Kullback-Leibler Distance. Report CS07-01, Hong Kong Univ. of Science & Technology. Cremers,D., Guetter,C. and Xu,C., 2006. Non-parametric priors on the space of joint intensity distributions for non-rigid multimodal image registration, In:IEEE Conference on Computer Vision and Pattern Recognition (CVPR),(2). Gu,Z., and Qin,B., 2006.Multi-modal and Multi-temporal Image Registration in the Presence of Gross Outliers Using Feature Voxel-Weighted Normalized Mutual Information, In: IEEE, Nuclear Science Symposium Conference Record, 6, pp. 3209 – 3212.
Figure 10. Profile of MI and GWMI peak in X (left) and Y directions (right).
Hassen,R., Wang, Z. and Salama, M., 2009. Multi-sensor image registration based-on local phase coherence, In: IEEEIntern. Conference on Image Processing (ICIP), pp. 181–184. Junli, L., Rijuan, C., Linpeng, J. and Ping,W., 2008. A Medical Image Registration Method Based on Weighted Mutual Information, In: The2nd Intern. Conference on Bioinformatics and Biomedical Engineering (ICBBE), pp. 2549 – 2552. Leventon,M. E. and Grimson,W. E. L., 1998. Multi-modal volume registration using joint intensity distributions,Medical Image Computing and Computer Assisted Intervention, MICCAI’98, 1496(1496), Springer, pp. 1057-1066.
Figure 11. Registered Orthoimage and LiDAR DSM data highlighting matched features (blue lines) and blunders (red lines)
Maes, F., Collignon,A., Vandermeulen,D., Marchal, G., and Suetens, P., 1997. Multimodality image registration by maximization of mutual information.IEEE Trans. Medical Imaging, (16), pp. 187–198.
5. CONCLUSION The ability of the developed weighted mutual information-based registration approach to efficiently register multi-sensor data has been highlighted in this paper. Its performance in the registration of optical imagery with both a 3D point cloud and LiDAR intensity data has been shown to be particularly impressive, and it should be recalled that such a 3D point cloudto-2D image registration cannot be readily handled by conventional feature-based or area-based methods. Based on testing involving a modest number of data sets, the authors conclude that conventional MI is unable to deliver acceptable results due to the appearance of multiple local maxima and thus multiple peaks in the convergence surface. The GWMI method, which employs a general weight function that has not been previously adopted, has been found to achieve superior registration performance. Also, the GWMI has shown that it has enough potential to produce a robust registration even in the presence of geometric perturbations in the orthoimage. The proposed approach provides more robust results than conventional MI and can be further enhanced to make it an efficient tool for automated integration of multi-sensor, multitemporal and multi-resolution remote sensing data for a wide range of applications.
Maes, F., Vandermeulen, D. and Suetens, P., 2003. Medical image registration using mutual information. In: Proceeding of IEEE, (10), pp. 1699–1722. McLachlan,G. J. and Basford,K. E., 1988. Mixture Models: Inference and Applications to Clustering. Marcel-Dekker. Roche,A.,Malandain, G., and Ayache,N.,2000. Unifying maximum likelihood approaches in medical image registration, International Journal of Imaging Systems and Technology,11(1), pp. 71-80. Silverman, B.W., 1998. Density Estimation for Statistics and Data Analysis. London, Chapman& Hall/CRC. So, R. W. K. and Chung,A. C. S., 2011. Learning-based Nonrigid image registration using prior joint intensity distributions with Graph-Cuts, In:The 18th International Conference on Image Processing, (ICIP’11), Brussels, Belgium, pp. 717 – 720. Viola,P. A., 1995.Alignment by maximization of mutual information, Intern. Journal of Computer Vision, pp. 16–23. Zöllei,L., Jenksinon,M., Timoner,S. and Wells III,W.M., 2007. A marginalized MAP approach and EM optimization for pairwise registration, In:Information Processing in Medical Imaging (IPMI), (4584), pp. 662-674.
6. ACKNOWLEGMENT The authors would like to thank the Victorian Department of Sustainability and Environment (www.dse.vic.gov.au) for providing the LIDAR data and orthoimagery for this research.
308