International Journal of Computing & Information Sciences
Vol. 12, No. 1, September 2016
75
Automatic Fall Detection System using Sensing Floors Mohamad Daher, Ahmad Diab, Maan El Badaoui El Najjar, François Charpillet and Mohamad Khalil Pages 75 – 82
DOI: http://dx.doi.org/10.21700/ijcis.2016.110
Automatic Fall Detection System using Sensing Floors Mohamad Daher, Maan El Badaoui El Najjar CRIStAL, UMR 9189, 59650 Villeneuve d'Ascq, France. Lille University - Science and Technology
[email protected],
[email protected]
Mohamad Daher ULF - Université de Technologie et de Sciences Appliquées Libano-Française, Deddeh-Lebanon
[email protected]
Ahmad Diab, Mohamad Khalil Azm research center in biotechnology, EDST, Lebanese University, Lebanon. CRSI research center, Faculty of Engineering, Lebanese University, Lebanon
[email protected],
[email protected]
François Charpillet Inria, Villers-lès-Nancy, F-54600, France CNRS, Loria, UMR nº 7503, Vandœuvre-lèsNancy, F-54500, France. Université de Lorraine, Loria, UMR nº 7503, Vandœuvre-lès-Nancy, F-54500, France franç
[email protected]
Abstract: Automatic fall detection is a major issue in taking care of the health of elderly people and has the potential of increasing autonomy and independence while minimizing the risks of living alone. It has been an active research area due to the large demand of the healthcare association for fall detection goods. Fortunately, due to the recent fast progression in sensing technologies, fall detection system becomes prospective. It permits to monitor elders and detect their falls, and consequently provides emergency support whenever needed. This paper describes the current work of detecting falls in independent living apartments using accelerometer concealed under tiles. We present the up-to-date advancement of data collection, feature extraction, feature selection, and signal changing detection, which are essential phases of this work. Keywords: Changing Detection; Elderly Fall Detection; Feature Extraction and Selection; Sensing Floor. Received: July 30, 2016 | Revised: August 10, 2016 | Accepted: August 25, 2016
1. Introduction The demographic changes related to the increasing numbers of elderly people living alone are leading to a significant change in the social and economic structure [1]. Driven by falling fertility rates and a sustained increase in overall longevity of people resulting of advances in medicine and public health services, many countries; especially in the developed world; are now refreshing themselves for the fact that their fastestgrowing demographic is the over 80 years old. Furthermore, the linear trend that life expectancies have followed for over a century is carry on increasing. Elder People (here referred aged 65 years or more), are estimated to attain around 30% of the population in the next 30 years [2]. Those people prefer growing old at home and saving their free lifestyles that often come
generally with high risks. Actually, 61% of accidents occur at homes and 85% of them are due to falls. They have around 10,000 deaths each year. However, obtaining a rapid support after a fall decreases the risk of death by 80% [3]. Therefore, many supportive technologies and systems have been developed to track elderly persons and monitor their activities of daily living in order to allow them to age comfortably at home. The use of sensing floors in ambient intelligence began in the late 1990’s, with projects like the Magic carpet [4] by Paradiso et al., and the Smart floor [5] by Orr and Abowd. Besides, the first approach to fall detection using accelerometer was developed in 1998 by Williams et al. [6]. Some sensing floors are already commercially available today, like the FloorInMotion [7] and the SensFloor [8]. But generally, Most of these
76
International Journal of Computing & Information Sciences
systems have their own limitations and do not ensure 100% precision [9]. The proposed project aims to offer a friendly-user and effective system, without disturbing elders in their daily living lifestyles.
Vol. 12, No. 1, September 2016
can be profitably of this database to detect elder falls that represents our main objective.
2.1 Data (1) Synthetic signals: A synthetic database with a
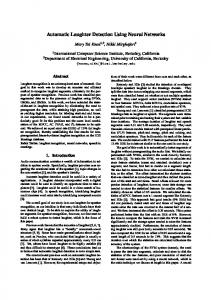
This paper describes a novel approach of automatic fall detection system using ground sensors network. This choice is selected for the advantage of the nondisturbing of elder due to the hiddenness of the sensors. For this propose, a smart apartment consists of (kitchen, bathroom, bedroom and living room), with several smart and connected devices was built within INRIANancy. It was covered with a ground sensors network composed of 104 tiles (60*60 cm). Each tile is equipped with an accelerometer and four force sensors positioned at each corner “Figure 1”.
Gaussian noise has been generated. It is composed of 200 different observations and 30 parameters that are around a constant value (c) and the value (c±∆) for the first and second class respectively. "∆" (delta) is the difference between the two classes representing main two states of this work: falling and non-falling. (2) Real signals: The sensing floor generates data that can be passed to a data processing software either as a recorded .txt file, or through a ROS publisher/listener interface. The software treats the data packets sent regularly by the tiles every 20 milliseconds. The format of the accelerometer data sent by each tile is as follows:
Table 1– Accelerometer data format.
Figure 1. The INRIA-Nancy smart apartment is at the left and the smart tile is at the right.
Each smart tile communicates with its neighbors and any agent laid on it using wireless technology [10]. Consequently, tiles can be exploited to extend mediators’ communications and perceptions (of robot or human) [11,12]. A cartography of this apartment composed of smart tiles with their identifiers is showed in “Figure 2”.
2.2 Methods The database is fragmented into fall and non-fall fragments to obtain two different classes, and then we proceed to do the windowing of each signal in each class. From each window, we extract some useful parameters and then select the most pertinent of them in order to be used to separate between the two states: falling and non-falling. The accelerometer data processing is shown in “Figure 3”.
Figure 2. A cartography of the tiles composing the sensing floor, with their identifiers.
The positions of the sensors are indicated by red points. The walls are shown in black. The tiles under the furniture (sleeping room, toilet, and the kitchen) have been left unequipped with sensors, and are shown in grey color.
2. Materials and Methods From the signals generated by the accelerometers under the tiles, a set of parameters are extracted to build our database. Furthermore, artificial intelligence techniques
Figure 3. Data processing.
(1) Data fragmentation: For each normal Activity of Daily Living (ADL) and fall actions, the start and the end have been marked based on the videos and the pictures taken from RGB-D cameras. (2) Windowing: The signal is divided into smaller time slices called windows of fixed length and with a
77
Automatic Fall Detection System using Sensing Floors fixed overlap size with previous and next windows [13]. The size of each window and the overlap have been found through preliminary experiments as 50 samples (sampling frequency = 50) and 25 samples, which correspond to 1 second and 0.5 second respectively. (3) Feature Extraction: We have extracted all linear and non-linear features from each window. Features have to be carefully selected to get a more descriptive and usually smaller output dataset [14]. a) Linear features i) Features related to power spectral density: By using the power spectral density (PSD), several variables were calculated such as: mean frequency MPF [15], peak frequency PF [16,17], deciles D1 · · · D9 [12] that contain the median frequency D5 [17,18,19]. Deciles divide the power spectral density into slices holding 10% of total energy.
0.1
(1)
ii) Parameters extracted from wavelet packet decomposition: The wavelet packet transforms of a signal from the time domain into frequency. Several families exist in wavelets such as Haar, Daubechies, and Symlets which is used in our work. Each window signal is split into an approximation and a detail coefficient that are divided afresh into a second-level approximation coefficients and detail coefficients, and so on [20]. The approximations correspond to smoothed versions of the low-pass filtered signal, and the details contain only the information of high frequencies or discontinuities. Finaly, we calculate the variances on the following details levels 2, 3, 4, 5 and 6 (named W1, W2, W3, W4 and W5) and then used these variances for classification [21]. b) Non-linear parameters i) Time reversibility: The time reversibility tests if the process dynamics stay well-defined when reversing the time-states' sequence. The TR characteristic of a window signal x is then calculated as following:
∑
(2)
where N is the length of window signal and delay. For more details see [21]).
is the time
ii) Lyapunov Exponent: The Lyapunov Exponent (LE) examines the sensibility and the stability on original system states. It measures the trajectory separation rate between adjacent tracks in phase space [22,23]. In this work, we have used the “(3)” to calculate LE described in [22]:
lim lim →
∥∆
∥→
log ∥ ∆ ∥ / ∥ ∆ ∥
(3)
where ∥ ∆ ∥ represents the Euclidean distance between two states of the system to an arbitrary time ,
and ∥ ∆ ∥ corresponds to the Euclidean distance between the two states of the system at a time later t. iii) Sample Entropy: Sample Entropy (SE) is used to identify the regularity of signals. We have used the Sample Entropy defined in [19] in this work. For a time series x which represents a signal of length N and patterns aj 0, … , 1 of length m, with m 0, … , 1; ; < N, and 0, … , , the time series x in a time t = ts, x (ts,..., ts+m−1) as a match for a given pattern aj, if | | 0 . Sample Entropy is then computed as follows: ,
log log
:
0 ∧ :
0 ∨
0
(4) 0
where N, m, r and Cm represent, respectively, the length of the time series, the length of sequences to be compared, the tolerance for accepting, and the number of pattern matches. “m” is determined by the method of the false nearest neighbors (FNN) and “r” is equal to 0.2 according to the collected works [19]. (4) Feature Selection: Aims to find the most relevant
features of a classification problem. It is very helpful in improving computational speed and prediction precision. Several feature selection methods have existed in literature (SFS, ReliefF, F-score, etc.), and each one has pros and cons [24]. We introduce and theoretically examine in this paper a new proposed method called Histogram Comparison Method (HCM). a) SFS: Is the first method proposed in 1963 by Marill and Green for features selection. SFS starts with an empty data set and proceeds by expanding the data set with the feature, of which addition to the data set boosts the wrapped model performance most. The algorithm adds features in such manner recursively until a stopping criteria is met [25]. b) ReliefF: Aims to estimate the quality of features according to how well their values separate the instances according to their distance in the problem space. For a set of selected instances, the algorithm searches for the k nearest neighbors from the same class and k nearest neighbors from each of the other possible classes. The algorithm updates the feature quality information by accumulative its value if the feature separates instances with different classes well and by reducing its value in the reverse scenario [26]. c) F-score: Offers an effective criterion based on statistic characteristics to measure the discrimination ability of each feature. It is simple and independent of the classifiers. F-score of a feature (i) is given by:
78
International Journal of Computing & Information Sciences 2
F(i) =
1 1
∑
1
,
2
Vol. 12, No. 1, September 2016
2
1 1
∑
1
,
2
0.7
(5)
ReliefF Error Rate
0.6
F−score Error Rate HCM Error Rate
where , and are are the averages of the ith feature of the positive, negative and whole datasets. , and , are the ith feature of the kth positive instance and the ith feature of the kth negative instance. Features with higher F-score value are selected [27].
d) HCM: Is a new filter model which calculates the discriminative ability of each feature separately, and it is favorable for two-class classification problems. The HCM algorithm is: An instance is represented by a vector composed of m features values. Starting from the most upper value to the lowest value of the feature with a static threshold. For each step, we count the difference between the numbers of instances belong the two classes that are above the threshold (i.e. d(Pi)). After that, we accumulate the different values of d(Pi) denoted Score value. The feature that has the greater Score value is the most relevant for classification. HCM is computed as the follows:
∑∑
|
| (6)
where and are the number of instances that are above the threshold and belong the first and the second class respectively. (5) Signal change detection: Is the ability to detect that
a change occurred on the characteristics of a signal and making some inference about the actual time of change. Most detection algorithms are based on statistical revealing and hypothesis testing [28]. In our application, we developed a simple algorithm to detect the characteristic change of a signal and notice that a person is falling down after he/she was walking, sitting, or standing. The change point identification is the time that a change may have occurred.
Error Rate
0.5 0.4 0.3 0.2 0.1 0 0.1
0.2
0.3
0.4
We started testing our method to select the discriminative parameters on synthetic data and evaluate its efficiency compared to well-known methods in literature. After that we will show the results of parameters extraction and selection and change detection on real data.
3.1 Results on synthetic data We try to test the efficiency of HCM regarding its efficiency to select relevant features and its computation time. The proposed method shows a good accuracy in relevant features selection. The error rate ratio is around 1% which is clearly lower than ReliefF (30%) and F-score (12%), for (∆ greater than 0.4. This result is presented in the “Figure 4”.
0.7
0.8
0.9
1
Figure 4. Error Rates Comparison among ReliefF, F-score, and HCM.
In addition, we have been noticed that the computation time of HCM (0.03 s) is less than the ones of ReliefF (0.05 s) and F-score (0.045 s). Therefore, this method can be used in some applications where the time latency is awkward. These results are taken from a machine Intel® Core™ i5-3317U CPU @ 1.70 GHz (4 CPUs), ~ 1.7 GHz with 4 GB RAM.
3.2 Results on real data The objective of the proposed system is to discriminate between falling and non-falling states using the accelerometer under the tiles. Upon this aim, six persons (one young, four adults, and one elder) were participated to make ten different scenarios repeated five times. These scenarios contain the different activities: walking, sitting, standing, and falling. Activities were made with different ways like soft and hard falls, fast and slow walking, falling from sitting and falling from walking, etc. Our aim is to detect the signal changing when fall occurs on time. It’s easy to see the signal change in the “Figure 5”. These signals are normalized before being drawn. 0.1
3. Results
0.5 0.6 Delta
Falling
Accelerometer Signal
0.05
0
−0.05
−0.1
0
1000
2000
3000
4000
5000
6000
7000
8000
9000
10000
Samples
Figure 5: Accelerometer signal
After that, we extract some useful parameters from the original signals that can be used in our system in order to improve the performance regarding the computational speed and the prediction accuracy. “Figure 6” shows some extracted parameters that can be used in the proposed system.
79
Extracted Parameters
Automatic Fall Detection System using Sensing Floors
1 2 3 4 5 6 7 8 9 10 11 12 13 14 15 16 17 18 19 20 50
100
150
200
250
300
Windows Falling down estimated time
Figure 6. Extracted Parameters (1: TR, 2: DFA, 3-7: Wavelet Packet decomposition parameters, 8: MPF, 9-18 Decil, 19: SE, and 20: LE).
One can see that most of extracted parameters have a peak in case of fall. Therefore, we took one of the most relevant features and then we detect the change in case of fall using a simple detection method. “Figure 7” shows the signal in (a), and the fall detection represented by the changing point identification with a good accuracy in (b). 1000 Signal
500 0 −500
0
50
100
150 (a)
200
250
300
Falling! The Changing Point Identification is 127 1 Falling detection
0.5
0
0
50
100
150 (b)
200
250
300
Figure 7: Changing detection of a signal.
Figure 8: Accelerometer signals’ shapes for different postures.
Hence, using only an accelerometer concealed under tiles, the proposed system can easily differentiate between falling and non-falling states “Figure 9”. So, we can monitor elder activities and automatically detect the falling cases in their own living apartment.
Using such parameters instead of the original signals can reduce the dataset size and consequently improve the efficiency of our system. Several scenarios with different subjects have been realized but only five examples are presented in “Figure 8” due to lack of space. Figure 9. Falling and non-falling decision state.
80
International Journal of Computing & Information Sciences
4. Discussion Firstly, we presented the aging population problem and the advances in medicine and public health services to monitor the ADL of elders at home in order to support their independency. Secondly, we used the accelerometer of the INRIA sensing floor to build the dataset used in our system. Thirdly, we extracted many parameters from accelerometer signals. These parameters are stored in a smaller output dataset that are used in our work in order to increase the efficiency of the proposed system. Fourthly, we introduced a novel, and efficient algorithm “HCM” to select the most relevant features. Results show a good efficiency in both accuracy and computation time comparing to well-known methods in literature. Then, we apply a signal detection algorithm on the most pertinent feature to detect the signal’s changing in case of fall. Finally, as a perspective, we will try to use the force sensors to locate, track elder, and recognize their activities.
5. Conclusion and future work This paper described our up-to-date progress on automatic fall detection system using sensing floors. A novel approach was presented that tackle problems such as efficiency, accuracy and usability in fall detection systems. The next contribution of this work is to fuse the dataset collected from the accelerometers with force sensors data sources to get profit in determine the all ADL states. Furthermore, merging multi-sensing data with prediction technologies such as artificial intelligence and machine learning will encourage to develop intelligent fall prevention system [29]. Finally, the proposed system has a little high cost especially for the old apartment, but the price of sensors is rapidly decreasing, making it feasible to implement such system. The great challenge of this project is to provide a friendly-user and effective system that doesn’t affect elderly daily living patterns.
Vol. 12, No. 1, September 2016
[2] “Aging, can we stop the clock?", Welcome Trust
Report (http://www.wellcome.ac.uk/). [3] J.A. Stevens., Falls among older adults: risk
factors and prevention strategies. Journal of safety research 36.4 (2005): 409-411. [4] J. Paradiso, et al. "The magic carpet: physical
sensing for immersive environments." CHI'97 Extended Abstracts on Human Factors in Computing Systems. ACM, 1997. [5] R. J. Orr and G. D. Abowd. “The smart floor: a
mechanism for natural user identification and tracking”. In: CHI’00 Extended Abstracts on Human Factors in Computing Systems, pp. 275276. ACM, 2000. [6] G. Williams, K. Doughty, K. Cameron, & D. A.
Bradley, (1998, October). "A smart fall and activity monitor for telecare applications". In Engineering in Medicine and Biology Society, 1998. Proceedings of the 20th Annual International Conference of the IEEE (Vol. 3, pp. 1151-1154). IEEE. [7] Tarkett.FloorInMotion.url:http://www.floorinmot
ion.com/. [8] C. Lauterbach, A. Steinhage, and A. Techmer.
"Large-area wireless sensor system based on smart textiles." International Multi-Conference on Systems, Sygnals & Devices. 2012. [9] V. Spasova and I. Iliev, Computer Vision and
Wireless Sensor Networks in Ambient Assisted Living: State of the Art and Challenges, Journal of Emerging Trends in Computing and Information Sciences, vol. 3, no. 4, 2012, pp. 585595. [10] M. Daher, et al., Towards a usable and an efficient
elder fall detection system. 2015 International Conference on Advances in Biomedical Engineering (ICABME). IEEE, 2015. [11] N. Pepin, O. Simonin, and F. Charpillet,
Intelligent Tiles-Putting Situated Multi-Agents Models in Real World, ICAART. 2009.
References [1] L. Atallah, et al., Wirelessly accessible sensor
populations (WASP) for elderly care monitoring. 2008 Second International Conference on Pervasive Computing Technologies for Healthcare. IEEE, 2008.
[12] G. Sannino, I. De Falco, and G. De Pietro,
Automatic Extraction of an Effective Rule Set for Fall Detection for a Real-Time Mobile Monitoring System. Developments in eSystems Engineering (DeSE), 2013 Sixth International Conference on. IEEE, 2013. [13] M.
Andries, F. Charpillet, and O. Simonin, Localisation of humans and objects interacting on
81
Automatic Fall Detection System using Sensing Floors load-sensing floors, IEEE Sensors Journal 16, no. 4 (2016): 1026-1037. [14] Y. S. Delahoz, and M. A. Labrador, Survey on fall
detection and fall prevention using wearable and external sensors. Sensors14.10 (2014): 1980619842. [15] J. Terrien, T. Steingrimsdottir, C. Marque, and B.
Karlsson, Synchronization between EMG at different uterine locations investigated using time– frequency ridge reconstruction: comparison of pregnancy and labor contractions, EURASIP J. Adv. Signal Process. 2010, 1–10 (2010). [16] W.L. Maner, R.E. Garfield, H. Maul, G. Olson, and
G. Saade, Predicting term and preterm delivery with transabdominal uterine electromyography. Obstet. Gynecol. 101(6), 1254–1260 (2003).
[23] T. Ivancevic, L. Jain, J. Pattison, A. Hariz, et al,
Preterm birth analysis using nonlinear methods. Recent Patents Biomed. Eng. 1(3), 160–170 (2008). [24] H.H. Hsu, C.W Hsieh, and M.D Lu, Hybrid
feature selection by combining filters and wrappers, Expert Systems with Applications 38.7 (2011): 8144-8150. [25] G.H. John, R. Kohavi and K. Pfleger, Irrelevant
Features and the Subset Selection Problem, Proceedings of the Eleventh International Conference on Machine Learning, 1994, 121–129. [26] I. Kononenko, Estimating Attributes: Analysis
and Extensions of RELIEF, European Conference on Machine Learning, 1994, 171–182. [27] Y. W. Chang, and C. J. Lin., Feature ranking
[17] J. Sikora, A. Matonia, R. Czabanski, K. Horoba, J.
Jezewski, and T. Kupka, Recognition of premature threatening labour symptoms from bioelectrical uterine activity signals, Arch. Perinat. Med. 17(2), 97–103 (2011). [18] C. Marque, H. Leman, M.L. Voisine, J. Gondry,
and P. Naepels, Traitement de l’électromyogramme utérin pour la caractérisation des contractions pendant la grossesse, RBM-News 21(9), 200–211 (1999). [19] G. Fele-Žorž, G. Kavšek, Ž. Novak-Antoliˇc, and F.
Jager, A comparison of various linear and nonlinear signal processing techniquesto separate uterine EMG records of term and pre-term delivery groups. Med. Biol. Eng. Comput. 46(9), 911–922 (2008). [20] M. Y. Gokhale, & D. K. Khanduja, (2010). Time
domain signal analysis using wavelet packet decomposition approach. Int'l J. of Communications, Network and System Sciences, 3(03), 321.
using linear SVM. WCCI Causation and Prediction Challenge. 2008. [28] M. Basseville, and I. V. Nikiforov. Detection of
abrupt changes: theory and application. Vol. 104. Englewood Cliffs: Prentice Hall, 1993. [29] M. Dibitonto, et al., Fusion of Radio and Video
Localization for People Tracking. AmI. 2011. Mohamad Daher received the teaching diploma degree in applied mathematics, option informatics from Lebanese university, Tripoli, Lebanon, in 2002, and the Master’s degree in computer science, option networking and communications from the University of Balamand, Al Kurah-Lebanon, in 2004. He is currently pursuing the Ph.D. degree in signal processing and control systems at Lille University - Science and Technology, CRIStAL laboratory, Lille, France. He joined the Université de Technologie et de Sciences Appliquées Libano-Française (ULF) in 2005 as instructor and academic advisor.
[21] D. Alamedine, M. Khalil, and C. Marque,
Comparison of different EHG feature selection methods for the detection of preterm labor. Computational and mathematical methods in medicine 2013 (2013). [22] A. Diab, M. Hassan, C. Marque, and B. Karlsson,
Quantitative performance analysis of four methods of evaluating signal nonlinearity: application to uterine EMG signals. Presented at the 34th Annual International IEEE EMBS Conference. San Diego, USA (2012).
Ahmad Diab received the degree in Biomedical Engineer from the Islamic University of Lebanon, Khalde, Lebanon, in 2010, and the M.Sc. degree in Medical and Industrial Processing and System from the Lebanese University, Tripoli, Lebanon, in 2011. Also he received his Ph.D. degree from the University of
82
International Journal of Computing & Information Sciences
Technology of Compiègne, Compiègne, France and Reykjavik University, Reykjavik, Iceland in 2014. He is currently an associate Professor at Azm center for research in biotechnology and its application, Lebanese University.
Maan El Badaoui El Najjar received the computer engineering degree from ESISAR – INP Grenoble- France in 1999. He graduated from ENSIEG – INP Grenoble in 2000 (Master of Science degree in Control System). He received the Ph.D. degree in Perception and Control Systems from the University of Technology of Compiegne in 2003. He obtained the Habilitation à Diriger des Recherches from the University of Lille in November 2011. Prof. El Badaoui El Najjar joined the University of Lille in 2005 as a permanent associate Professor. Since 2014, he is Full Professor at the University of Lille. He is also with the CRIStAL Laboratory UMR 9189, a joint research unit between CNRS, University of Lille and Ecole Centrale de Lille. He is also the head of the DiCOT Team “Diagnostic, Control and Observation for fault Tolerant Systems” of the CRIStAL Laboratory. His current research has been focused on Multi-sensors fusion, Multi-robots systems, and Fault tolerant systems.
François Charpillet received his engineering degree from École Nationale Supérieure d’Électricité et de Mécanique (ENSEM) of the National Polytechnic Institute of Lorraine (INPL) in 1982. He received the M.S. and Ph.D. degree in computer science from Henri Poincaré University, Nancy, France, in 1982 and 1985 respectively. After a period as an engineer at Direction des Constructions Navales (DCN) in Paris, he joined the University of Lorraine and LORIA Lab as an assistant professor in 1987. In 1988, he got a research position at Inria Nancy - Grand-Est Research Center. Prof. Charpillet is today Director of Research at Inria. He has been the leader of LORIA team MAIA, which was a joint research group with Inria, CNRS and University of Lorraine from 1998 to 2014. This group was interested in Artificial Intelligence focusing on autonomous agents and multi-agent systems. Since 2015, he is the scientific leader of the new Inria team Larsen, focusing on Long Term Robotics, Human-robot interaction and Active and Distributed sensing. His current research interests concern multi-robot cooperation, human-robot- environment interaction, activity recognition, active sensing and ambient Intelligence.
Vol. 12, No. 1, September 2016
Mohamad Ali Khalil received an engineering degree in electrical and electricity from the Lebanese University, faculty of engineering, Tripoli, Lebanon in 1995. He received the DEA in biomedical engineering from the University of Technology of Compiegne (UTC) in 1996. He received his Ph.D. from the University of Technology of Troyes in 1999. He received the Habilitation à Diriger des Recherches from UTC in 2006. He is currently teacher and researcher at Lebanese University, faculty of engineering. He is classified Professor in 2008. From 2009, he is director of the Azm center for research in biotechnology at the doctoral school of sciences and technology at the Lebanese university. He is the chair of the EMBS chapter in Lebanon and also the chair of ICABME international Conference in 2011, 2013 and 2015. He organized many conferences in the Lebanese university. Prof. Khalil was received many awards: Best supervisor 2004 and 2005 from LIRA, Best innovation project from LASeR and AUF in 2013, and Best applied research project from ministry of industry 2014. His current interests are the signal and image processing problems: analysis, detection, classification, representation and modeling of nonstationary signals. Number of publications: 45 articles in international Journals, 100 participations in conferences.