An Automatic Fall Detection Framework Using Data Fusion of Doppler Radar and Motion Sensor Network Liang Liu, Student Member, IEEE, Mihail Popescu, Senior Member, IEEE, Marjorie Skubic, Senior Member, IEEE, Marilyn Rantz, Member, IEEE
Abstract— This paper describes the ongoing work of detecting falls in independent living senior apartments. We have developed a fall detection system with Doppler radar sensor and implemented ceiling radar in real senior apartments. However, the detection accuracy on real world data is affected by false alarms inherent in the real living environment, such as motions from visitors. To solve this issue, this paper proposes an improved framework by fusing the Doppler radar sensor result with a motion sensor network. As a result, performance is significantly improved after the data fusion by discarding the false alarms generated by visitors. The improvement of this new method is tested on one week of continuous data from an actual elderly person who frequently falls while living in her senior home. I.
INTRODUCTION
In the USA, falling increases the risk of death among elders above the age of 65. Over the past decade, the death rate triggered by falls among seniors is growing quickly [13]. The positive outcome closely relates to the fast response and medical intervention from the informed nursing personnel after the occurrence of a fall [4]. It has been reported that 90 percent of adults over the age 65 prefer to stay in their residence as they age [5]. With the new research trend on technologies, “aging in place” enables the senior to live at home independently as long as possible. The interdisciplinary researchers from the University of Missouri [6] have developed noninvasive technologies to support a local community aging in place, Tiger Place. Research from this community has promising results, including studies with smart carpet, video camera, depth image, infrared cameras and microphone arrays [7-11]. Among those technologies, the automatic fall detection system provides those in independent living with a possible alert system with a lower healthcare costs [12]. Some of the researchers have focused on the fall detection system with the visual based system and obtained good results, even under some extreme situations, such as light changing, furniture occlusion, etc. However, resident privacy may be
an issue to overcome. The visual system could not report a lethal fall if the fall occurs in the bedroom, bathroom or closet, where the residents are reluctant to be visually monitored. The motion based system addresses the concern about privacy protection and wider detection range coverage. One example of motion sensor implementation is the Doppler radar. The Doppler radar can sense, track, and recognize moving objects and surveillance human activity. It has been successfully applied to extract velocity and stride length for measuring gait parameters in [13-15]. The Doppler radar can detect falls by producing specific signatures for various part of falling human body. The previous works have shown encouraging performance of the fall detection system with Doppler radar ($50/radar unit) in laboratory with different radar sensor displacement [16-18]. Another example is the passive infrared sensor (PIR) motion sensor network that has been used at TigerPlace since 2005. It reports the absent or present of the resident at a certain location in the home. Its application concentrates on the life style pattern of seniors to tell the physical and cognitive health conditions and find the deviate from the norm pattern [19]. The older adult activity pattern is represented with an activity density map. The map computes the density d with the number of all motion hits s during an hour divided by time at home during that hour t, which is d=s/t. If there is a continuous motion detected, sensors will generate an event in every 7 second. In this paper, an improved fall detection framework is proposed by fusing the radar sensor and the PIR motion sensor networks in the home of an older adult, who is an actual faller. As the conclusion in [18], the radar sensor is placed on the ceiling for a better detection. We also propose different data fusion schema to eliminate possible false alarms. The paper is organized as follows. Section II introduces the methodology. We present results in section III and give conclusion and ongoing work in section IV. II. METHODOLOGY
This project was supported by grant R01HS018477 from the Agency for Healthcare Research and Quality (AHRQ). The content is solely the responsibility of the authors and does not necessarily represent the official views of the AHRQ. Liang Liu and Marjorie Skubic are with the Electrical and Computer Engineering Department, University of Missouri, Columbia, MO 65211 USA (e-mail:
[email protected],
[email protected]). Mihail Popescu is with the Health Management and informatics Department, University of Missouri, Columbia, MO 65211 USA (e-mail:
[email protected]). Marilyn Rantz is with the Sinclair School of Nursing, University of Missouri,Columbia, MO65211 USA(e-mail:
[email protected]).
978-1-4244-7929-0/14/$26.00 ©2014 IEEE
Our aim is to detect falls of the elderly resident with higher accuracy, especially for the case when the resident is alone. The Doppler radar sensor is sensitive to motion mainly when there are visitors in the apartment, such as repairman, housekeeper, family, friends, etc. Those high energy activities add noise to the resident’s activity data and generate false alarms in the fall detection algorithm.
5940
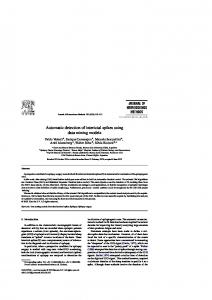
A. Motion sensors placement in the home environment We have deployed ceiling radars in six different apartments in Tiger Place. The typical floor plan of a TigerPlace apartment is shown in figure 1. There are seven motion sensors (located at the end of each cone of blue lines) and one Doppler radar facing down to the floor (marked by a red cross in figure 1) placed above the ceiling at the center of the living room and dining room. The detection range of the radar is about 6 and the height of the room is about 3 m. The data logger for each sensor is synchronized with the same data server in Tiger Place.
C. Description of Doppler radar sensor features For the Doppler radar sensor signal segment , we first take the short time Fourier transform (STFT) by ∑ . (1) Then, we compute the spectrogram by taking the magnitude square to the STFT, . (2) Next, we calculate the energy burst curve using ∑ , (3) and smooth the curve over K bursts to reduce noise: ̂ ∑ . (4) The peaks on this curve are the located potential falls. More detailed examples are presented in [18]. We extract MFCC features for each 2-second window which contains the located possible fall activities. Each of the 2-second window data segment is divided into 166 subframes with an overlap rate of 0.5. Seven coefficients are extracted from each sub-frame. After throwing the dominant coefficient away, we use 6166=966 MFCC features to represent this potential fall. The radar signatures are classified by support vector machine (SVM) into two classes: fall and non falls. We employed LibSVM [18] to produce a score, fall confidence . For computational efficiency, we used only a linear kernel for SVM in all our experiment. We generate a receiver operating characteristic (ROC) curve by thresholding the SVM scores to evaluate the performance of our fall detection algorithms. D. Data fusion schema The output from above Doppler radar system are in the form of a radar fall confidence associated with the corresponding time stamp . The sensors in the motion sensor networks are installed above the door of each room and the main facility area, such as kitchen, bathroom, and closet. An event from the motion sensor network means someone is moving around the sensor. A fall is unlikely to occur if an event from a motion sensor is recorded immediately after it. Figure 3 illustrates the idea of this assumption. The represents the time lapse between and the afterwards closest event time stamp . It is defined as . A predefined parameter is used to determine whether the is among the reasonable range for a real fall. If the time lapse is shorter than , it is a false alarm. Otherwise, it is a fall. The rule is represented by
Fig. 1. The floor plan with motion sensors placement in a senior apartment.
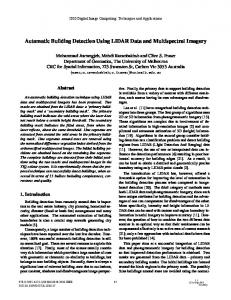
Fig. 2. Activity density map.
B. Activity density map generated by the sensor network In the resident activity density map shown in figure 2, the x-axis represents days from left to right and y-axis denotes hours in a day. Each color represents the different motion density levels. The black on density map means that the resident is away from home. The white represents very low density. The color bar illustrates the density range from 50~99 events/h to >550 events/h using different color blocks from gray to blue sequentially.
{
Fig. 3. Data fusion schema between Doppler radar and sensor network.
5941
(5)
E. Description of data collected by ceiling radar The experimental data includes training data from stunt actors and the continuous testing data from the elderly adult home. Due to the large dataset and limited space, only one week’s data from an actual elderly person who frequently falls are presented in this paper. The dataset in Table I was collected with ceiling radar at senior apartments in TigerPlace. The stunt actor came to senior apartments monthly to perform different types of falls and non-falls. The falls performed were 21 types including lose balance, lose consciousness, trip & fall, reach & fall in different directions - forward, backwards, left side, right side falls, and fall from couch. Non-falls were also collected of daily activities that could be easily confused with fall activities and cause false alarms in fall recognition, such as bending down to pick up from floor, drop stuff on the floor, sit down on floor, kneel down to tighten the shoe, etc. T ABLE I. STUNT ACTOR DATASET Environment Fall # Non-fall # Tiger Place
72
98
1 0.9 0.8 0.7 0.6 0.5 0.4 0.3 0.2 0.1 0
(b)
1
Figure 4 (a) shows that a fall is recognized by the radar with a confidence 0.96. No event is reported from the sensor network in the following 55 seconds. Figure 4 (b) presents the typical false alarms from the senior daily activities: fast opening and closing the door near to ceiling radar (0.98 fall confidence); fast turning around and shifting the walker direction (0.83 fall confidence). Multiple events from sensor network after Non-fall-2 reflect that the resident is active or a visitor is in the apartment. Although the motion is not frequent after Non-fall-2, this false alarm can be still removed with a larger value.
Fall-2
03-Nov-2013 12:17:21
03-Nov-2013 12:22:21 03-Nov-2013 12:23:21 03-Nov-2013 12:24:21
B. Leave-one-out cross validation for the stunt actor dataset collected with ceiling Doppler radar sensor The leave-one-out cross validation is applied on the stunt actor data in Table I. For N=170 samples, each experiment of this validation uses N-1 samples for training and the rest sample for testing. In figure 5 we show the classification results of the radar signature library (see Table I) where we achieved an area under the ROC curve (AUC) of 0.98. While good results were obtained on the signature library, we couldn’t replicate them on the continuous datasets.
A. Improving the performance by including the sensor network In figure 4, the blue solid line gives the fall confidence generated by Doppler radar fall detection system. The red dotted line presents the event activated by the sensor network. The x-axis denotes the timestamp for both of the sensor system.
(a)
Non-fall-2
Fig. 4. The examples fall confidence with events from the sensor network: (a) a natural fall (top); (b) non-fall (bottom).
III. EXPERIMENTAL RESULTS
1 0.9 0.8 0.7 0.6 0.5 0.4 0.3 0.2 0.1 0 03-Nov-2013 12:16:21
Non-fall-1
0. 8
AUC = 0.98
true positive rate
0. 6 0. 4 0. 2 0 0
0. 2
0. 0. 0. false 4 positive6 8 Fig. 5. The cross validation rate of the stunt actor dataset.
1
C. Data fusion results for the actual faller Using the above stunt actor data for training, we tested our fusion method on one week of continuous data collected in a TigerPlace apartment. In figure 6, the false alarm number reduces 63% false alarm while the parameter is increasing from 0 to 53 seconds (from right to left). Without the motion sensor network, the fall detection system generates 172 false alarms per day in order to detect all the actual falls. The best performance of the improved system could achieve 62 false alarms per day without losing any falls when equals to 53 seconds. If the is larger than 53 second, the false alarm keeps decreasing but there will be some missing falls.
03-Nov-2013 12:18:21
5942
1
ACKNOWLEDGMENTS
0.9 0.8 0.7 0.6
Detection rate
0.5 0.4 0.3 0.2 0.1 0
0
20
40
60
80
100
120
140
This work was supported in part by the Agency for Healthcare Research and Quality under grant R01-HS018477 (Rantz, PI). The content is solely the responsibility of the authors and does not necessarily represent the official views of the Agency for Healthcare Research and Quality.
Delta 0 Delta 1 Delta 2 Delta 3 Delta 4 Delta 5 Delta 6 Delta 7 Delta 8 Delta 9 Delta 10 Delta 20 Delta 30 Delta 40 Delta 50 Delta 53 160 180
REFERENCES [1] [2]
[3]
FA number/ Day
Fig. 6. The performance of the improved fall detection system on one week elderly home data.
[4]
[5]
It is reasonable to choose the best value as about 50 seconds. An actual elderly faller could not probably get up by herself to activate the sensor network within 50 seconds after a fall occurs. If any event is generated within 50 seconds, the detected possible fall is most likely to be a false alarm and will be discarded. The remaining fall confidence is kept to generate the ROC curve as seen in figure 6. We did not consider the case that the elderly adult had a real fall and a visitor was there to generate events in the sensor network. In this case we assume that visitor would help the person who fell or call a staff member. In Table II, four falls are detected with a higher fall confidence (>0.9). The fall-1 and fall-4 generate a lower confidence (