key for high quality manufacturing. For an early and rapid .... manufacturing [26]. ..... [28] C.H. Stapper, F.M. Armstrong, K. Saji, "Integrated Circuit Yield. Statistics" ...
Automatic Fault Extraction and Simulation of Layout Realistic Faults for Integrated Analogue Circuits C. Sebeke*, J. P. Teixeira**, M. J. Ohletz*** *
Laboratorium für Informationstechnologie, Universität Hannover, Germany ** INESC, IST, Lisboa, Portugal *** Institut für Theoretische Elektrotechnik, Universität Hannover, Germany
Abstract - A comprehensive tool has been implemented for the comparison of different test preparation techniques and target faults. It comprises of the realistic fault characterisation program LIFT that can extract sets of various faults from a given analogue or mixed-signal circuit layout and the automatic analogue fault simulation program AnaFAULT which can handle arbitrary catastrophic and parametric faults. For a fabricated integrated VCO circuit the capabilities of the tool are demonstrated and simulation results are presented.
assumption of the complete set of possible faults taken from the schematic. After the introduction and the state-of-the-art, the application procedure of the universal CAT tool within the
I. INTRODUCTION
AnaFAULT
Analogue and in particular mixed-signal testing has become key for high quality manufacturing. For an early and rapid development of appropriate and dependable tests a Computer-Aided Test (CAT) capability must be provided along with the CAD support. Such a CAT tool should feature components for fault simulation and for the generation of fault lists. Both are required to assess the performance of a chosen test as well as to judge a particular analogue Design-for-Testability (DFT) measure, or Built-In Self-Test like the HBIST approach [19]. This paper introduces an implemented CAT system which links the realistic fault characterisation tool LIFT [29] and the automatic analogue fault simulator AnaFAULT [24]. LIFT extracts faults from a given layout and generates a list of realistic and relevant faults. This list represents the interface to AnaFAULT, which can handle faults extracted by LIFT. By this link, the new tool allows a more comprehensive fault simulation. On the one hand the faults are more realistic resulting in a higher relevance of the results and on the other hand the overall time consumption for the fault simulation decreases significantly compared with the
L2RFM
all faults
Stimulus
Netlist
LIFT
FCP
Fig. 1 Analogue fault simulation from concept and schematic to layout. The arrows width represents the size of the fault lists.
design process is described. Chapters IV and V are dealing with the tools LIFT and AnaFAULT, respectively. Some results for a CMOS VCO are presented in section VI.
II. STATE-OF-THE-ART From reliability investigations a wide range of physical failures are known, e.g. reported in [1] [7] [8]. For the fault simulation, their electrical failure modes can be either represented by the catastrophic or ’hard’ fault model or the parameter deviation or ’soft’ fault model [5] [3]. The latter can be introduced by special commands [13] or by Monte Carlo analysis methods [2]. But, analogue circuit simulators lack the capability to alter the topology of a circuit in its textual or stored matrix representation required for the
hard fault modeling. Consequently this task has been tackled in previous work for the development of fault models [22], the fault recognition from AC and DC measurements [6] and for ISPICE’s AC and DC fault simulation capabilities with different simulation models for hard faults [30] [31] [12]. In view of previous work and due to new requirements, AnaFAULT has been developed since 1988 [15] [14] [4] [11] [24]. Recently it was improved for parallel execution in a workstation cluster environment [21]. Faults to be simulated are read from a fault list. By default this list may initially comprise the complete set of possible single hard faults on each component of the circuit [20]. It can either be updated prior to the final layout using "Local Layout Realistic Faults Mapping", L2RFM [18] or, as described here, at the end of the design process by the "Global Layout Realistic Faults Mapping", GLRFM performed by LIFT (Fig. 1). The pioneering work for obtaining global realistic faults from the final circuit layout [25] is referred to as "Inductive Fault Analysis", IFA. Based on random spot defects introduced on the layout according to statistics, defects large enough to modify the circuit topology such that an electrical failure is caused, are identified and translated into realistic faults [16]. In contrast to the L2RFM technique, this analysis additionally takes into account global short conditions and single defects causing global multiple open faults. Recently, another methodology of realistic fault extraction was developed [27], based on concurrent circuit and fault extraction. Similar to [25], defect statistics analysis is used to evaluate the probability P(fj) = pj of occurrence of each fault, fj. This methodology, together with a set of tools, previously was used to investigate the testability of digital circuits by analysing the estimated testability of realistic faults according to the fault topology [23]. In this work, the fault extraction procedure is used to identify (and rank) the most likely realistic faults in analogue integrated circuits. III. APPLICATION
AND PROCEDURE
At the beginning of the design process the conception of the circuit is chosen. The compliance with the given specifications are verified by hand calculation and network simulations. But the development of appropriate tests is very time consuming and the test quality can neither be
assessed nor guaranteed without CAT support. Furthermore, self-tests for mixed-signal circuits require advanced methods to judge the performance. The CAT system described here supports the development of tests providing detailed reports, clearly arranged overview tables and comprehensive fault coverage plots. For hard faults, an initial fault list can be constructed from the schematic that comprises the complete set of possible hard faults irrespective whether or not the assumptions are realistic. A reduction of this initial list can be accomplished prior to the final layout employing L2RFM [18], or, after the final layout is available, by employing GLRFM. AnaFAULT performs an automatic fault simulation with the actual set of faults using a given stimulus that has to be checked and computes the required fault coverage. Depending on the result the stimulaus can be refined. Currently the system does not generate the stimulus by itself, this will be a topic of future work. IV. REALISTIC FAULT EXTRACTION TOOL LIFT Realistic faults describe physical defects, induced during IC manufacturing [26]. Defect statistics are characterised by the defect densities, associated with the different failure Layer(s)
Failure
Relative Density
Diffusion
open short
αd = 0.01 βd = 1.00
Polysilicon
open short
αp = 0.25 βp = 1.25
Metal_1
open short
αm1 = 0.01 βm1 = 1.0
Metal_2
open short
αm2 = 0.02 βm2 = 1.50
Al/diff.contacts
open
αcd = 0.66
m1/poly contacts
open
αcp = 0.67
vias
open
αcv = 0.8
Tab. 1 Likely physical failure modes in a digital CMOS process and typical failure densities
mechanisms, and, for each mechanism, by its probability density function of the defect size. Each process line and process step exhibits specific defect densities. For a positive photoresist-based lithography, bridging faults are dominant (typical for CMOS process lines). In Tab. 1, the assumed failure mechanisms and their relative defect
densities (normalised to the metal 1 short defect density) are shown. Theses values are also used for the example (section VI). A typical value for the metal 1 short density is 1 defect/cm2 [9]. In most cases, the beta/alpha ratio is around 100, which justifies the importance given to bridging faults. The probability density function pj, for each failure mechanism, describes the probability of occurrence of defects, as a function of their size [10]. Typically, a circle or square shape is assumed. As can be seen, the IC layout and linewidths and spacing between adjacent lines strongly influences the fault set, as well as the probability of occurrence of each fault. Geometrical design rules for each technology are determined in such a way that in the target process line acceptable yields are obtained. In LIFT, each fault originates from a single failure. A file (default, or user defined), contains the assumed likely
injection algorithm has been proven to work with standard SPICE [17] netlists. Basically, the procedure is as follows: After the execution of the nominal simulation, the automatic analogue fault simulation is performed in a repetitive cycle of three main phases. Namely, the preprocessing of the original input file, the call of the kernel simulator and a post-processing phase that compares results and generates statistics. Results are presented in tabular form or in form of fault coverage plots displaying the progress of the fault coverage versus time or frequency simulated. The faults that may be introduced are shown in Fig. 2. Beside the local fault attributed to single elements, global faults like global shorts and split nodes are supported. The latter modes split nodes of order n into two new nodes of order k6
V(11)
5
would be attributed to some kind of soft rather than to a hard fault. The fault coverage plot is depicted in Fig. 5. It shows, that all faults are detected after approximately 55% of the overall test time. After 25% of test time the fault coverage almost reaches 100%. The protocol files showed that the source model simulations required a simulation time 43% longer than the simulation time for the resistor model (4383 sec./3068 sec.). Note, that for each fault only one additional resistor is added [30]. The determination of appropriate resistor values required for the resistor model are subject of fault modeling by process monitoring and can become critical.
0 -1 0
1e-06
2e-06 time
3e-06
4e-06
100 80 fault coverage
#339 BRI metal1_short 1->5
Source Model, 2V/.2us
60 40
V(11)
5
20 0 0
10
20
30
40 50 60 time (% of total 4us)
70
80
90
100
0
0
1e-06
2e-06 time
3e-06
4e-06
Fig. 4 Three examples for faults extracted by LIFT and simulated with AnaFAULT
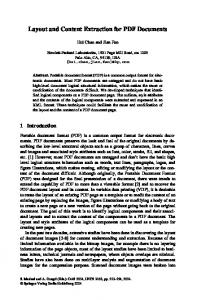
signed. Thus, the number of shorts is 73, including the short on the capacitor. LIFT extracted 70 different failures: 55 bridging, 8 line opens and 7 transistor stuck open faults. Compared with the complete set of possible faults from the schematic this is a reduction in the number of faults by 53%. Note, that not only the number of faults decreased, but also the nature and impact on the circuit behaviour is quite different. For the reduced fault set a 400 step transient fault simulation was performed by AnaFAULT. An explicit test stimulus was not required and the VCO control voltage was held constant. After the activation of the supply voltage the simulation started. Faults were either modeled by the source model or by the resistor model [19] [30] [31] (short: .01µΩ, open: 100MΩ) yielding nearly identical fault coverage plots. Examples of output waveforms for different bridging faults are shown in Fig. 4. The top waveform depicts the fault-free oscillation. As can be seen there are short faults that change the frequency of oscillation (#6 BRI) whereas others cause a constant high or low output signal. Note, that at the first glance an increased oscillation
Fig. 5 Fault coverage plot by AnaFAULT using a tolerance of 2V for the amplitude and 0.2µs for the time
To demonstrate the effect of the choice of different resistor values, the value for the resistor bridging the drain of the Schmitt trigger transistor M11 to ground was ranged between 1kΩ and 10-8Ω. In Fig. 6 the results for the values 1, 21 and 41Ω of the shorting resistor R are shown. Set to 1kΩ the waveform is only slightly affected (compared with the fault-free waveform in Fig. 4). Decreasing the value of R makes the impact more visible in the output waveform. After the value of R is set to 1Ω the oscillation stops after one cycle. This shows that the circuit itself strongly influences the optimal resistor value that has to be used to model a fault at the respective location. From the simulations it further turned out, that the
R=1 R=21 R=41
5
V(11)
-1
0 -1 0
1e-06
2e-06 time
3e-06
4e-06
Fig. 6 Three different values for the resistor shorting M11
detection of particular faults is impacted by their locations.
Some faults are easyly detectable whereas others are only visible under certain load conditions or depend on the frequency of the stimulus.
[10]
A.V. Ferris Prabhu, "Role of Defect Size Distributions in Yield Modeling", IEEE Trans. Electron Devices, vol. 32, No. 9, pp. 1727-1736, Sept. 1985
[11]
B. Grönloh, "Ein Werkzeug zur analogen Fehlersimulation", Report, Inst. f. Theor. Elektrotechnik, Univ. Hannover, 1993
VII. SUMMARY
[12]
J.E. Jagodnik and M.S. Wolfson, "Systematic Fault Simulation in an Analog Circuit Simulator", IEEE J. Circuits and Systems, vol. CAS-26, No. 7, July 1979
[13]
B. Johnson, T. Quarles, A.R. Newton, D.O. Pederson, A. Sangiovanni-Vincentelli, "Spice 3 Version 3f User’s Manual", University of California, Berkeley, October 1992
[14]
H. Lipinski, "FAUSTUS - Fault Simulation Tool Using Spice", Inst. f. Theor. Elektrotechnik, Univ. Hannover, 1990
[15]
H. Lipinski, "Untersuchungen zum Single Hard Fault Model", Report, Inst. f. Theor. Elektrotechnik, Univ. Hannover, 1988
[16]
W. Maly, "Realistic Fault Modeling for VLSI Testing", Proc. Design Automation Conference, pp. 173-180, 1987
[17]
L.W. Nagel, D.O. Pederson, "Simulation Program with Integrated Circuit Emphasis", Proc. 16th Midwest Symp. Circuit Theory, 1973
[18]
M.J. Ohletz and C. Sebeke, "Fault models for single elements of analogue circuits", ESPRIT III project 7107, Report, 1993
[19]
M.J. Ohletz, "Hybrid Built-In Self-Test (HBIST) for Mixed Analogue/Digital Integrated Circuits", Proc. ETC’91, pp. 307-316
[20]
M.J. Ohletz, "Selbsttest monolithischer analog-digitaler Schaltungen", Dissertation, Univ. Hannover, November 1989
[21]
F. Pöhl, "Analoge Fehlersimulation mit SPICE3", Report, Inst. f. Theor. Elektrotechnik, Univ. Hannover 1993
[22]
M. Renovell, G. Cambon and D. Auvergne, "FSPICE: A Tool for Fault Modelling in MOS Circuits", INTEGRATION, No. 3, pp. 245-255, 1985
[23]
M. Saraiva, P. Casimiro, M. Santos, J.T. Sousa, F.M. Goncalves, I. Teixeira, J.P. Teixeira, "Physical DFT for High Coverage of Realistic Faults", Proc. ITC ’92, pp. 642-651
[24]
C. Sebeke and M.J. Ohletz, "Simulation Models for the Fault Simulation on Single Elements of Analogue Circuits", ESPRIT III project 7107, Report September 1993
[25]
J.P. Shen, W. Maly and F.J. Ferguson, "Inductive Fault Analysis of NMOS and CMOS Circuits", IEEE Design & Test, vol. 2, pp. 13-26, Dec. 1985
[26]
J.M. Soden and C.F. Hawkins, "Electrical properties and detection methods for CMOS ICs defects", Proc. ETC’89, pp.159-167
[27]
J.T. Sousa, F.M. Goncalves and J.P. Teixeira, "IC Defects-Based Testability Analysis", Proc. ITC ’91, pp. 500-509, 1991
[28]
C.H. Stapper, F.M. Armstrong, K. Saji, "Integrated Circuit Yield Statistics", Proc. IEEE, vol. 71, No. 4, pp. 453-470, 1983
A comprehensive and demonstrable CAT environment has been introduced which comprises the automatic analog fault simulator AnaFAULT and the automatic fault extraction tool LIFT. Inductive fault analysis based on given defect statistics as well as simultanous circuit and fault extraction are used by LIFT to map defects to electrical failure modes. These are converted to fault models and finally fault simulation models by AnaFAULT. The tool offers a variety of representations of the simulation results supporting the design and test engineer with valuable information for the development of tests, DFT measures and Built-In Self-Test. Acknowledgement: This work was partially supported by the European Community within the ESPRIT III project "ARCHIMEDES" under contract 7107. We further like to thank Mr. Christoph Hoffmann for his help to make this paper possible. VIII. REFERENCES [1]
E.A. Amerasekera, D.S. Campbell, "Failure Mechanisms in Semiconductor Devices", John Wiley & Sons, 1987
[2]
Anacad Electrical Engineering Software, "ELDO User’s Manual, Issue 4.2", June 1993
[3]
J.W. Bandler, A.E. Salama, "Fault Diagnosis of Analog Circuits", Proc. IEEE, vol. 73, No. 8, 1985
[4]
T. Bremert, "Ein Programm zur analogen Fehlersimulation", Report, Inst. f. Theor. Elektrotechnik, Univ. Hannover, 1992
[5]
P. Duhamel, J.-C. Rault, "Automatic Test Generation Techniques for Analog Circuits and Systems: A Review", IEEE Trans. on Circuits and Systems, vol. 26, No. 7, 1979
[6]
B.R. Epstein, S.R. Miller, M.H. Czigler, D.R. Gray, "Linear Microcircuit Fault Modeling and Detection", IEEE VLSI Test Symposium, Paper 3.2, 1991
[7]
F. Fantini, C. Morandi, "Failure Modes and Mechanisms for VLSI ICs - A Review.", IEE Proc., vol. 132, No. G/3, pp. 7481, 1985
[29]
J.P. Teixeira, I.C. Teixeira, C.F.B. Almeida, F. Goncalves, J. Goncalves, "Methodology for Testability Enhancement at Layout Level", JETTA, vol. 1, No. 4, pp. 289-297, 1991
[8]
F. Fantini, M. Vanzi, "VLSI Failure Mechanisms", CompEuro 87, pp. 937-943, 1987
[30]
[9]
D.B. Feltham, W. Maly, "Physically Realistic Fault Models for Analog CMOS Neural Networks", IEEE J. Solid-State Circuits, vol. 26, No. 9, pp. 1223-1229, September 1991
R.E. Tucker and L.P. McNamee, "Computer-Aided Design Application to Fault Detection and Isolation Techniques", IEEE Int. Symposium on Circuits and Systems, pp. 684-687, 1977
[31]
R.E. Tucker and L.P. McNamee, "Computer-Aided Design Application to S-3A Analog Test Programs", Proc. AUTOTESTCON, 1976