Sep 5, 2008 - RVR & JC College of Engineering, Guntur, Andhra Pradesh, India. â â Jawaharlal Nehru ... Pharmacology, Medical diagnosis, Environmental.
IJCSNS International Journal of Computer Science and Network Security, VOL.8 No.9, September 2008
127
Automatic Generation of Merge Factor for Clustering Microarray Data K Karteeka Pavan †, Allam Appa Rao††, A V Dattatreya Rao†††, GR Sridhar††††
† RVR & JC College of Engineering, Guntur, Andhra Pradesh, India †† Jawaharlal Nehru Technological University, Kakinada, Andhra Pradesh, India †††Acharya Nagarjuna University, Guntur, Andhra Pradesh, India ††††Endocrine and Diabetes Centre, Andhra Pradesh, India Summary Microarrays are made it possible to simultaneously monitor the expression profiles of thousands of genes under various experimental conditions. Identification of coexpressed genes and coherent patterns is the central goal in microarray or gene expression data analysis and is an important task in bioinformatics research. Cluster analysis of gene expression data has proved to be a useful tool for identifying coexpressed genes, biologically relevant groupings of genes and samples. In this paper we propose an algorithm - Automatic Generation of Merge Factor for Isodata – AGMFI, to cluster microarray data on the basis of ISODATA. The main idea of AGMFI is to generate initial values for merge factor, maximum merge times instead of selecting heuristic values as in ISODATA. One significant feature of AGMFI over K-means is that the initial number of clusters may be merged or split , and so the final number of clusters may be different from the number of clusters specified as part of the input. We evaluate it’s performance by applying on a well-known publicly available microarray data sets and on simulated data set [3]. We compared the results with those of Kmeans clustering. The experiments indicate that the proposed algorithm AGMFI increased the enrichment of genes of similar function within the cluster. Key words: Bioinformatics, Microarray gene expression data, coexpressed genes ,clustering, K-means, ISODATA, AGMFI
1. Introduction DNA microarrays are emerging technologies in Bioinformatics, which are used to analyze the expression levels of DNA, and have many applications in Pharmacology, Medical diagnosis, Environmental Manuscript received September 5, 2008. Manuscript revised September 20, 2008.
engineering and Biological sciences [9],[10]. Rapid advances in microarray technologies over the last several years have made it possible to monitor the expression of thousands of genes in parallel over many experimental conditions[7],[11]. The results from these experiments are usually presented in the form of a data matrix in which rows represent genes and columns represent conditions. Each entry in the matrix is a measure of the expression level of a particular gene under a specific condition. Analysis of these datasets reveals genes of unknown functions and the discovery of functional relationships between genes. Genes with similar expression patterns under various conditions may participate in the same signal pathway or may be co-regulated. As a descriptive tool, clustering of expression patterns can reveal such relationships. The quantitative expression levels of n genes under d conditions can be thought as n points in ddimensional space. Clustering methods group points together that are close-by in the d dimensional space [20]. Cluster analysis of gene expression data has proved to be a useful tool for identifying coexpressed genes, ie, biologically relevant groupings of genes and samples[2]. Clustering has been shown to be very effective, in associating gene expression patterns with the ligand specificity of neurotransmitter receptors (Ach, GABA, glutamate, and 5HT) and their functional class (ion channel, G-protein-coupled receptor) [12]. In cancer studies [13–18], both gene expression ‘‘signatures’’ for cell types (e.g. T cell) and ‘‘signatures’’ for biological processes (e.g. proliferation) have been successfully identified by clustering [19]. The most popular clustering algorithms in microarray gene expression analysis are Hierarchical clustering [4], Kmeans clustering [5], and SOM [8]. Of these K-means clustering is simple and fast. One drawback in the Kmeans algorithm is that of a priori fixation of number of clusters. ISODATA [21],[1],[6] is a well known partitional clustering algorithm an improvement over the
128
IJCSNS International Journal of Computer Science and Network Security, VOL.8 No.9, September 2008
K-means method[21]. Like the K-means algorithm, ISODATA tries to find the best cluster centers through iterative approach, until some convergence criteria are met. One significant feature of ISODATA over K-means is that the initial number of clusters may be merged or split , and so the final number of clusters may be different from the number of clusters specified as part of the input. ISODATA uses different heuristics to determine when to merge or split clusters. The ISODATA requires number of clusters, and a number of additional user-supplied parameters as inputs. To get better results user need to initialize these parameters with appropriate values by analyzing the input microarray data. This paper proposes an algorithm AGMFI to initialize merge factor for ISODATA. We evaluate it’s performance by applying on a well-known publicly available real microarray data sets and on simulated data set. The experiments indicate that the algorithm increased the enrichment of genes of similar function within the cluster and compared the performance levels with K-means algorithm.
2. Materials and Method 2.1 Data Sets Serum data. This data set is described and used in (Iyer et al., 1999)[23]. It can be downloaded from: http: //www.sciencemag.org/feature/data/984559.shl [25] and corresponds to the selection of 517 genes whose expression vary in response to serum concentration in human fibroblasts. Iris data: This data set is downloaded from ftp://ftp.ics.uci.edu/pub/machine-learning-databases/iris [26]. This is the best known database found in the pattern recognition literature. Fisher's paper is a classic in the field and is referenced frequently to this day[22]. The data set contains 3 classes of 50 instances each, total 150, where each class refers to a type of iris plant. Human data: : it is downloaded from website http://medir.ohsu.edu/~geneview[27]. Gene expression was measured in peripheral blood cells in Asian Indians with type 2 diabetes matched for age, gender, duration of diabetes and glycosylated hemoglobin. Control subjects without diabetes and renal disease (C: n=6) were matched for age and gender with these diabetics, with nephropathy (T2DN: n=6) or without nephropathy (T2D: n=6). In total set of genes 236 were identified as differentially expressed genes. Simulated data : it is downloaded from http://wwwigbmc.u-strasbg.fr/projets/fcm/y3c.txt. The set contain 300 genes [3]. All data were normalized in such a way that every gene had an average expression value of zero and a standard deviation equal to 1. We note X = {x1, x2, . . . , xN }, where xi (= [x1i x2i . . . x pi ]T) is a p-dimensional vector
representing gene i with its p experiments, the input data set for the clustering method.
2.2 Methodology AGMFI uses different heuristics to determine when to split. Decision of merging is done based upon merge_factor which is the function of distances between the clusters. There are number of user –supplied parameters. These include the following • no_clusters - The desired number of clusters. • min_elements -The minimum number of samples in a cluster. • split_size -A parameter that controls splitting. • iter -The maximum number of iterations. Algorithm: 1. Identify clusters using K-means 2. Steps to generate merge factor : (a) Compute the Inter distance matrix from a cluster to all other clusters (b) Find the minimum inter distance between two clusters (c) Find average inter distance between the clusters (d) Compute the average measures obtained in (b) and (c) and taken as merge_factor 3. Discard clusters with fewer than min_elements. Also discard the samples they contain. 4. If the number of clusters is greater than or equal to 2*no_clusters or the number of this iteration is even, execute step 5 (merging operation) otherwise go to step 6. 5. If the distance between two centroids is less than merge_factor, merge these clusters and update the centroid , otherwise, go to step5, repeat this step up to number of clusters/2 times and then go to step 6. 6. If the number of clusters is less than or equal to no_clusters/2 or the number of this iteration is odd, execute step 7 (splitting operation) other wise, go to step 8. 7. Find a cluster that has a standard deviation for some variable, say x, which exceeds split_size* (x), where (x) is the standard deviation of x in the complete original set of samples. If none, go to step 8. Compute the mean of x within the cluster. Separate the samples in this cluster into two sets, one consisting of those in which x greater than or equal to the mean, and the other consisting of those in which x is less than the mean. Compute the centroids of these two clusters. If the distance between these centroids is greater than or equal to c*
IJCSNS International Journal of Computer Science and Network Security, VOL.8 No.9, September 2008
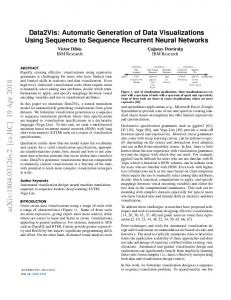
3. Results and Discussions We observed that, our AGMFI works better in clustering the microarray data compared to K-means. The results are shown in the following graphs. The K-means and AGMFI are applied on iris data set when number of clusters initialized to 6 , AGMFI clusters data into 3 as expected since we all know that the species Iris has three varieties Verginica, Versicolor, Setosa
Fig 2. Applied on Serum Data Set Applied on Serum Data k-means-33.1 AGMFI - 45.9
1 0.8 Silhoutte Values
The main difference between AGMFI and ISODATA is ISODATA uses heuristic values to merge the clusters, AGMFI generates automatically and the choice of c is not fixed but is to be decided to have better performance. The distance measure used here is the Euclidean distance. To assess the quality of the clusters, we used the silhouette measure proposed by Rousseeuw [24], [3].
The K-means and AGMFI are applied on serum data set when no of clusters initialized to 6 and AGMFI clusters data into 3
0.6 0.4 0.2 0 -0.2
1
36 71 106 141 176 211 246 281 316 351 386 421 456 491 Genes
The K-means and AGMFI are applied on human data set when no of clusters initialized to 10 , AGMFI clusters data into 7. Fig 3. Applied on Human Data Set Applied on Human data k-means - 69.89 AGMFI - 71.93
1 Silhoutte values
8.
merge_factor, replace the original cluster by these two clusters, otherwise do not split the cluster. (c=0.8 for human data set and c=1.1 for other data set as the choice of c is arbitrary) If step 8 has been executed iter times, or no changes occurred in the clusters since the last time then stop, otherwise take the centroids of the clusters as new seed points and find the clusters using K-means and go to step 3.
129
Fig 1: Applied on Iris Data Set
0.8 0.6 0.4 0.2 0 -0.2 1
21 41 61 81 101 121 141 161 181 201 221 Genes
k-means- 51.03 AGMFI- 80.55
1.2 1 0.8 0.6 0.4 0.2 0 -0.2 1 -0.4
The K-means and AGMFI are applied on synthetic data set when no of clusters initialized to 4 and AGMFI clusters data into 2 Fig. 4. Applied on Synthetic Data Set Applied on Synthetic Data
12 23 34 45 56 67 78 89 100 111 122 133 144 Genes
Silhoutte Values
Silhoutte Values
Applied on Iris Data
1.2 1 0.8 0.6 0.4 0.2 0 -0.2 1 -0.4 -0.6
k-means - 98.7 AGMFI - 100
21 41 61
81 101 121 141 161 181 201 221 241 261 281
Genes
IJCSNS International Journal of Computer Science and Network Security, VOL.8 No.9, September 2008
130
Table 1: The results are summarized in the following table. Data Set
Finalized Cluster Initial Number of number of quality By Kclusters clusters means 6 3 51.03 6 3 33.1 10 7 69.89
Iris Serum Human Diabetic Synthetic 4
3
98.7
Cluster quality by AGMFI 80.55 45.9 71.93 100
4. Conclusions This paper propose an algorithm Automatic Generation of Merge Factor for Isodata – AGMFI to cluster microarray data, based on ISODATA clustering algorithm. ISODATA uses heuristic values to merge the clusters while AGMFI generates the merge factor automatically. Similar to Kmeans, AGMFI also requires number of clusters as input and it initializes the centroids at random. Therefore, depending upon the choice of the number of clusters and initial starting centroids it produces different results. Therefore, find solution to select best centroids as clusters seed points is our future endeavor.
References [1] A.K.Jain and R.C.Dubes, Algorithms for Clustering Data. Englewood Cliffs, NJ:Prentice Hall,1988 [2] Daxin Jiang, Jian Pei, and Aidong Zhang “An Interactive Approach to mining Gene Expression Data”. IEEE Transactions on Knowledge and Data Engineering, vol 17, No.10,October 2005,pp.13631380 [3] Doulaye Dembele and Philippe Kastner “Fuzzy Cmeans method for clustering microarray data”, Bioinformatics, vol.19,no.8 pp.973-980, 2003 [4] Eisen M.B., Spellman P.T., Brown P.O.and Botstein D. “Cluster analysis and display of genome- wide expression patterns. Proc.Natl Acad. Sci. USA, 95, pp.14863-14868 [5] Herwig R., A.J.Poustka, C.Muller, C.Bull, H.Lehrach, and J.Obrien, Large-Scale Clustering of cDNA – Fingerprinting Data”, Genome Research, vol.9 pp.11093-1105,1999 [6] J.T.Tou and R.C.Gonzalez, Pattern Recognition Principles. London:Addision Wesely, 1974 [7] Lockhart, D.J , Winzeler, E.A “Genomics, Gene Expression and DNA arrays”. Nature,405,827-846 [8] P. Tamayo, D.Solni, J.Mesirov, Q. Zhu, S.Kitareewan, E.Dmitrovsky, E.S.Lander , and T.R.Goulb, Interpreting Patterns of Gene Expression with Self – Organizing Maps: Methods and Application to
Hematopoietic Differentiation”,proc.Nat’l Academy of Sciences of the United States ofAm.,vol.96,no.6,pp.2907-2912,1999 [9] Schena M, Shalon D, Davis RW, Brown PO. Quantitative monitoringof gene expression patterns with a complementary DNAmicroarray. Science 1995;270:467-70. [10] Schena M.Microarray biochip technology. Sunnyvale, CA:Eaton Publishing;2000 [11] Young R.A. “Biomedical discovery with DNA arrays. Cell 102,pp.9-15 [12] G.S. Michaels, D.T. Carr, M. Askenazi, S. Fuhrman, X. Wen,R. Somogyi, Cluster analysis and data visualization of largescalegene expression data, Pac. Symp. Biocomput. 3 (1998) pp 42-53 [13] T.R. Golub, D.K. Slonim, P. Tamayo, C. Huard, M. Gaasenbeek J.P. Mesirov, H. Coller, M.L. Loh, J.R. Downing, M.A.Calgiuri, C.D. Bloomfield, E.S. Lander, Molecular classificationof cancer: class discovery and class prediction by gene expression monitoring, Science 286 (1999) 531–537. [14] U. Alon, N. Barkai, D.A. Notterman, K. Gish, S. Ybarra, D.Mack, A.J. Levine, Broad patterns of gene expression revealed by clustering analysis of tumor and normal colon tissues probed by oligonucleotide arrays, Proc. Natl. Acad. Sci. U. S. A. 96 (1999) 6745– 6750. [15] P.T. Spellman, G. Sherlock, M.Q. Zhang, V.R. Iyer, K. Anders, M.B. Eisen, P.O. Brown, D. Botstein, B. Futcher, Comprehensive identification of cell cycleregulated genes of the yeast Saccharomyces cerevisiae by microarray hybridization, Mol.Biol. Cell 9 (1998) 3273–3297. [16] M.B. Eisen, P.T. Spellman, P.O. Brown, D. Botstein, Cluster analysis and display of genome-wide expression patterns, Proc. Natl. Acad. Sci. U. S. A. 95 (1998) 14863–14868. [17] X. Wen, S. Fuhrman, G.S. Michaels, D.B. Carr, S. Smith, J.L. Barker, R. Somogyi, Large-scale temporal gene expression mapping of central nervous system development, Proce. Natl. Acad. Sci. U. S. A. 95 (1998) 334– 339. [18] P. Tamayo, D. Slonim, J. Mesirov, Q. Zhu, S. Kitareewan, E.Dmitrovsky, E.S. Lander, T.R. Golub, Interpreting patterns of gene expression with selforganizing maps: methods and application to hematopoietic differentiation, Proc. Natl. Acad.Sci. U. S. A. 96 (1999) 2907– 2912. [19] A.A Alizadeh, M.B. Eisen, R.E. Davis, C. Ma, I.S. Lossos, A. Rosenwald, J.C. Boldrick, et al., Distinct types of diffuse large B-cell lymphoma identified by gene expression profiling, Nature 403 (2000) 503– 511.
IJCSNS International Journal of Computer Science and Network Security, VOL.8 No.9, September 2008
[20] Jie Liang, Semana kechalo Computational analysis of microarray gene expression profiles:clustering, classification, and beyond Chemometrics and Intelligent Laboratory Systems 62 (2002) 199– 216 [21] Earl Gose, Richard Jhonson Baugh, Steve Jost Pattern Recognition and Image Analysis Prentice Hall of India, 1997 [22] Richard O.Duda, Peter E.Hart, David G.Stork Pattern Classification John Wiley & sons , second edition, 2001 [23] Iyer V.R., Eisen M.B., Ross D.T., Schuler G, Moore t., Lee J.C.F, Trent J.M.,Staudt L.M., Hudson Jr J.,Bogosk M.S. et al. The transcriptional program in the response of human fibroblast to serum. Science, 283-87. [24] Rousseeuw J.P. Silhouttes: a graphical aid to the interpretation and validation of cluster analysis. J.Comp. appl. Math.,20,pp53-65 [25] http: //www.sciencemag.org/feature/data/984559.shl [26] ftp://ftp.ics.uci.edu/pub/machine-learningdatabases/iris. [27] http://medir.ohsu.edu/~geneview
K. Karteeka Pavan received the post graduate degree in Computer Applications from Andhra University in 1996. She has worked as lecturer from (1997-2004). Currently she is working in RVR &JC College of Engineering, Guntur as Assistant Professor. She is pursuing her Ph.D from Acharya Nagarjuna University in Computer Science under the guidance of Dr. Allam Appa Rao. Her research interest includes Bioinformatics, Datamining, and Pattern Recognition.
Dr. Allam Appa Rao has received PhD in Computer Engineering from Andhra University, Visakhapatnam, Andhra Pradesh, India.He has worked as the Professor in Bioinformatics & Computational Biology, Department of Computer Science and Systems Engineering &Principal, Andhra University College of Engineering (AUTONOMOUS). Currently he is Vice Chancellor to Jawaharlal Nehru Technological University, Kakinada. His research interest includes Bioinformatics, Software Engineering and Network Security. He is a member of professional societies like IEEE, ACM and a life member of CSI and ISTE www.allamapparao.net
131
Dr. A.V.Dattatreya Rao has received PhD in Statistics from Acharya Nagarjuna University in 1987. Currently he is the Professor in Department of Statistics, Acharya Nagarjuna University. He has published more than 35 research publications in various National, Inter National Journals. He has successfully guided 3 Ph.Ds and 5 M.Phils. His research interest includes Estimation Theory, Statistical Pattern Recognition, Directional Data Analysis and Image Analysis. He is a life member of professional societies like Indian Statistical Association, Society for Development of Statistics, Andhra Pradesh Mathematical society and a life member in ISPS. He acted as a chair person for various conferences.
Dr G R Sridhar, an endocrinologist is Adjunct Professor, Bioinformatics, Andhra University College of Engineering. He was Chairman, Scientific Committee Annual Conference of RSSDI (2005).He is currently Chairman, Indian Chapter,American Association of Clinical Endocrinologists (2005-7). Dr Sridhar was the founder Editor, Indian Journal of Endocrinology and Metabolism, (1997-2000),' Widely published, he contributed chapters to'RSSDI Textbook of Diabetes' and to 'API Textbook of Medicine.A fellow of Madras Science Foundation, he was honored with RSSDI Oration, 2007, the Hoechst Senior lecturer ship in diabetes (2002) and Boehringer Knoll lecturer ship in Diabetes (1997). Dr Sridhar's major areas of research interest are in Clinical informatics, Computational biology and bioinformatics, psychosocial aspects of diabetes. www.diabetes.org.in