International Journal of Research and Reviews in Computer Science (IJRRCS) Vol. 3, No. 3, June 2012, ISSN: 2079-2557 © Science Academy Publisher, United Kingdom www.sciacademypublisher.com/journals/index.php/IJRRCS
1672
Automatic Image Segmentation using Threshold Based Parameter and Genetic Algorithm Dhirendra Pal Singh1 and Ashish Khare2 1
Computer Centre, University of Lucknow, Lucknow (UP), India JK Instt. of Applied Physics and Technology, University of Allahabad, Allahabad (UP), India
2
Email:
[email protected],
[email protected]
Abstract – Image segmentation is a significant step in any computer vision system. It can be explore as a process of isolating objects of interest from the rest of the scene. In this paper, we propose a new threshold based information parameter for image segmentation through Genetic Algorithm. We used Genetic Algorithm because it is able to determine the optimal number of regions of segmentation. The developed method uses an evolutionary criteria and produce best segment selection. In proposed method, Genetic Algorithm is used in order to determine evolutionary best segmented image based on a new information based parameter via threshold. This method is implemented only on gray level images and in last section we have shown our experimental results by applying the proposed method on different gray images. We also review some of the existing Image Segmentation techniques. Keywords – Genetic Algorithm, Image Processing, Image Segmentation, Threshold
1.
Introduction
Image processing technique is a new growing efficient technique to retrieve the information about the images. If it is done digitally, it produces more advance and enhanced results. This technique involves various tasks like how to represent the image, how to examine the image, how to reproduce the image, and how to enhance the image. Overall It is the art of examining, identifying and judging the impact of the Images so that one can be able to explore the significance of the image for study by the human interpreters. Image segmentation is a part of Digital Image processing [1][2], In a simple words Segmentation is nothing but it is a division of image in to various parts that have a strong correlation with objects or areas of the real world contained in the image. A dense literature is available for image segmentation [3][4][5]. Many works has also been done for Image Segmentation with the help of Genetic Algorithm [6][7]. When we see any image from our eyes then we extract the image by their border, edges and boundaries etc., but this process is very simple for a human being. But if this task is implemented by a digital computer, it creates problems because a number of perspective are to be taken in to consideration for separating the foreground from the background of the image, hence a very complex task for computers. Image Segmentation is an elementary step in the process of extracting and featuring meaningful objects from an input image, as it partitions the image in a set of disjoint regions [8]. Segmentation is typically coupled with pattern recognition problems. It can be considered the first phase of a pattern recognition process and is sometimes also referred to as object isolation. Segmentation is a challenging task for a poor or low contrast image that result in diffusing tissue boundaries. This task involves incorporating as much prior information as possible e.g. texture, shape etc.
In the field of image segmentation using threshold through Genetic Algorithm, a lot of works has been done. Y. M. B. Ali proposed a method based on cost minimization function to segment and extract the image. Y. M. B. Ali initially uses evolutionary algorithm and highlighting their parameters based on adaptive parameterization and then proposed method is applied by putting some optimal setting [9]. Further, Bir Bhanu and John Ming proposed an image segmentation systems which incorporates a Genetic Algorithm and adapt the segmentation process to changes in image characteristics by environmental conditions. Bir Bhanu also optimizes segmentation performance by Genetic Algorithm Learning System and evaluate segmentation quality of the image by measuring local and global features of the image [10]. Melanie Mitchell and Payal Ghosh proposed a genetic algorithm for automatic segmentation of the image. In this paper Genetic algorithm generates a segmenting curve using a level set function. Here both texture and shape information are incorporated to extract the object [11]. Nian Cai, Shaorui Xu, Xiaoyan Tang and Fangzhen Li proposed an entropy based segmenatation method through Genetic Algorithm. Here segmentation is done on the basis of entropy value, first segmented images are generated from the Genetic Algorithms and then finds the most entropy valued. The segmented image which is having most entropy value are the best segmented image [12]. B. Bhanu and S. Lee proposed a segmentation method using Genetic Algorithm. They optimize the segmentation parameters under different conditions of image acquisition [13]. Wen-Bing Tao, Jin-Wen Tian and Jian Liu proposed a three level thresholding method for Image segmentation. They define new fuzzy entropy through probability analysis and combine other level parameters, probability partition and fuzzy partition to get the optimal combination by
D.P. Singh and A. Khare / IJRRCS, Vol. 3, No. 3, pp. 1672-1677, June 2012
implementing the Genetic Algorithm [14]. We have proposed a new threshold based information parameter for Image Segmentation through Genetic Algorithm. We know that segmentation separate the regions from the image of our interest and the pixels of the same region share their intensity (whether low or high) therefore, we used threshold to segment the black regions from the white or vice versa. For optimal solutions, we have used Fast Non-dominating Sorting Genetic Algorithm (NSGA II) [15] evolved by Deb. K. Pratap, A. Agrawal S., and Meyarivan, T. with the use of elitism. Elitism can rapidly enhance the performance of Genetic Algorithm since it prevents a loss of the best-found solution and increase convergence speed of the algorithm. We proposed following segmentation criteria using Threshold value=128, the midpoint in the histogram. Proposed algorithm is divided in to two parts, first part is given as : Step 1: Calculated number of pixels at every gray level. Step 2: Calculated Frequency of number of pixels whose value are greater than threshold (fr1). Step 3: Calculate Frequency of number of pixels whose value are less than threshold (fr2). Step 4: Find the average value for the Step 2 (fr3) Step 5: Find the average value for Step 3 (fr4) Step 6: Obtain frequency = (fr1*fr2) * ((fr3+fr4)*(fr3fr4)) Step 7: Get the proposed parameter by summing up all the nonzero frequency values fnonzero i.e. (-1) * sum (fnonzero * log2(fnonzero). In the Second part of this algorithm, convert the pixels in to binary form, find out the maxima regions, dilate and fillup these regions to get the segmented Image. 1.1. Chromosome Representation Chromosome of image are to be represented as an array of real integer of length four [a, k, b, c] where a, k, b and c are the enhancement parameter and the values of a ranging from o to 1.5, k from 0.5 to 1, b from 0 to 0.5 and c from 0 to 1.0. 1.2. Selection We proposed Tournament Selection which operates by choosing some individuals randomly from a population and selecting the best from this group to survive in to the next generation. Once Selection has chosen fit individuals, they must be randomly altered in hopes of improving their fitness for the next generation. 1.3. Crossover In Crossover, two individuals are chosen to swap segments of their code, to produce offsprings. We have used Arithmetic Crossover [16]. In Arithmetic Crossover, some arithmetic operation is performed to make a new offspring and it can be defined as a linear combination of two chromosomes such as :
Offspring1 * (1 )*
(1)
Offspring 2 (1 )* *
(2)
where α and β be two parents in the mating pool and is a
1673
random number and Є [0,1]. We choose threshold for image segmentation because it gives a convenient way to differentiate the region of the image objects corresponding to the background of the image in which we are interested. We use local transformation for segmentation proposed by C. Munteanu and A. Rosa [17] that is based on gray level distribution in the neighborhood of every pixel is given as : g ( x, y) k *{M / ( ( x, y) b}*{ f ( x, y) c * m( x, y)} m( x, y) a (3)
where g(x,y) stands for proposed image or output pixel intensities, f(x,y) stands for input image or input pixel intensities, M stands for the global mean, σ stands for standard deviation, and m(x,y) stands for the local mean calculated in the neighborhood of 3x3
Figure 1. A 3x3 neighborhood about a point (x,y) in an image [18].
The number of edges and intensity are calculated by ‘Sobel derivative’ methods [19]. Edges in images can be defined as rapid changes in image intensity over a small region. One method of measuring these changes is the use of discrete difference operators. It consists of two masks which calculate the changes in both the direction i.e. in the X direction and Y direction respectively.
Figure 2
Figure2 shows a 3x3 region of Image, Z’s are gray level values and masks are used to compute gradient at point Z5.
Figure 3
In Figure 3 Sobel mask for gradient component Gx and in Figure 4 Sobel mask for gradient component Gy are represented.
Figure 4
D.P. Singh and A. Khare / IJRRCS, Vol. 3, No. 3, pp. 1672-1677, June 2012
1674
for image pixel I(x,y) labeled as Z5 above Gx = (Z7+2*Z8+Z9) - (Z1+2*Z2+Z3) Gy = (Z3+2*Z6+Z9) - (Z1+2*Z4+Z7) Gradient = | Gx | + | Gy | Number of Edges are calculated by calculating gradients at every pixel in the image. If (Gradient>threshold ) and edge is detected and number of edges is incremented by 1. (a) Original Image
1.4. Proposed Parameter In this paper, for every images of different sizes, we have fix the criteria for good segmentation, i.e. we have choose Maximum number of generation =20 ; this is the criteria to stop the evolution, mutation has to be taken as simple mutation having probability=0.1, crossover has to be taken as arithmetic having crossover probability value=0.8, Algorithm is taken as ‘NSGA II Genetic Algorithm’, selection has to take as tournament selection, and finally size of the population has to be taken =48.
2.
(b) Processed Segmentation Image
Figure 6. Circuit.tif.
Experimental Results
We have shown our results on the Computer System having Microsoft Windows XP Professional Service Pack 3, Intel Pentium 3.20GHz CPU, 512 MB Ram, and used MATLAB 7.0 (R14). WE have illustrated our proposed image segmentation technique on various gray level images of different sizes. The framework proposed here addresses a new segmentation criteria with a faster genetic algorithm using threshold. For a small number of generations this strategy is very fast and good in order to find best optimal solution for segmentation, but it’s elapsed time increases as we increases the size of images and the number of Generation as mentioned in Table1. Table 1 Sl. No. 1. 2. 3. 4. 5.
Image Eight.tif Cameraman.tif Circuit.tif Afmsurf.tif Pearlite.tif
(a) Original Image (b) Processed Segmentation Image Figure 7. Afmsurf.tif.
(a) Original Image
Image Size
(b) Processed Segmentation Image Figure 8. Pearlite.tif.
242x308 256x256 280x272 199x199 413x476
The Proposed method shows the following Results:
(a) Original Image
(b) Processed Segmentation Image
Figure 9. Cameraman.tif (a) Original Image
(b) Processed Segmentation Image
Figure 5. Eight.tif.
Qualitatively, we are comparing our proposed method with A. Cheddad Method, with the help of various standard images and image quality measures like Mean Square Error (MSE), Peak to Signal Noise Ratio (PSNR), Structural Content (SC) and Maximum Difference (MD) as mentioned below:
D.P. Singh and A. Khare / IJRRCS, Vol. 3, No. 3, pp. 1672-1677, June 2012
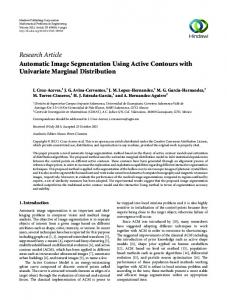
(a) Through A. Cheddad Method
(b) Through Proposed Method
Figure 10. Eight.tif.
(a) Through A. Cheddad Method (b) Through Proposed Method
Figure 11. Circuit.tif.
(a) Through A. Cheddad Method
(b) Through Proposed Method
Figure 12. Afmsurf.tif.
(a) Through A. Cheddad Method
(b) Through Proposed Method
Figure 13. Pearlite.tif.
(a) Through A. Cheddad Method)
(b) Through Proposed Method
Figure 14. Cameraman.tif.
1675
Most of the segmentation algorithms are fully based on the two categories ; one is pixels of the similarity based regions and other is pixels of the non-similarity or discontinuity based regions. As the segmentation through ’Sobel Edge detector’[19] and Canny Edge detector [20] is based on edge based segmentation. In these segmentation schemes, the images are segmented by detecting the edge of ‘different parts of the images’. Basically edges occur on the boundary between two different regions in an image and they are classified as derivative based like gradient based where a gradient of consecutive pixels is taken in x and y directions, this operation is called kernel operation. In Sobel, two 3x3 convolution mask are applied to each pixel and the result is treated a vector representing the edge through the current pixel. If the magnitude of the sum of these two orthogonal vector is greater than some user defined ‘threshold’, the pixel is marked in black as an edge; Otherwise, the pixel is set to white. So in Sobel, a user defined threshold is applied and on the basis of user defined threshold, pixels are set as black and white and one can calculate the edges of the image. Our method is not based on edge detection techniques and we have segmented the image on the basis on region-based segmentation with the help of thresholding techniques (a fix threshold value=128), because thresholding technique is very fast. We have compare our results shown above from Fig. 10(a),(b) to Figure 14(a),(b). Figure (a) is implemented by A. Cheddad et. al’s Method[23] and Figure (b) is implemented by the proposed parameter. In Figure (a) it is clearly identified that pixel intensity are either black or white but what about the intensity regions which are in between black and white, so that regions is ignored and we can not identify that region, but in Figure(b) which is implemented by the proposed parameter and it is very clear that the purpose of the segmentation is to identify the region, is fully satisfied . In every Figure (b) we can identify a small region also like in Figure 10(a) visually it can not be identified and most of the part of the Image are totally ignored and not extracted clearly but in Figure 10(b) it is clearly shown and every object in the image is clearly shown and also visually extracted and segmented. Also in Figure 14(a) only outer part of the coat of the cameraman is show but what about the inner region of the coat ?, it is not shown in this figure. But we have segmented most of the parts of the cameraman like we have segmented the face also, and is shown in Figure 14(b), So we are segmenting and finding each part or the regions of every image by our proposed methods. Therefore our region-based segmentation is better than method developed by A. Cheddad. We have compare the original image and segmented image generated by our proposed method in Figure 5(a) and 5(b), Figure 6(a) and 6(b), Figure 7(a) and 7(b), Figure 8(a) and 8(b), Figure 9(a) and 9(b). If we compare the histogram of the original image and the histogram of segmented image, we can identify that the histogram of segmented image covers a broad range of the gray scale and the distribution of pixels having a few vertical lines and describes a high contrast values. Table I shows the size of various experimental images. We have shown our proposed results mathematically with the help of Table 2, Table 3, Table 4 and Table 5, and also compared with A. Cheddad method.
D.P. Singh and A. Khare / IJRRCS, Vol. 3, No. 3, pp. 1672-1677, June 2012
Qualitatively proposed method’s functionality also be proved by the results generated by the proposed methods as in mages Figure 5(a) and 5(b), Figure 6(a) and 6(b), Figure 7(a) and 7(b), Figure 8(a) and 8(b), Figure 9(a) and 9(b). we can also find a range by concluding that when the proposed parameter value increases, a number or a range of optimal solutions or best segmented images can be find. Measurement of visual quality is a primary importance in several image processing applications. Therefore, we have used some basic ‘Image Quality Measures like Structural Content (SC), Peak to Signal Noise Ratio (PSNR), Mean Square Error (MSE) etc. to compare our results numerically with A. Cheddad. Method. The quality of an Image signal depends upon the undistorted reference signal and error signal. In other words, one can say that loss of perceptual or vision quality is directly related to visibility of error signal. We can define Structural Content (SC) which is correlation based measure and identify the similarities between two image signals. Mathematically, SC may be defined as :
M N M N SC x(m, n)2 x *(m, n)2 (4) m1 n1 m1 n1 where x(m,n) is Original Image, x* is Segmented Image and M, N are number of pixels. Larger value of SC describes poor quality of the image and smaller value of the SC describes best quality of the image, and as we can see from Table 2, proposed method is more reliable. Table 2 Sl. No.
1. 2. 3. 4. 5.
Image
Structural Content (SC) (Image Quality Measure) of the Image generated
Eight.tif Cameraman.tif Circuit.tif Afmsurf.tif Pearlite.tif
Through A. Cheddad Method 1.2399 0.3614 0.1846 0.3845 1.0682
Table 3 Sl. No.
1. 2. 3. 4. 5.
Image
Mean Square Error (MSE) (Image Quality Measure) of the Image generated
Eight.tif Cameraman.tif Circuit.tif Afmsurf.tif Pearlite.tif
Through A. Cheddad Method 132.5242 1.8856 6.3165 24.5765 135.2920
Through Proposed Method 8.0561 0.9219 0 0 40.2296
When different dynamic range images are being compared then MSE may be used in the form of PSNR. PSNR is expressed in decibels (dB). If Peak to Signal Noise Ratio (PSNR) have small value, it means the Image Quality is not good. As shown in Table 4, we have compare PSNR values with our proposed method and the method given by A. Cheddad method [23]. Table 4 Sl. No.
1. 2. 3. 4. 5.
Image
Eight.tif Cameraman.tif Circuit.tif Afmsurf.tif Pearlite.tif
Peak to Signal Noise Ratio (PSNR) (Image Quality Measure) of the Image generated Through A. Through Cheddad Method Proposed Method 61.9576 89.9610 17.4578 12.9609 40.1260 99 34.2256 99 61.7509 73.8792
Another Image Quality Measures Maximum Difference (MD), is the maximum of error signal or MD is the difference between the original image signal and segmented image signal. MD mathematically, may be defined as:
MD Max(| x(m, n) x* (m.n) |)
Through Proposed Method 0.4870 0.2225 0.1555 0.2451 0.4723
(7)
where x(m,n) is Original Image, x* is Segmented Image and M, N are number of pixels. Table 5
MSE or Mean Square Error is another quality measures which quantitatively recognize the strength of error signal. MSE is frequently used because it has a simple mathematical structure and easy to implement. For a discrete image signal x(m,n) and its approximation or segmented image x*(m,n), MSE may be defined mathematically:
M N MSE (1 MN )( ( x(m, n) x* (m, n)) 2 ) (5) m1 n1 And Peak to Signal Noise Ratio (PSNR), mathematically defined as :
PSNR 10*log(255*255 / MSE)
1676
(6)
where x(m,n) is Original Image, x* is Segmented Image and M, N are number of pixels. Higher value of Mean Square Error (MSE) refers to the poor quality of Image and the lower value of the MSE describe best quality of the image, and numerically we can see with the help of Table 3 that proposed method shows good results.
Sl. No.
1. 2. 3. 4. 5.
Image
Eight.tif Cameraman.tif Circuit.tif Afmsurf.tif Pearlite.tif
Maximum Difference (MD) (Image Quality Measure) of the Image generated Through A. Cheddad Method 234 156 142 121 219
Through Proposed Method 186 20 63 1 77
Higher value of MD indicates lower quality image and lower value indicate good picture quality. As we can conclude from the Table 5 that, proposed method is best for the image segmentation. Thus, from all the above simulation results, we can say the performance of the proposed method is better than other method in terms of SC, MSE, PSNR, MD and visual aspect.
3.
Conclusions
From the above discussion, it is clear that with the help of Genetic Algorithm, our proposed method is very effective and dynamic to achieve the best segmentation results. The idea of the proposed method is based on a function given by
D.P. Singh and A. Khare / IJRRCS, Vol. 3, No. 3, pp. 1672-1677, June 2012
Nian Cai et al. [21]. Nian Cai et al. [21] pointed out that by introducing entropy, the images are processed and with the help of Genetic Algorithm, segmented images are obtained. We have modified the function [21] by introducing a fix threshold value (128), elitism and modify the value of the frequencies by comparing with the threshold value and proposed a new threshold based information parameter to obtain the best results with the help of Genetic Algorithm. All the results are shown in various figures qualitatively and in various Tables quantitatively, are generated by applying proposed method only on gray level images. We have proposed segmented results only on the gray level images, and for further research work, proposed method may be modified for color images and results may be generated by changing the threshold values, and some image characteristics constraint may also be included in the frequency in order to obtain some dynamic results of image segmentation.
References [1] [2] [3]
[4]
[5]
[6]
[7] [8]
[9]
[10]
[11]
[12] [13]
[14]
[15]
[16] [17]
[18] [19]
Rafel C. Gonzalez, Richard E. Woods, “Digital Image Processing”, Addison-Wesley 1987. Anil K. Jain, “Fundamentals of Digital Image Processing”, PrenticeHall Inc., 1989. N. R. Pal, S. K. Pal, “A Review on Image Segmentation Techniques”,Pattern Recognition, Vol. 26, No. 9, pp. 1277-1294, 1993. C. Kermad, K. Chehdi, “Multi-bands Image Segmentation: A scalar approach”, In Proceedings of the 13th IEEE International Conference on Image Processing (ICIP’00), vol. 3, pp. 468-471, vanokver, BC, Canada, September 2000. F. Jain, D.K.Y. Yau, A. K. Elamagarmid, W. G. Aref, “Automatic Image Segmentation by Integrating color Edge extraction on Image Processing”, Vol. 10, no.10, pp. 1454-1466, 2001. B. Bhanu, S. Lee, “Genetic Learning for Adaptive Image Segmentation”, Kluwer Academic Publishers Norwell, Mass, USA, 1994. P. Yin, “A fast scheme for optimal thresholding using Genetic Algorithm”, Signal Processing, vol. 72, no. 2, pp. 85-95, 1999. R. M. Haralick, L. G. Shapiro, 1985. “Image segmentation techniques”. Computer Vision Graph Image Processing, 29: 100-132. DOI : 10.1016/S0734-189X(85)90153-7. “Edge-based segmentation using robust evolutionary algorithm applied to medical image”. J.Sign. Process. Stst., 2009, pp. 231-238, DOI 10.1007/s11265-008-0200-z. “Adaptive Image Segmentation Using a Genetic Algorithm”, IEEE Trans. On Systems, Man and Cybernetics, Vol. 25, No. 12, pp. 15431567, Dec. 1995. Payal Ghosh and Melanie Mitchell, “Segmentation of Medical Images using Genetic Algorithm”, GEECO’06, July 8-12, 2006, Seattle, Washington, USA. “Topological Proteomics Image Segmentation Based on a Genetic Algorithm”, 2008, IEEE. “Optimization Based Image Segmentation by Genetic Algorithms”, EURASIP Journal on Image Processing, Vol. 2008, (2008), Article ID 842029, 10 pages, DOI : 10.1155/2008/842029. “Image Segmentation by three level threholding based on maximum fuzzy entropy and Genetic Algoritrhm”, Pattern Recognition Letters 24(2003), pp. 3069-3078. DOI: 10.1016/S0167-8655(03)00166-1. K. Pratap Deb, S. A. Agrawal , and T. Meyarivan, “A fast and elitist multiobjective genetic algorithm : NSGA II”, IEEE Transaction on Evolutionary Computation 6(2)(2002) pp. 182-197. Z. Michalewicz, “Genetic Algorithms+Data Structures=Evolution Programs”. Berlin, Germany: Springer-Verlag, 1996. C. Munteanu, A. Rosa, “Gray-Scale Image Enhancement as an automatic Process Driven by Evolution”, IEEE Trans. On Systems, Man, and Cybernetics, Part B: Cybernetics vol. 34, no. 2, pp.12921298, April 2004. R. C. Gonzeles, R. E. Woods, “Digital Image Processing”, AddisonWesley, 1987. L. S. Davis, “A Survey of Edge Detection Techniques”, Computer Graphics and Image Processing , vol. 4, pp. 248-270, 1975.
1677
[20] John Canny, “A Computational Approach to Edge Detection” IEEE Trans. On Pattern Analysis and Machine Intelligence, vol. PAMI-8, no. 6, pp. 679-698, 1986. [21] N. Cai, F. Li et al., “Topological Proteomics Image Segmentatoion Based on a Genetic Algorithm”, ICBBE2008, 2008, pp. 2489-2491. DOI: 10.1109/ICBBE.2008.955. [22] L.G. Roberts, “Machine Perception of Three-Dimensional Solids”,In James T. Tippett, editor,Optical and Electro-Optical Information Processing, Chapter 9,pp 159-197. MIT Press, Cambridge MA, 1965. [23] A. Cheddad , D. Mohamad , A. Abd Manaf, “Exploiting Voronoi diagram properties in face segmentation and features extraction”, Pattern Recognition, 41 (12)(2008)3842-3859, Elsevier Science