Jun 13, 2006 - web site or by comparing accessibility levels of different web sites; they ... Although human intervention is needed, such a monitoring service ...
Automatic Monitoring of Web Accessibility: the Validity Issues Giorgio Brajnik Dip. di Matematica e Informatica Universit`a di Udine — Italy www.dimi.uniud.it/giorgio June 13, 2006 Abstract This paper highlights some of the difficult issues related with validity of data that occur when dealing with results produced by automatic tools for accessibility testing. In particular the paper shows some experimental results collected by repeatedly applying a testing tool to a number of web sites at two time points and by drawing some conclusions about comparisons between web sites and across time.
1
Introduction
Monitoring web accessibility is an activity that is going to be more and more important in the future, as common perception of web quality factors increase and correspondingly does the role of accessibility. There are many reasons why one should monitor web accessibility of a single web site or by comparing accessibility levels of different web sites; they include (i) to rank tested web sites with respect to some quality factor related to accessibility; (ii) to show how the accessibility level reached by a web site changes over time; (iii) to show how the accessibility level changes across sections of a web site; (iv) to show which are the most typical accessibility defects within a web site; (v) to provide and show the distribution of the different kinds of problems across different kinds of web sites; and (vi) to estimate what is the effort required to fix some of the defects present in a web site. In order to reliably perform such monitoring activities, a service should be capable of periodically analyzing a set of web sites and populate a data warehouse that can be mined. Although human intervention is needed, such a monitoring service can only be built upon automatic tools. The frequency of the analysis, the sheer amount of pages to test, the level of details at which most of the tests have to go, the large number of issues that are typically raised for each page, can only be dealt 1
with by automatic means. In this way one could update the warehouse quickly, often, at a low cost, and be able to analyze the web sites in a systematic way and be able to produce results that are as standard as possible, and therefore as comparable as possible. The fact that accessibility of a web site is an external property of the web site1 , and especially one that is depends upon human cognitive processes, makes it very difficult to measure in a reliable way. As a consequence, there are many open issues related with monitoring methods. In this paper I want to highlight some of the issues dealing with validity of the results that could be produced by mixed–methods (i.e. based on automatic tools and integrated with human judgments) and present some experimental data collected in a small–scale experiment that was run in 2005 and 2006.
2
Related work
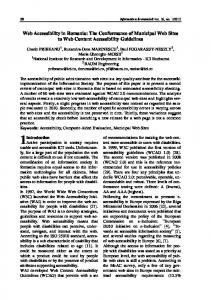
There are several observatories for accessibility and web quality (for example [12; 6; 1]). However all of them are based on unreliable or unknown methods for measuring accessibility, and they often mix several properties with accessibility (like quality, usability, searchability, content adequacy, interactivity, navigability). Figure 1 shows an example of the comparisons that can be drawn from data collected through monitoring methods. A notable exception is the ongoing European project on the Accessibility Observatory [8].
3
The validity issues
There are several methods that can be adopted to test for accessibility. It can be tested based on guidelines (like WCAG 1.0, or Section 508) through a standards review method, or other methods can be employed, like user testing [5], usability inspection methods [11; 7; 10], barrier walkthrough [3] or those suggested in [9]. Automatic monitoring of web sites require the ability to automate the following activities, each of which can introduce factors that can invalidate or reduce the quality of the results: (i) spidering web sites; (ii) collecting appropriate features2 from web pages and related files (html, css, javascript, flash, pdf, ...); (iii) classification of features as failure modes (i.e. as accessibility barriers); (iv) classification of features into defects (diagnosis); (v) assignment of severity scores to 1 External properties of a software system are properties that can only be measured with respect to how the system relates to its environment. 2 In the following I will use these definitions: a feature is a pattern of DOM elements (like an IMG tag with no ALT attribute, a table with ho TH, a spacer image, a data table, etc.) or absence of a pattern; a guideline violation is a feature that does not agree with the guideline requirement; a failure mode is a hindrance, for a user in given situations, to the achievement of a user goal; a defect is a feature that causes a failure mode; severity of a failure mode is a function of the impact of the failure mode (extent to which the goal cannot be achieved) and the frequency (extent to which the failure mode is encountered during a task execution).
2
Figure 1: Taken from [1], this diagram shows the distribution of accessibility scores assigned to about 100 web sites when they were evaluated in 2002 and in 2003. defects and/or guideline violations; (vi) aggregation of these defects and their severity scores so that appropriate and valid conclusions can be drawn with respect to global accessibility assessments. Once a warehouse of data is available, then also the activities of trend analysis, drill–down inspections, statistical inferences, data visualizations need to be supported. There are several open issues that need to be solved before reliable, valid, and useful monitoring services can be automated: • detection of useful features might be complex to implement (for example, detection of data tables, or of skip–links solutions); • detection might not be correct; • classification of features into failure modes might not be valid (i.e. some feature is erroneously related to some failure mode, for example an image with an empty ALT attribute, or viceversa some failure mode is not detected, like a badly chosen ALT text); • classification of features into defects (i.e. diagnosis) is not valid, for example because not all the causes are identified; • invalid assignments of severity are made (for example when priority levels are defined a priori, with no relationship to specific goals, users and situations);
3
• appropriate methods for aggregating ratings, for identifying data mining dimensions, for proper data visualization techniques are still missing.
4
An experimental exploration
In order to investigate on some of the outlined open issues, a small scale experiment was performed using a mixed analysis method, where results produced by an automatic tool were also judged by humans. The goal was to determine how valid, useful and efficient could such a method be. The adopted method is based on an automatic tool (LIFT Machine v. 1.7.1). Selected web sites were crawled (on May 18–19, 2005) by downloading about 50 pages for each of them, starting from the home page and following a breadth–first strategy. The same criteria were used for all the web sites (e.g. same timeout, same URL filters, . . . ). The evaluation of these pages was based on the same kind of tests, which are a subset of the tests that can be used to assess conformance with respect to WCAG 1.0 level AA. No specific customization was performed on the adopted tests (i.e. the default built–in preferences were adopted for all the web site). Some results are shown in table 1 (see [2] for additional details). The numbers represent the percentages of instances of specific features (like number of link images, or number of navigation bars) that resulted in a violation of a checkpoint (absolute numbers ranged from 26 to 1592). Results are grouped into comprehension, operability or flexibility barriers in order to provide an easy way to estimate the kind of effect that they can have on visitors. While such a data can be used as a basis for comparing the accessibility status of different web sites, or for trend analysis of single web sites, there are three major shortcomings. First of all, any diagnostic tool implements a number of tests whose ability to capture violations of accessibility guidelines is less than complete. This limit is fundamental, as several guidelines refer to external properties of the web site, that require human judgment to be assessed. Therefore the validity issue is ”how much are those numbers related to actual guideline violations?” Second, except for the most trivial tests, any tool is bound to produce results that include false positives. This limit is related to the complexity and variability of features in pages (think, for example, at the many ways in which ”skip links” can be implemented and the many places in which those links can be employed). Therefore the second validity issue is ”how much of those numbers refer to true guideline violations?” Third, even assuming that the acquired data are valid with respect chosen guidelines, not all violations have the same impact. For example, the vast majority of the images in web pages have only a decorative role. If their ALT text is missing, the consequence in the worst case is that a screen reader user will hear the URL of the SRC attribute being read aloud. But if images contain information, then the consequence wrt screen reader users worsen dramatically. This needs not to be the case for other user categories, though. For example,
4
Region 1. liguria 2. piemonte 3. lombardia 4. basilicata 5. calabria 6. campania 7. emilia 8. fvg 9. lazio 10. marche 11. molise 12. puglia 13. sardegna 14. sicilia 15. taa 16. toscana 17. umbria 18. vda 19. veneto 20. abruzzo means it means de means at overall
Compr. img frm 100 0 100 0 87 0 64 0 54 5 97 0 70 0 46 0 95 0 100 94 97 0 96 85 100 0 67 0 60 0 79 0 98 0 100 0 98 0 90 1 85 9 92 8 82 19 87 11
skipl 0 1 0 39 22 0 0 7 0 0 0 0 0 6 0 42 0 9 0 32 8 18 3 10
Operability areas imglnk 0 0 0 1 0 90 31 67 40 49 0 100 1 38 55 53 1 98 20 100 0 3 3 98 0 52 30 46 37 47 1 37 93 91 96 98 0 38 66 68 24 59 40 51 38 66 32 57
lbl 98 0 78 69 23 96 3 12 1 98 0 85 1 6 13 1 46 98 5 32 38 66 67 54
Flexibility evnt pop unt 100 0 100 5 7 97 1 0 91 95 0 97 2 5 69 96 0 98 18 0 95 81 0 80 1 1 96 18 0 100 0 73 96 85 0 91 0 0 100 68 0 82 2 0 92 44 0 87 62 0 94 27 5 100 3 0 100 95 0 90 40 4 93 83 11 91 79 10 92 63 8 92
Table 1: For each Italian Region, the percentage of features that lead to a checkpoint violation is given. Means (it, at, de stand for Italy, Austria and Germany) are also given as a reference value. Img represents tests on images that are not decorative nor links/buttons and that do not have appropriate ALT; frm represents frames without appropriate TITLE; skipl represents navigation bars without hidden links for skipping around them; areas represents hot–spots with no proper ALT; imglnk represents images used as links or buttons without ALT; lbl represents forms with no explicit labeling; evnt represents events handlers that cannot be activated by keyboard; pop represents the use of JavaScript for opening new windows; unt represents CSS dimensions specified with absolute units rather than relative ones.
5
a motor disabled person is not affected by the lack of such alternative text. Context of usage of the web site (defined by the category of the user, his/her goal, the operating situation) has to be considered in order to be able to draw such conclusions on the impact of a failure mode. At the moment it is not clear how to consider such a context within the results produced by tools (it is not even clear how to use such a context in evaluations performed by human evaluators!). And therefore inability to draw such conclusions prevents us to properly rank web sites according not only to the number of guideline violations, but also according to the impact that these violations might have on certain users, under certain circumstances. To address the first issue (incompleteness) I suggested in 2004 [4] a comparative method between pairs or tuples of testing tools. When used only with so–called automatic tests, LIFT’s effectiveness is characterized by less than 7% of false positives (warnings being raised incorrectly) and less than 17% false negatives (issues that are missed by the tool3 ). To address the second (incorrectness) and partly the third issue I propose a method based on a stratified sampling of the results produced by tools and a subsequent human judgment of those results in order to determine which is a true problem and which is not. In January 2006 I ran the same tool, with the same configuration, on the same web sites mentioned in figure 1, producing similar data. Then, using a proportional stratified sampling methods on the resulting set of issues (the strata were given by the different tests being deployed), a random sample of issues was selected. These issues were then manually judged and classified as true or false according to whether they are an accessibility barrier or not [3]. As expected4 the the proportion of true positive problems over positive test results ranged widely. For example on web site A for test T1 (images w/o alt) the (lower bound of a 95% confidence interval of the) proportion was 72%, whereas for the same test on web site B it dropped to 7%. A similar variation can be seen also when looking at different tests for the same web site: in one case the proportion was 100% whereas for a different test it dropped to 33%. Table 2 shows more details along with statistical significance figures. These figures (i.e. the lower bound of the confidence interval around the proportions) are important since the proportion is determined on the basis of a sample of the issues. The same experiment yielded some information about trend analysis (how the status of a web site changes over time). I compared the number of violations detected by test Ti over web site Wj obtained in May 2005 and in January 2006 and some of the results are shown in table 3. In many cases, although the two numbers were different, their difference was statistically insignificant (at alpha = 5%). Statistical significance here is important if we consider that for each web site only a subset of the pages were tested (albeit not through a random sample). If we want to draw some conclusions 3 With respect to the checkpoint the test refers to, and with respect to what other tools were able to identify as true problems for the same checkpoint; see [4] for more details. 4 Since no site–oriented customization was performed on the tool.
6
Site fvg ktn lo mw
1 .54 1 .33
Compr. img frm (.72) 1 (.75) (.36) ? (.37) ? (.07) ?
skipl ? 1 (.46) 0 (0) 0 (0)
Operability areas imglnk 1 (.63) 1 (.25) ? 1 (.37) ? ? ? ?
1 1 1 1
lbl (.82) (.37) (.84) (.14)
evnt 1 (.37) 1 (.46) ? 1 (.63)
Flexibility pop unt 1 (.92) 1 (.75) 1 (.14) 1 (.95) ? 1 (.87) 0 (0) 0 (0)
Table 2: For selected web sites, the numbers show the proportion of identified issues that were judged as true defects and in parenthesis the lower bound of the 95% confidence interval on the proportion. Tests were the same as those used in table 1; fvg=www.regione.fvg.it, ktn=www.ktn.gv.at, lo=www.land-oberoesterreich.gv.at, mw=www.magwien.gv.at.
Site fvg05 fvg06 p ktn05 ktn06 p lo05 lo06 p mw05 mw06 p
Compr. img frm .54 (302) .64 (348) .58 (297) .62 (318) .42 .67 .86 (111) .10 (59) 1 (540) 0 (51) 0 .05 .08 (53) 0 (51) .18 (56) 0 (51) .19 1 .69 (64) .72 (58) .63 (62) .99 (139) .61 1
skipl .47 (257) .47 (235) .98 .47 (55) .99 (70) 0 .98 (217) .99 (223) .97 0 (51) 0 (51) 1
Operability areas imglnk .07 (221) .56 (397) .11 (216) .65 (447) .22 .01 .04 (56) .79 (147) 0 (51) .99 (67) .52 0 0 (51) .02 (51) 0 (51) 0 (51) 1 1 0 (51) 0 (51) 0 (51) 0 (51) 1 1
lbl .13 (236) .16 (230) .36 .16 (61) .98 (51) .27 .96 (89) .96 (83) 1 .38 (80) .12 (57) 0
evnt .82 (808) .84 (842) .24 .79 (205) .71 (120) 0 .38 (80) 0 (51) 0 .02 (51) .49 (96) 0
Table 3: For selected web sites, at two time points (2005 and 2006), the numbers show the proportion of features that were labeled as a failure, and in parenthesis the total number of features. For example, in 2005 on fvg there were 297 features tested by the img test, out of which 58% were labeled as guideline violation. p gives the p–value that the two proportions are the same (e.g. p=.42 for fvg05 and fvg06 means that with probability 42% the two proportions differ only by chance). Numbers in boldface are the only statistically significant ones.
7
Flexibility pop 0 (213) 0 (201) 1 0 (55) .06 (51) .13 0 (51) 0 (51) 1 0 (51) .02 (51) 1
unt .81 (278) .79 (246) .79 .51 (83) 1 (1473) .22 .98 (100) .99 (101) .99 .98 (58) .98 (120) 1
about the accessibility trends of the entire web site, then only statistically significant differences should be considered. On the other hand, to compare only the specific sample of web pages that were downloaded and analyzed, then the p–values are not relevant.
5
Conclusions
This explorative study demonstrates that it is not easy to compare data produced by testing tools in a valid way. In many cases, conclusions drawn on shallow analysis of data are too naive and wrong. Yet, a viable model of which measures to compute and how to use them to characterize the validity of the results produced by tools is missing.
References [1] Bernardini A. Rapporto annuale sull’accessibilit`a dei siti web italiani. http://www.webxtutti.it/documenti/Report%20Annuale%20accessibilita’%202003.ppt, 2003. [2] G. Brajnik. Engineering accessibility through corporate policies. In Congresso Annuale AICA 2005, Comunit` a Virtuale dalla Ricerca all’Impresa, dalla Formazione al Cittadino, Udine, Italy, Sept. 2005. [3] G. Brajnik. Web accessibility testing: When the method is the culprit. In Prof. Miesenberger, editor, ICCHP 2006, 10th International Conference on Computers Helping People with Special Needs, Lecture Notes in Computer Science, Linz, Austria, July 2006. Springer Verlag. to appear. [4] Giorgio Brajnik. Comparing accessibility evaluation tools: a method for tool effectiveness. Universal Access in the Information Society, 3(3-4):252–263, Oct 2004. www.springerlink.com/openurl.asp?genre=article&id=doi:10.1007/s10209-004-0105-y. [5] DRC. Formal investigation report: web accessibility. Disability Rights Commission, www.drc-gb.org/publicationsandreports/report.asp, April 2004. Visited Jan. 2006. [6] Formez. Guida utile metodologia arpa-l — valutare la qualit`a dei siti web della p.a. http://db.formez.it/guideutili.nsf/Arpa, 2002. [7] W.D. Gray and M.C. Salzman. Damaged merchandise: a review of experiments that compare usability evaluation methods. Human–Computer Interaction, 13(3):203–261, 1998. [8] EIAO Working Group. European internet accessibility observatory. http://www.eiao.net/. Visited June 2006.
8
[9] S.L. Henry and M. Grossnickle. Accessibility in the User–Centered Design Process. Georgia Tech Research Corporation, Atlanta, Georgia, USA, 2004. On–line book, www.UIAccess.com/AccessUCD. [10] Jakob Nielsen. Usability engineering. Academic Press, Boston, MA, 1993. [11] J. Preece, Y. Rogers, and H. Sharp. Interaction design. John Wiley and Sons, 2002. [12] UIC. Unione Italiana dei Ciechi, Osservatorio www.uiciechi.it/osi/Lavori/index.asp, 2005.
9
Siti
Internet.