Scaling the Web
Automatic QoS Control Daniel A. Menascé • George Mason University •
[email protected]
ser sessions, usually consisting of sequences of consecutive requests from customers, comprise most of an e-commerce site’s workload. These requests execute ebusiness functions such as browse, search, register, login, add to shopping cart, and pay. My colleagues and I proposed and applied a characterization methodology for e-commerce sites that views an e-commerce site’s workload in a hierarchical way.1 The top level is the session level, in which statistics of interest include session duration, type, and arrival rate. The next level is the function level, in which we’re interested in each function type’s frequency of occurrence and arrival process, as well as the popularity of certain terms in search requests. Finally, the bottom layer characterizes the workload in terms of HTTP requests. Important statistics at this level include the arrival process of HTTP requests and the analysis of long-range dependencies in the arrival stream. Once we properly understand and characterize a workload, we must assess its effect on the site’s quality of service (QoS), which is defined in terms of response time, throughput, the probability that requests will be rejected, and availability (see Figure 1). We can assess an e-commerce site’s QoS in many different ways. One approach is by measuring the site’s performance, which we can determine from a production site using a real workload or from a test site using a synthetic workload (as in load testing).2 Another approach consists of using performance models.
U
Performance Models A computer system performance model is a way to estimate the value of performance metrics based on a workload model — a synthetic representation of the actual workload — and on the values of the system’s configuration parameters (see Figure 2). Examples of configuration parameters include the 92
JANUARY • FEBRUARY 2003
Published by the IEEE Computer Society
maximum number of TCP connections at each Web server and the number of threads at the Web and application servers. A performance model fulfills several purposes. During an e-commerce site’s design phase, for example, it can help compare competing alternatives (for example, should you build a site with a few powerful servers or many low-capacity ones). Performance models also can help during production for capacity-planning purposes.3 For medium- to long-term time horizons (on the order of months), such models can help designers predict if any parts of the site won’t meet QoS requirements under different scenarios. An example would be how the site’s response time might vary when the new marketing campaign (which is expected to double the site’s visitors) launches. Another use of performance models is in the short-term (on the order of minutes) automatic reconfiguration of an e-commerce site to preserve its QoS goals. Many reasons demonstrate the necessity of a site’s being able to automatically change its configuration parameters to meet those goals: • The site’s architecture is complex, with multiple tiers of servers, each of which can have many components.4 • As Figure 3 shows, an e-commerce site’s workload is bursty in nature, especially at fine timescales (for example, minutes).1 • Humans cannot react quickly enough to the workload’s fast variations to determine the values of the numerous configuration parameters that could optimize the QoS for a given workload’s intensity. Let’s look at the approach my colleagues at George Mason and I took that uses performance models in the design and implementation of an automatic QoS controller for e-commerce sites.5 1089-7801/03/$17.00©2003 IEEE
IEEE INTERNET COMPUTING
Automatic QoS Control
A Dynamic QoS Control Approach We designed a QoS controller that continuously monitors an e-commerce site’s workload and determines the configuration that best meets the site’s QoS goals (see Figure 4, next page). At regular intervals—called controller intervals—the QoS controller executes an algorithm that takes into account the observed workload, the desired QoS levels, and performance data from the site’s various resources (such as utilizations of CPUs and disks) to determine the best values of the configuration parameters.
E-commerce site
• Sessions • E-business functions • HTTP requests
The following metric satisfies these properties: n
∑ wk × f k (∆k ) k =1
(1)
Workload model
Configuration parameters
Performance model (analytic or simulation)
Computed performance metrics
Figure 2. A computer system’s performance model. Given a workload model and the values of configuration parameters, a performance model computes the values of the system’s performance metrics.
Number of requests
• aggregate several individual QoS metrics such as response time, throughput, and probability of rejection in a way that is independent of the units used to measure these metrics; • be a single number with no units; • allow the e-commerce site managers to assign different importance levels to the various individual QoS metrics; • take into account the desired upper or lower bounds of the individual QoS metrics; and • increase as the value of an individual metric improves with respect to its bound and decrease as the value of an individual metric deteriorates with respect to its bound.
• Response time • Throughput • Probability of rejection • Availability
Figure 1. An e-commerce site, its workload, and the resulting QoS metrics.The workload is characterized in terms of sessions, e-business functions, and HTTP requests. The QoS metrics include response time, throughput, probability of request rejection, and availability.
Metrics We must first define a metric for the QoS controller to use as an optimization goal. This metric should
QoS =
? QoS
Workload
1,400 1,200 1,000 800 600 400 200 0
200
600
400
800
1,000
1,200
1,400
Time (slots of 60 seconds)
where n is the number of QoS metrics being aggregated, wk is a relative importance weight assigned by site management to QoS metric k (all weights sum to 1), ∆k is a relative deviation of the QoS metric k defined in a way that the relative deviation is positive when the QoS metrics exceeds their goal and negative otherwise, and fk() is an increasing function of ∆k. Expressions for relative deviations of response time (R), throughput (X), and probability of rejection (P), respectively, are
∆QoSR =
Rmax − Rmeasured Rmax
IEEE INTERNET COMPUTING
(2)
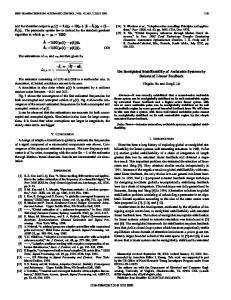
Figure 3. Arrival process of HTTP requests to an online bookstore in one day.1 The x-axis is divided into time slots of one minute, and the y-axis represents the number of arrivals in each time slot.
∆QoSX =
X measured − X min X min
(3)
∆QoSP =
Pmax − Pmeasured Pmax
(4)
QoS Controller Design The QoS controller algorithm executes a combinahttp://computer.org/internet/
JANUARY • FEBRUARY 2003
93
Scaling the Web Arriving requests
E-commerce system
Configuration instructions
Completed requests
System performance data
Arrival process data
QoS metrics data QoS controller
Desired QoS levels
Figure 4. An e-commerce site with a QoS controller.The controller monitors the arrival of requests and the resulting QoS. It also collects system performance data, which the controller uses to determine how the site configuration should be changed. torial optimization algorithm6 searching for an optimal point in the space of parameter configuration values. Each point in the search space is represented by a tuple (c1, …, cm) where ci(i = 1, …, m) is the value of the site’s i-th configuration parameter. Combinatorial optimization algorithms traverse the search space in a nonexhaustive manner seeking the point with the optimum or close-tooptimum value of some function associated with each point. In our case, we associate the aggregated QoS metric described in Equation 1 as the function of a point that the algorithm must optimize. The controller algorithm essentially tries to find the configuration tuple that maximizes the QoS metric’s value for the workload intensity value observed in the preceding measurement interval or intervals. Equation 1’s QoS metric uses the QoS deviations in Equations 2 through 4, which rely on the lower and upper bounds of the QoS metrics and on measured values for those metrics. During the combinatorial optimization algorithm’s execution, we must replace QoS metric measurements with QoS metric predictions for each point of the search space that the algorithm evaluates. This prediction is done through the use of analytic performance models based on queuing networks (QNs).3,4 These models can be solved very efficiently and therefore lend themselves to being used by a combinatorial optimization algorithm to quickly evaluate the quality of each point in the search space. The QoS controller’s QN model must be able to capture the impact of the configuration parameters’ values on the site’s QoS. Because these parameters include software elements such as number and maximum queue size for threads, the QN 94
JANUARY • FEBRUARY 2003
http://computer.org/internet/
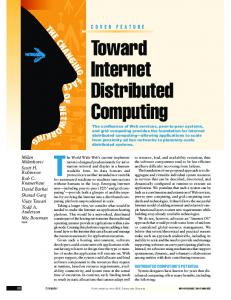
model must be able to capture contention for both software and hardware resources. Figure 5 shows an example of a QN that models an e-commerce site’s software aspects and hardware resources. The top part of the figure shows a Web server process and its various threads. Requests that require the execution of an e-business function (for example, search or add to cart) are sent to a queue of application server threads. If an application server thread needs data from a database, a DB server thread queues that request for service. The figure also illustrates that the various software queues might have limited sizes. When these limits are reached, requests are rejected as indicated by the red arrows in the figure. The bottom part of Figure 5 shows the various machines used to support the software servers. Each machine has one or more CPUs and one or more disks. This type of QN model takes into account the interaction of software and hardware resources and requires specific solution techniques.7 Each time the QoS controller algorithm runs, it computes the QN model’s parameters by using system performance measurements accumulated during the previous controller interval. Once the QoS controller reaches a desired configuration vector, it must send commands out to the site’s various servers to instruct them to change their configurations.
Conclusion We experimented with this approach by implementing an e-commerce site compatible with TPCW8 and a QoS controller that uses an aggregate metric that included response time, probability of rejection, and throughput. We used the hill-climbing combinatorial optimization algorithm, which is a very simple and easy-to-implement algorithm that at each point selects the neighbor with the best QoS to continue the traversal of the search space. The search stops if no improvement in QoS is obtained or if a maximum number of steps is reached. Despite the fact that the hill-climbing algorithm could generate local optima instead of moving to a global optimum, it produced very good results. As the site’s workload intensity steadily increased, the QoS controller was able to keep the aggregate QoS at much higher levels than when the controller was disabled. Without the controller, the QoS metric became negative, showing that at least one of the individual QoS metrics did not meet its goal. References 1. D.A. Menascé et al., “A Hierarchical and Multiscale Approach to Analyze E-Business Workloads,” to be published in Performance Evaluation, North-Holland, 2002. IEEE INTERNET COMPUTING
Automatic QoS Control Completed requests
?
?
?
CPU
Rejected requests
CPU
Disk Web server
DB server threads
Application server threads
Web server threads
Disk Application server
CPU
Disk DB server
Figure 5. Software and hardware contention in an e-commerce site. The top part of the figure illustrates how requests queue for software resources, such as threads at the Web, application, and database servers.The bottom part of the figure shows that, as threads execute, they use or queue for physical resources such as CPUs and disks. 2. D.A. Menascé, “Load Testing of Web Sites,” IEEE Internet Computing, vol. 6, no. 4, July/August 2002, pp. 70–74. 3. D.A. Menascé and V.A.F. Almeida, Capacity Planning for Web Services: Metrics, Models, and Methods, Prentice Hall, 2002. 4. D.A. Menascé and V.A.F. Almeida, Scaling for E-Business: Technologies, Models, Performance, and Capacity Planning, Prentice Hall, 2000. 5. D.A. Menascé, R. Dodge, and D. Barbará, “Preserving QoS of E-Commerce Sites through Self-Tuning: A Performance Model Approach,” Proc. 2001 ACM Conf. E-Commerce, ACM Press, 2001, pp. 224–234. 6. V.J. Rayward-Smith, I.H. Osman, and C.R. Reeves, eds., Modern Heuristic Search Methods, John Wiley & Sons, 1996. 7. D.A. Menascé, “Two-Level Iterative Queuing Modeling of Software Contention,” Proc. 10th IEEE Int’l Symp. Model-
ing, Analysis, and Simulation of Computer and Telecommunication Systems (Mascots 2002), IEEE Press, 2002, pp. 267–275. 8. D.A. Menascé, “TPC-W: A Benchmark for E-commerce,” IEEE Internet Computing, vol. 6, no. 3, May/June 2002, pp. 83–87. Daniel Menascé is a professor of computer science, the codirector of the E-Center for E-Business, and the director of the MS in E-Commerce program at George Mason University. He received a PhD in computer science from UCLA. His published books include Capacity Planning for Web Services and Scaling for E-Business (Prentice Hall). He is a fellow of the ACM and a recipient of the A.A. Michelson Award from the Computer Measurement Group.
Editorial: IEEE Internet Computing targets the technical and scientific Internet user communities as well as designers and developers of Internet-based applications and enabling technologies. Instructions to authors are at http://computer.org/internet/author.htm. Articles are peer reviewed for technical merit and copy edited for clarity, style, and space. Unless otherwise stated, bylined articles and departments, as well as product and service descriptions, reflect the author’s or firm’s opinion; inclusion in this publication does not necessarily constitute endorsement by the IEEE or the IEEE Computer Society. Copyright and reprint permission: Copyright ©2003 by the Institute of Electrical and Electronics Engineers.All rights reserved.Abstracting is permitted with credit to the source. Libraries are permitted to photocopy beyond the limits of U.S. copyright law for private use of patrons those articles that carry a code at the bottom of the first page, provided the per-copy fee indicated in the code is paid through the Copyright Clearance Center, 222 Rosewood Dr., Danvers, Mass. 01923. For copying, reprint, or republication permission, write to Copyright and Permissions Dept., IEEE Service Center, 445 Hoes Ln., Piscataway, NJ 08855-1331. Circulation: IEEE Internet Computing (ISSN 1089-7801) is published bimonthly by the IEEE Computer Society. IEEE headquarters: 3 Park Avenue, 17th Floor, New York, NY 10016-5997. IEEE Computer Society headquarters: 1730 Massachusetts Ave.,Washington, DC 20036-1903. IEEE Computer Society Publications Office: 10662 Los Vaqueros Circle, PO Box 3014, Los Alamitos, Calif. 90720; (714) 821-8380; fax (714) 821-4010. Subscription rates: IEEE Computer Society members get the lowest rates and choice of media option — US$37/30/48 for print/electronic/combination. For information on other prices or to order, go to http://computer.org/subscribe. Back issues: $10 for members, $20 for nonmembers. Also available on microfiche. Postmaster: Send undelivered copies and address changes to IEEE Internet Computing, IEEE Service Center, 445 Hoes Ln., Piscataway, NJ 08855-1331. Periodicals postage paid at New York, N.Y., and at additional mailing offices. Canadian GST #125634188. Canada Post International Publications Mail Product (Canadian Distribution) Sales Agreement #1008870. Printed in USA.
IEEE INTERNET COMPUTING
http://computer.org/internet/
JANUARY • FEBRUARY 2003
95