488
IEEE TRANSACTIONS ON SYSTEMS, MAN, AND CYBERNETICS—PART C: APPLICATIONS AND REVIEWS, VOL. 35, NO. 4, NOVEMBER 2005
Automatic System for Quality-Based Classification of Marble Textures Juan Martínez-Alajarín, Student, IEEE, José D. Luis-Delgado, and Luis M. Tomás-Balibrea, Member, IEEE
Abstract—In this paper, we present an automatic system and algorithms for the classification of marble slabs into different groups in real time in production line, according to slabs quality. The application of the system is aimed at the marble industry, in order to automate and improve the manual classification process of marble slabs carried out at present. The system consists of a mechatronic prototype, which houses all the required physical components for the acquisition of marble slabs images in suitable light conditions, and computational algorithms, which are used to analyze the color texture of the marble surfaces and classify them into their corresponding group. In order to evaluate the color representation influence on the image analysis, four color spaces have been tested: RGB, XYZ, YIQ, and K-L. After the texture analysis performed with the sum and difference histograms algorithm, a feature extraction process has been implemented with principal component analysis. Finally, a multilayer perceptron neural network trained with the backpropagation algorithm with adaptive learning rate is used to classify the marble slabs in three categories, according to their quality. The results (successful classification rate of 98.9%) show very high performance compared with the traditional (manual) system. Index Terms—Artificial neural networks, marble surfaces, pattern classification, principal component analysis, sum and difference histograms, texture analysis.
I. INTRODUCTION
M
ARBLE products have their principal application in covering big surfaces for decoration, using marble slabs. Due to the great importance of the visual appearance, the requirements needed for the quality of these slabs do not refer only to technological parameters (such as endurance or polish rate), but also to aesthetic appearances, such as color homogeneity, texture, or spots, in order to maintain a certain level of uniformity in the whole surface. However, as a natural material, marble is highly heterogeneous and therefore, there are not two identical marble slabs. These visual parameters are important not only in the initial stages of construction, but also when improvements must be made to these surfaces. In these cases, the new slabs used must match with the older ones (they can be even from different suppliers), in order to maintain an aesthetic homogeneity. Manuscript received April 29, 2003; revised January 29, 2004 and November 29, 2004. This paper was recommended by Associate Editor Prof. A. Bouzerdoum. J. Martínez-Alajarín is with the Department of Electronics, Computer Technology and Projects, Universidad Politécnica de Cartagena, 30202 Cartagena, Spain (e-mail:
[email protected]). J. D. Luis-Delgado and L. M. Tomás-Balibrea are with the Vision, Robotic, and Engineering Projects Group, Universidad de Murcia, 30100 Espinardo, Murcia, Spain (e-mail:
[email protected]). Digital Object Identifier 10.1109/TSMCC.2004.843236
These requirements make it necessary to classify marble slabs into homogeneous classes or groups according to their quality and appearance. But since the control of these features is not economically feasible during the extraction of the raw material in the quarries, the classification process must be carried out at the end of the production line, where human experts evaluate and classify the product according to the visual parameters mentioned before. However, this method of classification presents three major problems: 1) the subjective criterion of the operator (even different operators, due to shift work), 2) the visual fatigue after a period of time, which degrades the performance of the classification, and 3) the light conditions may change during the day, offering different visual perceptions of a same pattern at different times. All these problems generate results highly dependent on subjective and changing conditions, so they could be greatly improved with objective and nonvariable criteria. These drawbacks can be solved by using an automated system capable of performing the same processing tasks that are currently done by the human experts, so the classification homogeneity could be improved and, at the same time, the manufacturing cost could be reduced. Previous works [1], [2] describe analysis of the statistical properties of the marble slabs (variance, correlation between color channels, etc.), taking into account only color information, extracted from the first order histogram, without texture analysis. In [1], Euclidean and Bayesian classifiers were used, while in [2] both supervised (BackPropagation) and unsupervised (ART2) neural networks were used as classifiers. In [3], texture analysis is introduced as a new approach to improve previous results, using Sum and Difference Histograms (SDH) for texture analysis and LVQ1 neural networks for classification. In all these cases results were promising, but still unacceptable for an industrial application. Besides, the mechatronic prototype was not built yet, and only the algorithms were developed. Other works related to the analysis of marble textures can be found in [4], where a method is presented for the segmentation of grains in marble textures, and [5], which describes a feature extraction method based on color segmentation for marble slabs classification. In [6], a novel method based on a bottom-up segmentation algorithm for granites is presented, taking into account both color and texture properties. Besides, automated visual inspection has been also applied to other natural products, like cork [7] and wood [8], [9]. Other studies of automated inspection and classification of textures and materials are described in [10]–[12]. Finally, a more comprehensive description about automated visual inspection and its applications can be found in surveys like [13]–[15].
1094-6977/$20.00 © 2005 IEEE Authorized licensed use limited to: Universidad de Cartagena. Downloaded on May 10,2010 at 11:46:22 UTC from IEEE Xplore. Restrictions apply.
MARTÍNEZ-ALAJARÍN et al.: AUTOMATIC SYSTEM FOR QUALITY-BASED CLASSIFICATION OF MARBLE TEXTURES
Fig. 1.
489
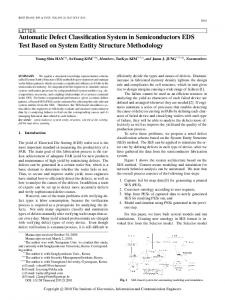
“Crema Marfil Sierra de la Puerta” marble slabs images of three different qualities: (a) extra, (b) commercial, and (c) low.
In this paper, we present an automatic system for the inspection and classification in real time of marble slabs in production line according to their quality, by evaluating their colorimetric and textural properties. The system consists of a mechatronic prototype that houses all the required physical components for the acquisition of visual images of marble slabs, and computational algorithms (running on a PC computer) that perform texture analysis, feature extraction, and classification of the marble surfaces. The next sections are organized as follows. In Section II, we provide a brief overview about the visual characteristics of the marble surfaces to classify and about the adopted solution. In Section III, we describe the different components forming the mechatronic system. The computational algorithms for texture analysis, feature extraction and classification are detailed in Section IV, while the results obtained are discussed in Section V. We conclude with some remarks in Section VI.
II. SYSTEM OVERVIEW A. Visual Characteristics of the Marble Textures Although the system described here has been designed to work with any marble variety, for testing and validating the algorithms we have used slabs of the type “Crema Marfil Sierra de la Puerta”, which is the variety of major production in the Region of Murcia, Spain. Fig. 1 shows slabs images of this marble variety. This kind of marble is characterized by smooth gradients of color, and, in some cases, by the presence of veins on the surface. Although there is not a unique criterion for classifying this kind of marble slabs, color scheme is often used to perform the classification in subtypes or subgroups of this variety, each one containing slabs of similar color schemes. On the other hand, veins and texture are usually considered as a measure of quality (the fewer veins or spots, the greater the quality of the slab). In our study, three categories or qualities have been considered: extra, commercial, and low quality (sorted from high to low marble slabs, so our dataquality). Each category has patterns. base consists of
Since we cannot find any repeated structures in a marble slab because it is a natural product, we have used statistical methods to extract textural features, instead of structural methods. B. Adopted Solution Each variety of marble has its own characteristic visual properties and parameters. Thus, the development of a flexible system capable of classifying any type of marble according to these parameters requires a physical machine (comprising several elements for capturing the slabs images) and computational algorithms (for image processing and classification). In the following lines we describe a general overview about the automatic classification process. The details about the mechatronic prototype and the computational algorithms will be reviewed in Sections III and IV respectively. In the automated system described here, the marble slabs in the production line pass under a charge-coupled device (CCD) color video camera, located perpendicularly to the slab plane, which obtains the color image for the entire slab. The camera is placed in an enclosure (visual inspection unit), which contains a specific illumination system in order to avoid external lighting influences and to assure that the slabs do not receive light reflections from other materials. Once the image has been captured, it is preprocessed with an image acquisition board and saved in an industrial PC computer, which runs the computational algorithms. Then, texture analysis based on the gray level dependence between adjacent pixels is made with the SDH algorithm [16], which extracts for each slab a set of statistical, textural-dependent parameters that characterize that pattern. A feature extraction operation is then performed over this data set with principal component analysis (PCA), which generates a new data set, smaller than the original, and without redundant information. These new data are used as inputs for the neural classifier, a multilayer perceptron neural network, trained with the BackPropagation algorithm with adaptive learning rate. The output of the classifier provides the category or group where the pattern has been assigned according to its quality (three categories in our case). Finally, an industrial labeling machine sticks an identification bar code (including the category, date, and time)
Authorized licensed use limited to: Universidad de Cartagena. Downloaded on May 10,2010 at 11:46:22 UTC from IEEE Xplore. Restrictions apply.
490
Fig. 2.
IEEE TRANSACTIONS ON SYSTEMS, MAN, AND CYBERNETICS—PART C: APPLICATIONS AND REVIEWS, VOL. 35, NO. 4, NOVEMBER 2005
Automation of the whole marble quality classification process: from image acquisition to the pallets.
on the slab surface, which is read by a bar code scanner to allow the marble slab to be placed in the corresponding pallet with an XY-palletizer. Fig. 2 illustrates a schematic representation of the whole classification process. With the automatic classification system described in this paper, we intend to achieve four main advantages: 1) a decrease in the cost of marble slabs production, which means an increase in competitiveness (due to the full automation of the classification process and to a faster classification rate than the manual process); 2) an increase in the quality control standard of the marble slabs classification, since marble is classified with an objective and uniform-through-time criterion; 3) better discrimination between different qualities, that allows factories to supply better products without economical losses, since the market price of these products is usually established by the slabs quality; 4) development of a custom, flexible system, which could be applied to the classification of different marble varieties (even to other natural-texture products, like granites) with little or no modifications in the texture analysis and classification algorithms. III. MECHATRONIC SYSTEM The complete physical system comprises four different modules: • mechanical components; • electrical components; • illumination system; • image acquisition system. A. Mechanical Components Basically, the mechanical system consists of two parts. 1) An enclosure (100-cm long 80-cm wide 110-cm high) [Fig. 3(a) and (b)] mounted over a conveyor belt [Fig. 3(c)], completely closed to avoid the influence of external light. This enclosure (visual inspection unit) allocates the illumination system [Fig. 3(d) and (e)], the camera for image acquisition, and a positioning sensor for detecting slabs, all of them described below. 2) A conveyor belt (220-cm long 83-cm wide 80-cm high), which incorporates manual guides to adjust them
to the width of the slabs (there are two possible widths: 30 and 40 cm), avoiding in this way undesired rotations. The conveyor belt has been designed to work with variable speed, adjusted using an asynchronous driver. When the system is inserted in the production line of the factory, the conveyor belt acts as the element that links the production line with the automatic classification system. In this way, marble slabs are driven inside the visual inspection unit at constant speed, so that the video camera captures the images without stopping the belt. After that, the slabs are carried outside, ready to be classified in the corresponding group once the image processing and classification have been performed. B. Electrical Components The electrical components needed for driving the mechanical system are an electrical motor (0.37 kW, 220 V) coupled to the conveyor belt, and a frequency converter (Toshiba VF S7S 2004P) for selecting the desired speed. The input signal of the frequency converter is used for setting the speed of the motor when it is connected to a reference voltage. This voltage signal is manually controlled with a custom-designed electronic board, which incorporates a D/A converter to allow the desired speed to be set from the computer. For detecting the moment in which the marble slab is in the correct position under the camera, a photoelectric fiber-optic sensor has been used (Keyence FS-M1, with fiber optic FU-73). When a slab interposes between the emitter and the receiver of the sensor, the voltage signal changes indicating to the image acquisition board that a new capturing cycle has just started. C. Illumination System A specific illumination system, placed inside the visual inspection unit, was designed to provide uniform lighting for the entire surface of the slabs, avoiding at the same time reflections on the marble surface from the elements that are placed inside the visual inspection unit (like the video camera). The illumination system uses white light from neon tubes (color temperature: 3800 K). Several tests were made by installing the tubes in different positions to avoid reflections on the marble surface, and finally, the best results were obtained with eight neon tubes arranged in vertical position, four on each
Authorized licensed use limited to: Universidad de Cartagena. Downloaded on May 10,2010 at 11:46:22 UTC from IEEE Xplore. Restrictions apply.
MARTÍNEZ-ALAJARÍN et al.: AUTOMATIC SYSTEM FOR QUALITY-BASED CLASSIFICATION OF MARBLE TEXTURES
491
Fig. 3. Prototype of the visual inspection unit built to automate the marble classification process. (a), (b) External views of the prototype. (c) Conveyor belt, which carries the slabs in and out of the visual inspection unit. (d), (e) Detail of the inside view, showing the position of the neon tubes, (upper part) the color video camera, (lower part) and the marble slab.
side of the two that are parallel to the movement of the conveyor belt [Fig. 3(d) and (e)]. The light intensity is manually adjusted to achieve good quality in the captured images. The inner lateral sides of the visual inspection unit are covered with white surfaces, in order to achieve a good diffusion of light. In this way, the image obtained does not need any subsequent treatment to overcome the effects of an irregular illumination. On the other hand, the ceiling of the visual inspection unit and the floor (the conveyor belt) are both painted anti-reflecting black color to avoid reflections and achieve better discrimination between the marble surface and the background.
the camera, a software-controlled zoom lens (Canon, model PH10 8.5 RGE) has been used. The Genesis image acquisition board also includes a comprehensive library of functions for image processing. IV. COMPUTATIONAL ALGORITHMS When the marble slabs leave the production line, they are carried into the automatic quality classification system. The actions that occur during the image inspection process are the following: image preprocessing, texture analysis, feature extraction, and classification. Next, we describe in detail each of them.
D. Image Acquisition System The system used for acquiring the images of marble slabs consists of a high-resolution, solid-state CCD color video camera (JVC, model TK-1270E), and an image acquisition board (Matrox Electronic Systems, model Genesis). The camera is located in the central part of the upper side of the visual inspection unit, in order to capture the whole surface of the slabs without distortion. The distance between the camera and the slabs has been settled in 100 cm. Together with
A. Image Acquisition and Preprocessing Initially, when the positioning sensor triggers the slab detecting signal, an internal timer in the acquisition board is activated. This performs a time delay, which allows the slab to be centered under the camera. Since there are slabs of several sizes, different delays were experimentally established for each size: (a) 1.5 s for 30 30 cm slabs, (b) 1 s for 40 30 cm slabs, and (c) 0.5 s for 60 40, and 60 30 cm slabs. Then, when the
Authorized licensed use limited to: Universidad de Cartagena. Downloaded on May 10,2010 at 11:46:22 UTC from IEEE Xplore. Restrictions apply.
492
IEEE TRANSACTIONS ON SYSTEMS, MAN, AND CYBERNETICS—PART C: APPLICATIONS AND REVIEWS, VOL. 35, NO. 4, NOVEMBER 2005
time delay ends, the image is captured, and several functions from the image acquisition board library are executed to remove the background pixels (usually black, due to the conveyor belt) from the captured image, leaving only the pixels of the marble slab surface. Finally, the image is saved in the PC computer as a RAW file in RGB color coordinates, provided directly by the image board. The importance of the color representation of the marble surfaces makes it necessary to analyze different color coordinates (color spaces), in order to choose that which gives the best performance. The comparison between different color spaces is needed because their performances are strongly application dependent, and the best one must be chosen ad hoc [17]. Four different linear color spaces, used in our previous works [3], were evaluated: RGB (the three monochromatic primaries), XYZ [based on the Commission Internationale de l’Eclairage (CIE) tristimulus values], YIQ [developed by the National Television Systems Committee (NTSC) for transmission efficiency], , which is achieved and K-L [18] (also called Ohta or by computing the Karhunen–Loève Transform). For each color space, colors are represented with three independent coordinates. All images were converted from RGB format (in the RAW file) to the other three color spaces using (1)–(3) (1)
as powerful as COM for texture discrimination, and with the advantages of decreasing computation time and memory storage space. A recent and thorough comparison of texture analysis methods for synthetic and real (natural) textures can be found in [22]. For a large number of gray levels (usually 256), the two vectors obtained from SDH require much less memory storage space than the matrix of COM, and so, the processing is much faster because 1) the amount of data to process is smaller, and 2) the double sums for the COM statistical parameters computed are reduced to single sums in the SDH algorithm. The number of elements to analyze grows as a quadratic function with the number of gray levels for COM, while it grows linearly for SDH. Next, the SDH algorithm is briefly presented. texture image, denoted Let us consider a by , with the set of quantized gray levels. and Let us also consider two picture elements, , separated by the vector distance , where is the subset of indexes specifying the texture region , the to be analyzed. Then, for a relative displacement sum and difference are defined as (4) (5) -dimensional From (4) and (5), we can define two vectors, the normalized sum and difference histograms, as (6)
(2)
(7) (3) Each channel of color representation can be considered as a gray picture, whose pixels have gray level values within the range defined for that color coordinate. Except for RGB, the rest have one or more coordinates which do not cover exactly the range [0–255]. In these cases, a linear scaling process was performed to adjust the values within that range. B. Texture Analysis In this work, apart from the color, the texture of the image has been taken into account. Tests made showed that, although in some cases the veins in the marble surface are hardly distinguishable, their analysis is very important to determine the subclass to which the pattern belongs, as well as its quality, thus achieving better results than in the case of considering only color information. The method used for texture analysis is the sum and difference histograms (SDH) algorithm [16]. This algorithm is an alternative to the classic algorithm of co-occurrence matrices (COMs) [19]–[21], based on the spatial gray level dependence (SGLD) method. Since each channel of the color image presents 256 gray levels, the requirements of memory storage and time consumption with COM are huge (processing of three 256 256 matrices). SDH offers in this sense a very good alternative to traditional COM used for texture analysis, with experimental results showing that SDH are
with (8) (9) (10) , because it is necessary to In our case, use a large number of gray levels since the considered images present smooth gradients and very similar gray levels. Thus, for each color image (three gray level images or channels), there are six 511-dimensional vectors , and . , can The neighborhood between pixels, defined by be chosen arbitrarily. In our case, for simplicity, the nearest 8 neighbors of a pixel have been considered (Fig. 4). It must be noted that opposite directions produce the same SDH vectors, so only four nonopposite directions are necessary. In order to achieve a rotation-independent algorithm, each histogram vector has been computed as the average value for their cor, responding four neighborhood directions: . and and After computing the resultant six histogram vectors ( , with ) we obtain 3 channels 2 vectors/channel 511 elements/vector 3066 elements. In order to reduce the dimension of this set of characteristics used to describe the texture, seven statistical features are computed for each pair of vec, as defined in [16]: mean, variance, energy, cortors
Authorized licensed use limited to: Universidad de Cartagena. Downloaded on May 10,2010 at 11:46:22 UTC from IEEE Xplore. Restrictions apply.
MARTÍNEZ-ALAJARÍN et al.: AUTOMATIC SYSTEM FOR QUALITY-BASED CLASSIFICATION OF MARBLE TEXTURES
493
TABLE I STATISTICAL PARAMETERS USED FOR CLASSIFICATION, EXTRACTED FROM THE SUM AND DIFFERENCE HISTOGRAMS
Fig. 4. Representation of the 8 neighborhood directions of a pixel. Opposite directions, e.g., (d ; d ) = (0; 1) and (d ; d ) = (0; 1), produce the same SDH vectors, so only four nonopposite directions are necessary.
0
relation, entropy, contrast, and homogeneity (Table I). Finally, this results in 3 channels 7 features/channel 21 features, which express the information of the six histogram vectors in a more compact form. Although each channel has been treated as a gray level image (256 pixel intensities), the set of 21 parameters contains color and textural information. Other methods that combine color and texture to classify images are described in [23] and [24]. C. Feature Extraction Since the number of parameters used to describe each pattern is still high, a feature extraction method is necessary in order to reduce the number of features used to classify the marble textures. It is well known that for high-dimensional feature spaces, the design of the classifier can be very complicated and would produce poor results (curse of dimensionality [25]). The algorithm used for feature extraction has been the PCA [26], also known as the Karhunen–Loève transform in signal processing. This algorithm is a linear, nonparametric technique that has been widely used for analyzing data sets when a big number of variables are involved. This method transforms the original set of variables into a new set of the same size, whose variables, called principal components (PC), are computed as linear combinations of the original variables, in such a way that they form an orthogonal basis (noncorrelated), so redundant information is removed. The new set of variables is sorted from high to low variance, and usually the variances of the first few principal components account for almost 100% of the total variance of the original data, thus allowing the design of a much simpler classifier. In this work, PCA has been applied to the statistical data set computed with the SDH algorithm in order to reduce the number of features from 21 to a smaller number. Previously to the PCA transformation, the statistical parameters were normalized to achieve a new data set with mean and standard deviation equal to 0 and 1, respectively, with (11) where feature,
is the normalized feature, is the nonnormalized and are respectively the mean and variance of
is the feature number of patterns in the database, and is the number of features used to describe each pattern. After applying PCA, we selected a subset of features, where is the number of principal components that their individual contributions are equal or greater than 0.5% of the total variance of the data set. D. Classification For real-time classification of marble slabs in production line, a database was created for each color space with input/output pairs of patterns for which their quality category is known previously (off-line). These patterns will act as reference to classify on-line the new patterns. To build this input/output mapping, a heteroassociative artificial neural network has been chosen, as these structures present very good capabilities for learning and generalizing information. In particular, the neural network used has been the multilayer perceptron paradigm, trained with the gradient descent BackPropagation algorithm with adaptive learning rate. The structure of the neural network consists of three feedforward layers: 1) the input layer, with neurons (one neuron for each one of the principal components), 2) the hidden layer, with six neurons, and 3) the output layer, with three neurons (one per quality category: extra, commercial, and low). The activation functions chosen were the hyperbolic tangent for the hidden layer and the linear function for the output layer. The following parameters have been used for training the network: 0.0001 for goal error, 0.01 for the learning coefficient, 3000 epochs as maximum number of iterations, 1.05 and 0.7 as the ratios for increasing and decreasing the learning rate, respectively, and 1.04 for the maximum performance increase threshold. The learning rate is updated after each epoch, increasing it by a factor 1.05 when the performance decreases toward the goal, and decreasing it by a factor 0.7 when the performance increases by more than a factor 1.04. in the database is low, the Since the number of patterns leave-one-out method has been used for training the neural network, in order to obtain more reliable results. In each training, a data set made up of 74 patterns (textural features and desired
Authorized licensed use limited to: Universidad de Cartagena. Downloaded on May 10,2010 at 11:46:22 UTC from IEEE Xplore. Restrictions apply.
494
IEEE TRANSACTIONS ON SYSTEMS, MAN, AND CYBERNETICS—PART C: APPLICATIONS AND REVIEWS, VOL. 35, NO. 4, NOVEMBER 2005
outputs) was preprocessed with normalization (mean and ) and PCA transformation, previously standard deviation to the presentation of the inputs to the neural network. The remaining pattern (chosen for validation) was left out from these operations. After the training, the validation pattern was transformed with the same parameters used for the normalization and PCA transformation of the other 74 patterns, and presented to the input of the neural network. Finally, the output of the neural network was postprocessed to undo the normalization process and to obtain the correct output for the validation pattern. For each color space, the performance of the classifier has been evaluated by computing three parameters usually used in diagnostic decisions: the percentages of correct classifications (%CCs), false positives (%FPs), and false negatives (%FNs), using the following expressions: % % %
(12) (13) (14)
where TP is the number of true positives, FP is the number of false positives, TN is the number of true negatives, and FN is the number of false negatives. Since these parameters are defined to evaluate binary classifications, we have considered each classifier (one for each color space) as three binary classifiers (one for each marble quality category) for evaluation purposes only. That is, in order to evaluate TP, FP, TN, and FN parameters for , and one color space, we can consider three classifiers: , for the extra , commercial , and low quality patterns clascategories, respectively. For , the TPs are the patterns, the TNs are the non- patterns ( and sified as ) classified as non- patterns, the FPs are the non- patpatterns, the FNs are the patterns clasterns classified as and . From this, sified as non- patterns, and so on for we obtain that the value of %CC is the same for the three classes for a specific color space, so it can be considered a result from the color space classifier instead of a result for a specific class. Sensitivity (SE), specificity (SP), positive predictive value (PPV), and negative predictive value (NPV) are also estimated using the following expressions [27]: (15) (16) (17) (18) All these parameters have been computed for the three classes for all the color spaces. V. EXPERIMENTAL RESULTS After computing PCA, we selected for each color space the number of features as the number of principal components that have a contribution equal or greater than 0.5%. For this number of principal components, the accumulated variance is around 99% in all cases. Table II shows the variance (in %) for the selected principal components for the four color spaces.
TABLE II VARIANCE IN PERCENTAGE OF THE PC SELECTED FOR EACH COLOR SPACE
According to this table, , and for the RGB, XYZ, YIQ, and K-L color spaces, respectively. The graphical representation of PC #2 versus PC #1 (Fig. 5) shows the pattern distribution for each color space. Patterns for extra, commercial and low classes are represented, respectively, , and . From this figure, it can be seen with symbols that the pattern distribution for RGB and XYZ is very similar, can almost be separated from the other and in both cases, and two classes for the bidimensional distribution, while cannot be separated at all. In contrast, for YIQ and K-L, is very well separated from the other two classes (better than in and cannot be separated the RGB and XYZ cases), while completely yet. This shows that the three classes cannot be completely separated with only the first and second principal components, although it is possible with more principal components. In YIQ and K-L color spaces, it can be seen that the first principal component acts as an index of the slab quality (the higher the positive value, the lower the quality). That is, patterns and (good qualities) are at the left side of the of classes (bad quality) are at the right graphs, while patterns of class side of the graphs. It was also confirmed by visual inspection patterns at the right part of the graphs was that texture of the coarser (worse) than the texture of the patterns at the left part, although all of them are considered as ‘low quality’ patterns. For each color space, we trained a neural network with the leaving-one-out method. Each training experiment consisted of 75 trainings, each one with 74 patterns in the training data set, leaving out 1 pattern for validation. The pattern that was left out was rotating, in order to validate the 75 patterns. Since our database contains a low number of patterns, for each color space, ten training experiments were performed for each validation pattern, and their results averaged to increase the reliability. Fig. 6 shows the confusion matrices for the four color spaces. They the real class of the patterns, and represent in each row in each column the quality group where the patterns were classified by the neural network. Ideally, for a perfect classification, the diagonal cells should be 100 (the percentage of patterns classified in each class), and 0 for the nondiagonal cells. From Fig. 6 and Table III, we can see the different performances of each color space. RGB and XYZ performed very similar, achieving poor results (only three quarters of the samples were correctly classified). For these two color spaces,
Authorized licensed use limited to: Universidad de Cartagena. Downloaded on May 10,2010 at 11:46:22 UTC from IEEE Xplore. Restrictions apply.
MARTÍNEZ-ALAJARÍN et al.: AUTOMATIC SYSTEM FOR QUALITY-BASED CLASSIFICATION OF MARBLE TEXTURES
495
Fig. 5. PCA plots (PC #2 versus PC #1) for the four color spaces: (a) RGB, (b) XYZ, (c) YIQ, and (d) K-L.
Fig. 6. Confusion matrices for the (a) RGB, (b) XYZ, (c) YIQ, and (d) K-L color spaces, showing the percentage of patterns classified in each class. Results have been averaged for ten trainings of the neural network with the leave-one-out method for each color space. Rows (C ) represent the real quality category of the patterns, while columns (C ) represent the quality category assigned to the patterns by the neural network.
class
was discriminated better than the other two classes % % , while and had lower values. In contrast, YIQ and K-L achieved very good results, with % very high rates of correct classified patterns ( %). Besides, in the K-L space, class was and % , without perfectly discriminated overlapping with classes and , while in the YIQ space these results were also very good, although with an average of % patterns from class classified in class . and was also very good in The discrimination between
these two color spaces, especially in the case of K-L, which pro% , with very low values vided the best results % of false positives and negatives % % % , thus allowing almost and patterns. completely the discrimination between The analysis of the results for the K-L color space showed that errors only occurred between extra and commercial qualities (both very similar), while slabs of low quality (not suitable for decoration purposes) were always correctly identified and classified. From an economical point of view, this is a very important result, since slabs of high and low qualities are never
Authorized licensed use limited to: Universidad de Cartagena. Downloaded on May 10,2010 at 11:46:22 UTC from IEEE Xplore. Restrictions apply.
496
IEEE TRANSACTIONS ON SYSTEMS, MAN, AND CYBERNETICS—PART C: APPLICATIONS AND REVIEWS, VOL. 35, NO. 4, NOVEMBER 2005
TABLE III PERFORMANCE OF THE NEURAL NETWORK CLASSIFIER FOR THE RGB, XYZ, YIQ, AND K-L COLOR SPACES
confused, so the marble slabs supplied are always in agreement with their cost. These results are highly related to how intensity (texture information) is decoupled from chrominance (color information) in YIQ and K-L. Intensity is concentrated on channels Y and , whereas chrominance information is provided by channels , with spatial bandwidth significantly reduced. I, Q, and Thus, YIQ, and K-L provide texture and color information in separate channels, so the texture information needed to classify marble images according to their quality is extracted better than in the case of RGB and XYZ, which do not provide such a clear separation between texture and color. Besides, the approach used in this paper for marble classification (texture parameters computed using SDH and transformed with PCA) improves the results obtained in [28], in which the successful classification rate is 90% for a set of 30 marble textures classified in three classes (extra, commercial, and low) according to their quality. In this case, the features computed for pattern classification were the energy and median of the vertical details coefficients for a discrete wavelet decomposition of level 3. VI. CONCLUSION A new system, fully automated, for the inspection and classification in real-time of marble slabs in production line has been presented in this paper. The system consists of a mechatronic system, computer vision equipment, and software algorithms for texture analysis, feature extraction, and pattern classification. The mechatronic design and the software are especially robust for working in industrial environments, where the results obtained have proven very high performance compared with the traditional (manual) classification system. Texture analysis was made with the sum and difference histograms, based on the gray level difference between adjacent pixels, which provides a reliable method to characterize the image texture. One of the greatest improvements with respect
to our previous works was the feature selection process with PCA, which reduced the number of features, retaining high levels of the original information. This provided a good set of features, without redundant information, as inputs to the neural network, thus resulting in fast convergence and good learning capabilities. The comparison between four color spaces (RGB, XYZ, YIQ, and K-L) showed that YIQ and K-L performed very well, while RGB and XYZ achieved poor results. The best results were obtained for the K-L color space, with 98.9% patterns correctly classified and 100% discrimination for patterns (the lowest quality). This automatic classification system increases the homogeneity of the product supplied by factories, and reduce time, cost and discrepancies in the marble industry, since this system may be used as a standard for marble quality control and classification. This also allows for an objective comparison between marble slabs of the same variety coming from different places. Finally, this system may also be useful for other natural products, like granites or wood.
ACKNOWLEDGMENT The authors would like to thank the anonymous referees for their valuable comments and suggestions on revising this paper.
REFERENCES [1] V. Garcerán-Hernández, L. G. García-Pérez, P. Clemente-Pérez, L. M. Tomás-Balibrea, and H. D. Puyosa-Piña, “Traditional and neural networks algorithms: Applications to the inspection of marble slabs,” in IEEE Int. Conf. Systems, Man, and Cybernetics, Vancouver, BC, Canada, 1995, pp. 3960–3965. [2] P. Clemente-Pérez, V. Garcerán-Hernández, H. D. Puyosa-Piña, and L. M. Tomás-Balibrea, “Automatic system to quality control: Using artificial vision and neural nets for classification of marble slabs in production line,” in Proc. Int. Symp. Artificial Neural Networks, Taiwan, R.O.C., 1995, pp. E3.26–E3.31. [3] J. Martínez-Alajarín and L. M. Tomás-Balibrea, “Automatic classification system of marble slabs in production line according to texture and color using artificial neural networks,” in Proc. 8th Int. Conf. Computer Analysis of Images and Patterns, Ljubljana, Slovenia, Sep. 1999, pp. 167–174. [4] F. Lumbreras and J. Serrat, “Segmentation of petrographical images of marbles,” Comput. Geosci., vol. 22, no. 5, pp. 547–558, Jun. 1996. [5] M. Deviren, M. K. Balci, U. M. Leloˇglu, and M. Severcan, “A feature extraction method for marble tile classification,” in Proc. 3rd Int. Conf. Computer Vision, Pattern Recognition, and Image Processing, Atlantic City, NJ, 2000, pp. 25–28. [6] L. Shafarenko, M. Petrou, and J. Kittler, “Automatic watershed segmentation of randomly textured color images,” IEEE Trans. Image Process., vol. 6, no. 11, pp. 1530–1543, Nov. 1997. [7] J. Chang, G. Han, J. M. Valverde, N. C. Griswold, J. F. Duque-Carrillo, and E. Sánchez-Sinencio, “Cork quality classification system using a unified image processing and fuzzy-neural network methodology,” IEEE Trans. Neural Netw., vol. 8, no. 4, pp. 964–974, Jul. 1997. [8] P. R. Drake and M. S. Packianather, “A decision tree of neural networks for classifying images of wood veneer,” Int. J. Adv. Manuf. Technol., vol. 14, pp. 280–285, 1998. [9] M. S. Packianather and P. R. Park, “Neural networks for classifying images of wood veneer, part II,” Int. J. Adv. Manuf. Technol., vol. 16, pp. 424–433, 2000.
Authorized licensed use limited to: Universidad de Cartagena. Downloaded on May 10,2010 at 11:46:22 UTC from IEEE Xplore. Restrictions apply.
MARTÍNEZ-ALAJARÍN et al.: AUTOMATIC SYSTEM FOR QUALITY-BASED CLASSIFICATION OF MARBLE TEXTURES
[10] K. V. Ramana and B. Ramamoorthy, “Statistical methods to compare the texture features of machined surfaces,” Pattern Recognit., vol. 29, pp. 1447–1459, 1996. [11] C. Boukouvalas, F. D. Natale, G. D. Toni, J. Kittler, R. Marik, M. Mirmehdi, M. Petrou, P. L. Roy, R. Salgari, and G. Vernazza, “ASSIST: Automatic system for surface inspection and sorting of tiles,” J. Mater. Process. Technol., vol. 82, no. 1–3, pp. 179–188, Oct. 1998. [12] D.-M. Tsai and T.-Y. Huang, “Automated surface inspection for statistical textures,” Image Vis. Comput., vol. 21, pp. 307–323, 2003. [13] R. T. Chin and C. A. Harlow, “Automated visual inspection: A survey,” IEEE Trans. Pattern Anal. Mach. Intell., vol. PAMI-4, no. 6, pp. 557–573, Jun. 1982. [14] T. S. Newman and A. K. Jain, “A survey of automated visual inspection,” Comput. Vis. Image Understand., vol. 61, no. 2, pp. 231–262, 1995. [15] E. N. Malamas, E. G. M. Petrakis, M. Zervakis, L. Petit, and J.-D. Legat, “A survey on industrial vision systems, applications, and tools,” Image Vis.Comput., vol. 21, pp. 171–188, 2003. [16] M. Unser, “Sum and difference histograms for texture classification,” IEEE Trans. Pattern Anal. Mach. Intell., vol. PAMI-8, no. 1, pp. 118–125, Jan. 1986. [17] H. D. Cheng, X. H. Jiang, Y. Sun, and J. Wang, “Color image segmentation: Advances and prospects,” Pattern Recognit., vol. 34, pp. 2259–2281, 2001. [18] Y. I. Ohta, T. Kanade, and T. Sakai, “Color information for region segmentation,” Comput. Graph. Image Process., vol. 13, pp. 222–241, 1980. [19] R. M. Haralick, K. Shanmugam, and I. Dinstein, “Textural features for image classification,” IEEE Trans. Syst., Man, Cybern., vol. SMC-3, no. 6, pp. 610–621, Nov. 1973. [20] R. M. Haralick, “Statistical and structural approaches to texture,” Proc. IEEE, vol. 67, no. 5, pp. 786–804, May 1979. [21] C. C. Gotlieb and H. E. Kreyszig, “Texture descriptors based on co-occurrence matrices,” Comput. Vis., Graph., Image Process., vol. 51, pp. 70–86, 1990. [22] M. Sharma, “Performance evaluation of image segmentation and texture extraction methods in scene analysis,” Ph.D. dissertation, Dept. Comp. Sci., Univ. Exeter, Exeter, U.K., 2001. [23] G. Paschos and M. Petrou, “Histogram ratio features for color texture classification,” Pattern Recognit. Lett., vol. 24, pp. 309–314, 2003. [24] Y.-C. Cheng and S.-Y. Chen, “Image classification using color, texture, and regions,” Image Vis. Comput., vol. 21, pp. 759–776, 2003. [25] R. E. Bellman, Adaptive Control Processes: A Guided Tour. Princeton, NJ: Princeton Univ. Press, 1961. [26] S. Wold, K. Esbensen, and P. Geladi, “Principal component analysis,” Chemometr. Intell. Lab. Syst., vol. 2, pp. 37–52, 1987. [27] A. R. Feinstein, “On the sensitivity, specificity, and discrimination of diagnostic tests,” Clin. Pharm. Ther., vol. 17, no. 1, pp. 104–116, 1975. [28] J. D. Luis-Delgado, J. Martínez-Alajarín, and L. M. Tomás-Balibrea, “Classification of marble surfaces using wavelets,” Electron. Lett., vol. 39, no. 9, pp. 714–715, 2003.
497
Juan Martínez-Alajarín (S’98) was born in Cartagena, Spain, in 1972. He received the B.Sc. and M.Sc. degrees in electrical and electronic engineering (both with honors) from the University of Murcia, Murcia, Spain, in 1994 and 1998, respectively. He is currently pursuing the Ph.D. degree in electronic engineering at the Universidad Politécnica de Cartagena, Cartagena, Spain. Currently, he is an Assistant Professor with the Department of Electronics, Computer Technology, and Projects, Universidad Politécnica de Cartagena. His research interests include image and signal processing, pattern recognition, artificial neural networks, and biomedical engineering.
José D. Luis-Delgado was born in Maracay, Venezuela, in 1971. He received the electronic engineering degree from the Instituto Universitario Politecnico de las Fuerzas Armadas Nacionales (IUPFAN), Maracay, in 1992, and the Magister Science degree in electronic engineering from the Simon Bolivar University, Caracas, Venezuela, with a grant research for the thesis work. He was with different Venezuelan universities from 1993 to 1998. In 1994, he was with the Digital Signal Processing Group, Simon Bolivar University, developing research works in wavelets analysis for image compression, where he was also with the Automatic Control for Production System Unity (UCASP), for the study of control for hybrid system using wavenets, petri nets, and optimal control, from 1997 to 1999. He joined the Vision and Robotics Research Group of the University of Murcia, Murcia, Spain, in March 1999. Since then, he has been working on research projects for vision and robotics systems.
Luis M. Tomás-Balibrea (M’94) received the B.Sc. degree in electrical and electronic engineering from the University of Murcia, Murcia, Spain, in 1984, the M.Sc. degree in electrical and electronic engineering from the University Technical of Valencia, Valencia, Spain, in 1988, and the Ph.D. degree (with honors) from the University of Murcia in 1992. He is currently a Full Professor with the University of Murcia, where he has also been the Head of the Vision and Robotics Research Group since 1993. He has also been a Technical Adviser for the Instituto de Fomento de la Region de Murcia. His research interests include computer vision, robotics and automation, artificial neural networks, and fuzzy logic. He has published more than 70 technical papers, and holds three patents. Dr. Tomás-Balibrea is a member of the IEE, IFAC, CEAI, EAYEI, and AER.
Authorized licensed use limited to: Universidad de Cartagena. Downloaded on May 10,2010 at 11:46:22 UTC from IEEE Xplore. Restrictions apply.