Japanese Society of Grassland Science ISSN1744-6961
PRACTICAL REPORT Blackwell Publishing Asia
Development of an automatic classification system for eating, ruminating and resting behavior of cattle using an accelerometer Nariyasu Watanabe1, Seiichi Sakanoue1, Kensuke Kawamura2 and Takaharu Kozakai1 1 National Agricultural Research Center for Hokkaido Region, Sapporo, Japan 2 National Institute for Agro-Environmental Sciences, Tsukuba, Japan
Keywords Accelerometer; discriminant function analysis; grazing; resting; ruminating. Correspondence Nariyasu Watanabe, National Agricultural Research Center for Hokkaido Region, Hitsujigaoka, Toyohira-ku, Sapporo 062-8555, Japan. Email:
[email protected] Present address: Graduate School for International Development and Cooperation, Hiroshima University, Japan. Received 10 April 2008; accepted 19 August 2008 doi: 10.1111/j.1744-697X.2008.00126.x
Abstract Monitoring behavior of grazing animals is important for the management of grazing systems. We developed a new automatic classification system for eating, ruminating and resting activities of cattle using a three-axis microelectromechanical systems (MEMS) accelerometer. We fitted the accelerometer to a Holstein cow in a tie-stall barn and to a Japanese Black cow at pasture, and measured their underjaw accelerations at 1-s intervals. The behavior of the animals was also videorecorded. The raw acceleration data was processed to create 12 variables: the mean, variance and inverse coefficient of variation (ICV; mean/standard deviation) per minute for the x-, y- and z-axis and the resultant. Quadratic discriminant analysis (QDA) was employed to classify eating, ruminating and resting activities, using 11 combinations of the variables as explanatory variables. In all axes and their resultant, approximately 99.6% of the raw acceleration values ranged between –19.6 m s–2 (–2 G) and 19.6 m s–2 (2 G), with an amplitude tendency of eating > ruminating > resting. Seven combinations of the variables produced total percent correct discriminations exceeding 90% in both tie-stalled and grazing cows. Overall, the highest discriminant score was obtained in the combination of the ‘Means and ICV’. Our results demonstrate that processing acceleration data with QDA is effective in statistically classifying eating, ruminating and resting activities of cattle.
Introduction The behavior of animals can be a clear indicator of their physiological and physical state (Frost et al. 1997). As eating, ruminating and resting are the main daily activities of ruminant livestock (Hancock 1954), monitoring these three activities in the pasture is key to many important management decisions in grazing systems. Such information enables herdsmen to check the living conditions of cattle in the pasture and make effective decisions about feed supplement and pasture management. Direct observation of behavior requires extensive labor and time. For this reason, various methods using a sensing apparatus as the replacement of direct observation have been developed, some as early as the 1950s and 1960s (Balch 1952; Oltjen et al. 1962; Stobbs & Cowper 1972). Some transducer systems, which are set up around the muzzle of cattle to record the jaw opening as a change of electric resistance, have © 2008 The Authors Journal compilation © 2008 Blackwell Publishing Ltd, Grassland Science, 54, 231–237
been successful in discriminating between eating and ruminating in free-ranging animals with good accuracy (Penning 1983; Matsui & Okubo 1991; Rutter et al. 1997). However, many of these systems are trial products or expensive, and require considerable skill and experience for positioning the sensor correctly on the animal’s under-jaw and interpreting the obtained data (Ungar & Rutter 2006). Because of these drawbacks, the techniques have been in limited use. Following advances in microelectromechanical systems (MEMS) technologies, behavioral studies of cattle have been advancing (Scheibe & Gromann 2006; Seo 2006; Wark et al. 2007). Thanks in large part to the miniaturization of acceleration sensors, it has become possible to store the apparatus, consisting of sensors, a battery and a data-logger, in a small, portable case. This MEMS apparatus has the advantages of easier mounting to the animal and a lack of wiring between sensors, battery and data-logger, decreasing the load to the animal.
231
Behavior classification using accelerometer
Seo (2006) measured the time of lying, standing, resting and eating in grazing cows using accelerometers fitted to the neck and the leg. Wark et al. (2007) visually classified eating, ruminating and sleeping in a grazing cow by combining acceleration data derived from the accelerometer with animal speed data derived from global positioning system (GPS) monitoring. Scheibe and Gromann (2006) found that there were some differences in waveform of the acceleration among the basic activity patterns (standing, grazing, walking, ruminating, drinking and hay uptake) in cows. These results suggest that the MEMS accelerometer is a powerful tool for distinguishing cattle activities in the pasture. However, the previous studies identified animal activities based on the visual assessment of the acceleration waveform; the accuracy of the technique was greatly dependent on the reader. Thus, there is a need to establish statistical classification methods that can automate the identification of animal activities. A method using a discriminant analysis function was developed in the 1930s (Fisher 1936) and has been applied to many attempts at animal activity pattern classification, as it has high discrimination rates (Schleisner et al. 1999). In the present study, for the purpose of developing a method for automatic classification of eating, ruminating and resting activities utilizing a MEMS accelerometer, we recorded the acceleration of the cow’s under-jaw movements in tie-stalled and grazing conditions, and then attempted a statistical discrimination of the three activities using the discriminant analysis function.
Materials and methods The study was comprised of two experiments. Both experiments were approved by the animal use ethical committee of the National Agricultural Research Center for Hokkaido region (NARCH) and carried out in accordance with the NARCH guidelines for the handling of laboratory animals.
Experiment 1: a Holstein cow in a tie-stall barn A lactating Holstein cow (24 months of age, ca. 480 kg) reared in NARCH was used. The cow was fitted with a halter and kept in a tie-stall barn for 2 weeks for acclimatization, being fed orchardgrass (Dactylis glomerata L.) silage and concentrate at 08.00 and 16.00 hours daily according to the Japanese feeding standard (AFFRCS 1999) recommendations for dairy cows yielding 30 kg milk day–1 and milked using a bucket milker 10 min after each feeding. Water and mineralized salt were freely available. Measurements were conducted for 4 h from the time right before feeding on 27 July () and July 28 ( and ) 2006. We used an accelerometer (75 mm × 60 mm × 32 mm, weighing 110 g; G-MEN DR10; SRIC, Nagano, Japan), which includes an orthogonal three-axis acceleration sensor and a
N. Watanabe et al.
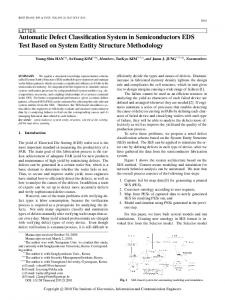
Figure 1 Illustration showing a small bag with a three-axis microelectromechanical systems (MEMS) accelerometer, attached to a halter. The x-, y- and z-axis of the accelerometer indicate the longitudinal (front-to-back), horizontal (side-to-side) and vertical body axes, respectively.
data logger that could store 16 300 units of data. The accelerometer was wrapped in a vinyl bag for waterproofing and placed in a small fabric bag, which was tied to the under part of the halter using a fabric belt 3 cm in width. The fabric bag with the accelerometer was positioned on the under-jaw of the cow to detect the movements (Figure 1). When the cow was in a standing posture with her head raised, the x-, y- and z-axis of acceleration indicated the longitudinal (front-to-back), horizontal (side-to-side) and vertical body axes, respectively. The acceleration sensor recorded both accelerations related to changes in the movements of the cow (dynamic accelerations) and static accelerations (–9.8 m s–2). The measurement range of the acceleration sensor was between –98.0 m s–2 (–10 G) and 98.0 m s–2 (10 G), and the measurement resolution was 0.98 m s–2. The sampling frequency and recorded interval of acceleration were set at 0.0312 and 1 s, respectively. Behaviors of the cow were also recorded by fixed charge-coupled device camera (IK-627VP; Toshiba, Tokyo, Japan) throughout the measurement periods.
© 2008 The Authors
232
Journal compilation © 2008 Blackwell Publishing Ltd, Grassland Science, 54, 231–237
Behavior classification using accelerometer
N. Watanabe et al.
Experiment 2: a Japanese Black cow under grazing The experiment was conducted in a mixed sown pasture at NARCH. The pasture, dominated by orchardgrass, perennial ryegrass (Lolium perenne L.), sweet vernalgrass (Anthoxanthum odoratum L.) and white clover (Trifolium repens L.), consisted of a flat section (3.1 ha) and a sloped section (5.0 ha) including a shelter wood (0.6 ha). Ten breeding Japanese Black cows and seven calves were stocked from early May to late October, 2006. We conducted four 3-h trials in the afternoon on 15, 21, 26 and 29 September, selecting a 10-year-old cow (ca. 540 kg). The cow wore the same halter with the attached accelerometer used in experiment 1. The sampling frequency and recorded interval were also the same (0.0312 and 1 s, respectively) as in experiment 1. The behavior of the cow was also recorded using a hand-held digital video camera (Mini DV Handycam DCR-TRV20; Sony, Tokyo, Japan).
Data processing From the obtained acceleration data, the mean, variance and inverse coefficient of variation (ICV; mean/standard deviation) per min were calculated: 60
Meanij =
1 ∑ xijt 60 t=1
[1]
60
Varianceij =
1 ∑ (xijt − meanij )2 60 t=1
ICVij = (meanij) (varianceij)–1/2
[2] [3]
where x is the acceleration value recorded every second (m s–2), i is the x-, y-, z-axis or resultant, j is the minute number of the acceleration recording (i.e. 1–734 under the tie-stalled condition and 1–579 under the grazing condition), and t is the time in s in each min number (i.e. 1–60). When the value of the variance was 0, the value was replaced by 0.001 (for an axis) or 0.0001 (for the resultant), in order to avoid division by zero in the ICV calculation. The meanij, varianceij and ICVij values were treated as 12 variables – Meanx, Meany, Meanz, Meanresul, Varx, Vary, Varz, Varresul, ICVx, ICVy, ICVz and ICVresul – each of which was a set of values with different js (1–734 or to 579). We classified the video-recorded behavior of the animals into four activities (eating, ruminating, resting and other) at 1-min intervals. Because the data for the activities classified as ‘other’ were few, only the three dominant activities (eating, ruminating and resting) were used for the subsequent analysis. We formed datasets by combining the three activities with the 12 variables concerning acceleration.
Data analysis In order to determine the differences for each variable among the three activities (eating, ruminating and resting), © 2008 The Authors Journal compilation © 2008 Blackwell Publishing Ltd, Grassland Science, 54, 231–237
and Tukey’s honest significant difference (HSD) post-hoc test were performed. Using various combinations of the 12 acceleration variables, we then examined Wilks’ λ statistic to determine whether the combination was effective for the subsequent discriminant function analysis (StatSoft 1996; Nagahata 2007). Wilks’ λ statistic varies 0–1, with 0 describing a perfect discriminant and 1 indicating no discrimination ability (StatSoft 1996). To create discriminant functions and validate them, we randomly divided the dataset into training and test datasets in the proportion of two to one, respectively. The division of the dataset was carried out 1000 times using a bootstrap method (Efron 1979). For each iteration, discriminant functions were calculated from the training dataset and the created functions were validated using the test dataset. Because Box’s M-test for the homogeneity of variance–covariance matrices in the combination of all variables was significant (tie-stall: χ2 = 12308.5, d.f. = 156, P < 0.01; grazing: χ2 = 6323.5, d.f. = 156, P < 0.01), quadratic discriminant analysis (QDA) was performed (StatSoft 1996; Jin 2007; Nagahata 2007). In QDA, a sample is classified into one group with the closest centroid, using the Mahalanobis distance based on the group-specific variance–covariance matrix (Jin 2007). For QDA, the three activities of the dataset were used as group variables and combinations of the acceleration variables were used as explanatory variables. Several combinations of the acceleration variables were tried to find high discriminant scores in QDA. We examined the difference of the percent correct discrimination of 1000 samplings among combinations of the acceleration variables, using Tukey’s HSD post-hoc test following . We used the software STATISTICA ver. 6.1 (StatSoft, Tulsa, OK, USA) for Wilks’ λ and Box’s M-test, the software JMP ver. 5.0.1a (SAS Institute, Cary, NC, USA) for and the post-hoc test, and R 2.3.1 (Ihaka & Gentleman 1996) for QDA with the bootstrap method.
Results Experiment 1: a Holstein cow in a tie-stall barn Figure 2 represents one example of the raw acceleration values measured on the x-, y- and z-axis and the resultant, respectively, with the three observed activities (eating, ruminating and resting) of a cow in a tie-stall barn. For all axes and the resultant, 99.6% of the raw acceleration values ranged between –19.6 m s–2 (–2 G) and 19.6 m s–2 (2 G), with an amplitude tendency of eating > ruminating > resting. Table 1 shows the total time and the mean, variance and ICV per minute of each axis and the resultant for each activity. The total time observed for eating, ruminating and resting activities during the measurement was 347, 258 and 129 min, respectively. The result of Tukey’s HSD post-hoc test following
233
Behavior classification using accelerometer
N. Watanabe et al.
indicated that in eight variables (Meanresul, Varx, Vary, Varz, ICVx, ICVy, ICVz and ICVresul), the values were significantly different among eating, ruminating and resting (P < 0.05). F-tests of Wilks’ λ statistic in each combination of variables showed significant differences among the activities (P < 0.01) (Table 2). The percent correct discriminations of each activity and the total were significantly different among the combinations (P < 0.01 in ). In seven combinations (x-axis variables, z-axis variables, Means, ICV, Means and variances, Means and ICV, and Means, variances and ICV), the total percent correct discriminations exceeded 90%, with ‘Means and ICV’ showing the highest value (94.9%) (P < 0.01 in Tukey’s HSD post-hoc test).
Experiment 2: a Japanese Black cow under grazing As in experiment 1, 99.8% of the raw acceleration values ranged between –19.6 m s–2 (–2 G) and 19.6 m s–2 (2 G), with an amplitude tendency of eating > ruminating > resting for all axes and the resultant. Table 3 shows the total time and the mean, variance and ICV per minute of each axis and the resultant in each activity. The total time observed in eating, ruminating and resting activities during the measurement was 324, 62 and 193 min, respectively. In Meanx, Meany, Varx and ICVx, the values were significantly different among eating, ruminating and resting (P < 0.05 in Tukey’s HSD post-hoc test). F-tests of Wilks’ λ statistic indicated that there were significant differences in each combination of variables among the activities (P < 0.01) (Table 4). The percent correct discriminations of each activity and the total were significantly different among the combinations (P < 0.01 in ). In seven combinations (x-axis variables, Means, ICV, Means and variances, Means and ICV, Variances and ICV, and Means, variances and ICV), the total percent correct discriminations exceeded 90%, while the total percent values of y-axis variables and z-axis variables were less than 52%. The combination of ‘Means and ICV’ was the highest performance (95.7%), as in experiment 1.
Discussion
Figure 2 Diagrams of raw acceleration values (m s–2) of the x-, y- and zaxis and the resultant, measured for a Holstein cow in a tie-stall barn at 1-s intervals on 27 July 2006 and the simultaneous activity patterns (eating, ruminating and resting), which were visually observed in the cow. Eat, eating; Ru, ruminating; Re, resting.
The present study confirmed that the utilization of acceleration was effective for classifying eating, ruminating and resting activities of cows, in agreement with other studies (Scheibe & Gromann 2006; Wark et al. 2007). In addition, by using discriminant function analysis against the acceleration dataset, statistical classification for the three activities of cattle became possible. Frost et al. (1997) suggested that the use of an accelerometer, rather than a switch as in the pedometer, allows greater sophistication in data processing, which should lead to more reliable results. In the future, it is
© 2008 The Authors
234
Journal compilation © 2008 Blackwell Publishing Ltd, Grassland Science, 54, 231–237
Behavior classification using accelerometer
N. Watanabe et al.
Table 1 Statistical details of the total time and the mean, variance and inverse coefficient of variation (ICV) of acceleration values per min along the x-, y- and z-axis and the resultant, for each activity (eating, ruminating and resting), recorded in a tie-stalled Holstein cow
Total time (min) Meanx (m s–2) Meany (m s–2) Meanz (m s–2) Meanresul (m s–2) Varx Vary Varz Varresul ICVx ICVy ICVz ICVresul
Eating
Ruminating
Resting
F-values of ANOVA
347 –5.6 ± 1.3b –1.3 ± 0.6a –6.5 ± 0.9a 10.5 ± 0.8b 23.0 ± 12.7a 6.6 ± 7.4a 21.1 ± 15.4a 18.6 ± 15.8a –1.2 ± 0.3c –0.6 ± 0.3a –1.7 ± 0.7a 2.8 ± 0.8c
258 –1.2 ± 1.3a –1.3 ± 0.8a –9.8 ± 1.0b 10.7 ± 0.8a 9.2 ± 4.1b 2.0 ± 2.0c 6.8 ± 3.8b 5.4 ± 2.6b –0.4 ± 0.4a –1.0 ± 0.6b –4.2 ± 1.3b 4.9 ± 1.1b
129 –1.1 ± 1.4a –1.6 ± 1.1b –8.6 ± 0.6b 9.3 ± 0.6c 3.3 ± 6.0c 4.0 ± 12.4b 2.9 ± 7.5c 4.1 ± 13.5b –0.7 ± 0.8b –2.2 ± 1.9c –19.0 ± 17.4c 20.0 ± 17.2a
1046.4* 8.5* 968.4* 150.9* 274.6* 28.8* 182.1* 111.8* 223.3* 149.9* 272.0* 273.3*
Means ± standard deviation are shown. *P < 0.01 in ANOVA. Values with different superscript letters in the same row are significantly different according to the Tukey’s honest significant difference (HSD) post-hoc test at P = 0.05.
Table 2 Wilks’ λ statistic and percent correct discrimination using combinations of acceleration variables, measured in a tie-stalled Holstein cow
x-axis variables (Meanx, Varx and ICVx) y-axis variables (Meany, Vary and ICVy) z-axis variables (Meanz, Varz and ICVz) Resultant variables (Meanresul, Varresul and ICVresul) Means (Meanx, Meany, Meanz and Meanresul) Variances (Varx, Vary, Varz and Varresul) ICV (ICVx, ICVy, ICVz and ICVresul) Means and variances Means and ICV Variances and ICV Means, variances and ICV
No. of variables
Wilks’ lambda
Eating
Ruminating
Resting
Total
3 3 3 3 4 4 4 8 8 8 12
0.225* 0.578* 0.157* 0.349* 0.153* 0.436* 0.327* 0.136* 0.104* 0.194* 0.092*
94.9 ± 1.7c 63.5 ± 5.9h 94.4 ± 2.2d 74.7 ± 4.5f 95.3 ± 1.8c 71.7 ± 4.2g 96.2 ± 1.9b 95.1 ± 1.9c 96.8 ± 1.6a 86.3 ± 2.9e 95.9 ± 1.8b
91.8 ± 3.5g 94.7 ± 2.3e 96.0 ± 2.0b 95.2 ± 3.0d 89.7 ± 3.2h 94.5 ± 2.6e 93.3 ± 2.8f 95.4 ± 2.0cd 96.5 ± 2.0a 95.8 ± 2.0bc 96.1 ± 2.0b
78.3 ± 5.1e 58.9 ± 6.3f 79.9 ± 4.8d 77.7 ± 5.0e 89.1 ± 4.6a 46.9 ± 30.0g 77.2 ± 5.7e 85.3 ± 5.2c 86.8 ± 4.5b 80.0 ± 5.4d 85.4 ± 5.5bc
90.9 ± 1.6f 73.7 ± 2.9j 92.4 ± 1.5d 82.4 ± 2.0h 92.2 ± 1.4d 75.4 ± 5.8i 91.8 ± 1.5e 93.5 ± 1.3c 94.9 ± 1.2a 88.5 ± 1.7g 94.1 ± 1.3b
*P < 0.01 in F-test of Wilks’ λ. Percent correct discrimination values are means ± standard deviation (n = 1000). Values with different superscript letters in the same column are significantly different according to the Tukey’s honest significant difference (HSD) post-hoc test at P = 0.01 after ANOVA (P < 0.01).
expected that the use of the MEMS accelerometer and data processing will allow the unattended monitoring and automatic classification of cattle activities over long periods of time. In the present experiment, almost all the acceleration data recorded under the jaw ranged between –19.6 m s–2 (–2 G) and 19.6 m s–2 (2 G). Scheibe and Gromann (2006) reported that most of the acceleration data recorded by collar were lower than 19.6 m s–2. In measuring the acceleration for classifying basic activity patterns of cattle on the jaw or neck, we consider that an accelerometer with the measurement range of ±19.6 m s–2 is adequate. The mean and variance of the acceleration values reflected well the postures and movements of the cow. For this reason, we make the following conclusions. In eating activity, the © 2008 The Authors Journal compilation © 2008 Blackwell Publishing Ltd, Grassland Science, 54, 231–237
under-jaw position of the cow is almost always downward and forward and thus, an accelerometer that is attached to the under-jaw, is also inclined in the downward and forward direction and the static acceleration of the accelerometer is dispersed at the x- and z-axis. Consequently, in the eating activity, the absolute values of the Meanx and Meanz were the highest and the lowest among the three activities, respectively, though there was no significant difference in the Meanz of experiment 2. Eating (grazing) activity also includes various dynamic movements: biting, chewing and head shaking while lowering the head. Due to these dynamic movements, amplitudes of the acceleration (variance) for all axes and the resultant were the largest in the eating activity. In ruminating activity, the under-jaw position of the cow is generally in the horizontal position and thus, the Meanz in ruminating
235
Behavior classification using accelerometer
N. Watanabe et al.
Table 3 Statistical details of the total time and the mean, variance and inverse coefficient of variation (ICV) of acceleration values per min along the x-, y- and z-axis and the resultant, for each activity (eating, ruminating and resting), recorded in a grazing Japanese Black cow
Total time (min) Meanx (m s–2) Meany (m s–2) Meanz (m s–2) Meanresul (m s–2) Varx Vary Varz Varresul ICVx ICVy ICVz ICVresul
Eating
Ruminating
Resting
F-values of ANOVA
324 –6.3 ± 1.3c –1.7 ± 3.0c –5.5 ± 3.7 6.7 ± 7.0a 22.4 ± 11.2a 8.3 ± 10.8a 8.3 ± 7.9a 12.2 ± 10.9a –1.4 ± 0.4c –0.4 ± 0.7b –2.4 ± 3.0a 2.9 ± 3.5 b
62 –1.1 ± 0.5b –0.7 ± 1.1b –5.9 ± 4.4 3.4 ± 8.9b 4.9 ± 15b 2.1 ± 1.2b 2.8 ± 3.8b 2.9 ± 4.4b –0.7 ± 0.4b –0.4 ± 0.9b –4.2 ± 3.7a 2.5 ± 6.7b
193 0.0 ± 0.7a 0.4 ± 1.6a –5.7 ± 4.4 3.3 ± 8.8b 1.2 ± 2.9c 1.2 ± 3.0b 1.4 ± 4.0b 1.7 ± 4.7b 0.2 ± 0.7a 0.6 ± 1.9a –15.0 ± 17.9b 9.8 ± 24.0a
2232.1* 44.6* 0.3 NS 13.3* 307.3* 49.7* 73.6* 99.3* 599.0* 39.4* 86.0* 15.2*
Means ± standard deviation are shown. *P < 0.01 in ANOVA. NS, not significant (P > 0.05). Values with different superscript letters in the same row are significantly different according to the Tukey honest significant difference (HSD) post-hoc test at P = 0.05.
Table 4 Wilks’ λ statistic and percent correct discrimination using combinations of the acceleration variables, measured in a grazing Japanese Black cow
x-axis variables (Meanx, Varx and ICVx) y-axis variables (Meany, Vary and ICVy) z-axis variables (Meanz, Varz and ICVz) Resultant variables (Meanresul, Varresul and ICVresul) Means (Meanx, Meany, Meanz and Meanresul) Variances (Varx, Vary, Varz and Varresul) ICV (ICVx, ICVy, ICVz and ICVresul) Means and variances Means and ICV Variances and ICV Means, variances and ICV
No. of variables
Wilks’ λ
Eating
Ruminating
Resting
Total
3 3 3 3 4 4 4 8 8 8 12
0.085* 0.787* 0.630* 0.628* 0.107* 0.451* 0.263* 0.102* 0.070* 0.151* 0.065*
98.5 ± 1.1a 33.9 ± 4.3h 45.4 ± 13.0g 74.8 ± 4.8e 95.3 ± 1.6b 65.0 ± 19.6f 93.7 ± 2.1c 97.7 ± 1.2a 98.0 ± 1.2a 92.0 ± 4.0d 98.3 ± 1.1a
53.7 ± 22.6g 89.6 ± 8.0c 81.5 ± 8.7e 95.0 ± 2.9a 89.4 ± 2.9c 34.3 ± 30.9h 91.9 ± 6.8b 78.2 ± 9.6f 92.3 ± 6.6b 85.5 ± 8.7d 81.6 ± 8.9e
88.6 ± 6.8c 48.1 ± 7.3f 51.7 ± 5.3e 77.4 ± 4.0d 89.0 ± 4.0c 76.9 ± 27.0d 89.0 ± 4.0c 89.2 ± 3.3c 92.8 ± 3.4a 90.8 ± 3.7b 92.6 ± 3.6a
90.4 ± 2.1e 44.6 ± 3.3i 51.4 ± 7.1h 82.4 ± 1.8f 92.1 ± 1.1d 65.7 ± 10.8g 92.0 ± 1.7d 93.2 ± 2.2c 95.7 ± 1.3a 90.9 ± 2.4e 94.6 ± 1.5b
*P < 0.01 in F-test of Wilks’ λ. Percent correct discrimination values are means ± standard deviation (n = 1000). Values with different superscript letters in the same column are significantly different according to the Tukey honest significant difference (HSD) post-hoc at P = 0.01 after ANOVA (P < 0.01).
revealed the effects of static acceleration. Ruminating activity also includes some dynamic movements: chewing, regurgitation and swallowing of ruminant ingesta. Especially, chewing activates the movement of the under-jaw of the cow and thus, the amplitudes of the acceleration in all axes except the Vary in experiment 1 were ranked second of the three activities. Lastly, the resting activity was characterized by the smallness of the movements. The amplitudes of the acceleration in all axes except the Vary in experiment 1 were ranked last. In both experiment 1 and 2, the discriminant function using the ‘Means and ICV’ as explanatory variables had the highest correct discriminant scores. Mean variables, as referred to above, seem to have been most effective at detecting differences in body posture (static acceleration) for each activity.
On the other hand, ICV variables are synthetic variables that take both mean variables as the numerator and the square root of variance variables as the denominator into consideration. ICV values increase as the amplitudes of acceleration decrease and decrease as the amplitudes of acceleration increase, taking the effect of the posture (mean-variables) into consideration. Thus, ICV variables seem to have been effective in detecting both the differences in body posture (static acceleration) and the differences in movements (dynamic acceleration) for each activity. The discriminant functions using the x-axis variables (front-to-back axis variables) had at least 90% correct discrimination rates in both experiment 1 and 2. Previously, acceleration in the front-to-back axis has been shown to be
© 2008 The Authors
236
Journal compilation © 2008 Blackwell Publishing Ltd, Grassland Science, 54, 231–237
N. Watanabe et al.
effective in discriminating the eating and drinking of a domestic cat (Watanabe et al. 2005). On the other hand, discrimination rates using the y-axis variables (side-to-side axis variables) were low. In the measurement of the z-axis (vertical body axis), the results were different in experiment 1 and 2. However, we could not know whether the difference resulted from different experimental conditions or individual differences. In the future, the measurement of acceleration using many individuals is required. According to direct observations of Japanese Black cows stocked in pastures (Aoki et al. 1963), the proportions of 24 h spent eating, ruminating, resting and in other activities were 42.7%, 24.5%, 26.9% and 6.0%, respectively. Though the proportion of the ‘other’ activities is the smallest, it seems not to be negligible for predicting each activity time accurately over a long period of time. As the next step, a discriminant function analysis that takes into account other activities is needed.
Acknowledgments We are grateful to Dr Keisuke Ono of the National Institute for Agro-Environmental Sciences and Dr Sadaki Asakuma of Intensive Grazing Research Team, NARCH for their discussion of statistical analysis. We also express sincere appreciation to Mr Kei Imura of Rakuno Gakuen University, Ms Shizue Nakajima of Intensive Grazing Research Team, NARCH and to all the staff members at Research Support Center, NARCH, for assistance in field experiments. This work was supported by a Grant-in-Aid for Young Scientists (B) (19780204) of Japan’s Society for the Promotion of Science (JSPS).
References Agriculture, Forestry and Fisheries Research Council Secretariat (AFFRCS), MAFF (1999) Japanese Feeding Standard for Dairy Cattle (1999). Japan Livestock Industry Association, Tokyo, 1–189. (In Japanese.) Aoki S, Kato M, Fujimitsu M, Takeda S (1963) Physiological and ecological studies on the grazing cattle. I-4. Grazing behaviors of Japanese Black breed of cattle grazed on pasture. Bull Shimane Agric Coll 11 (A): 35–39. (In Japanese with English summary.) Balch CC (1952) Factors affecting the utilization of food by daily cows. 6. The rate of contraction of the reticulum. Bri J Nutr 6: 366–375. Efron B (1979) Bootstrap methods: another look at the jackknife. Ann Stat 7: 1–26. Fisher RA (1936) The use of multiple measurements in taxonomic problems. Ann Eugen 7: 179–188.
© 2008 The Authors Journal compilation © 2008 Blackwell Publishing Ltd, Grassland Science, 54, 231–237
Behavior classification using accelerometer
Frost AR, Schofield CP, Beaulah SA, Mottram TT, Lines JA, Wathes CM (1997) A review of livestock monitoring and the need for integrated systems. Comput Electron Agric 17: 139–159. Hancock J (1954) Studies of grazing behaviour in relation to grassland management. I. Variations in grazing habits of dairy cattle. J Agric Sci 44: 420–427. Ihaka R, Gentleman R (1996) R: a language for data analysis and graphics. J Comput Graph Stat 5: 299–314. Jin M (2007) Data Science by ‘R’. Morikita Publishing, Tokyo, 164 –182. (In Japanese.) Matsui K, Okubo T (1991) A method for quantification of jaw movements suitable for use on free-ranging cattle. Appl Anim Behav Sci 32: 107–116. Nagahata H (2007) Discriminant Analysis, 1–48. [Cited 19 June 2008.] Available online: http://www.e.okayama-u.ac.jp/~nagahata/bstat/rta4syo.pdf (In Japanese.) Oltjen RR, Sirny RJ, Tillman AD (1962) Purified diet studies with sheep. J Anim Sci 21: 277–283. Penning PD (1983) A technique to record automatically some aspects of grazing and ruminating behaviour in sheep. Grass Forage Sci 38: 89–96. Rutter SM, Champion RA, Penning PD (1997) An automatic system to record foraging behaviour in free-ranging ruminants. Appl Anim Behav Sci 54: 185–195. Scheibe KM, Gromann C (2006) Application testing of a new three-dimensional acceleration measuring system with wireless data transfer (WAS) for behavior analysis. Behav Res Methods 38: 427–433. Schleisner C, Norgaard P, Hansen HH (1999) Discriminant analysis of patterns of jaw movement during rumination and eating in a cow. Acta Agric Scand Sect a, Anim Sci 49: 251–259. Seo T (2006) Understanding of cattle grazing behaviour using sensors. The contribution to early detection of abnormal behavior in cattle. Dairyman 56(9): 50–51. (In Japanese.) StatSoft (1996) STATISTICA Users’ Manual. StatSoft Japan, Tokyo, Japan, 3055–3090. (In Japanese.) Stobbs TH, Cowper LJ (1972) Automatic measurement of the jaw movements of dairy cows during grazing and rumination. Trop Grassl 6: 107–112. Ungar ED, Rutter SM (2006) Classifying cattle jaw movements: comparing IGER behaviour recorder and acoustic techniques. Appl Anim Behav Sci 98: 11–27. Wark T, Corke P, Sikka P et al. (2007) Transforming agriculture through pervasive wireless sensor networks. Pervasive Computing 6: 50–57. Watanabe S, Izawa M, Kato A, Ropert-Coudert Y, Naito Y (2005) A new technique for monitoring the detailed behaviour of terrestrial animals: a case study with the domestic cat. Appl Anim Behav Sci 94: 117–131.
237