Oct 16, 2007 - Salzman, 1998; Nielsen, 1993) or those suggested by Henry and Grossnickle. (2004) or the barrier ..... Jakob Nielsen. Usability engineering.
Automatic testing, page sampling and measuring web accessibility Giorgio Brajnik Dip. di Matematica e Informatica Universit`a di Udine, Italy www.dimi.uniud.it/giorgio October 16, 2007 Abstract The talk will highlight several issues related to processes that are normally used to assess, and sometimes, measure the accessibility level of web sites. These processes include sampling pages, testing and analyzing them, and measuring their accessibility level. In many cases these processes introduce bias and errors, leading to wrong and invalid conclusions about accessibility.
Extended abstract Several methods can be adopted for assessing accessibility of a web site: it can be tested with respect to guidelines (like WCAG 1.0, or Section 508) through a standards review method, other methods can be employed, like user testing (DRC, 2004) or usability inspection methods (Preece et al., 2002; Gray and Salzman, 1998; Nielsen, 1993) or those suggested by Henry and Grossnickle (2004) or the barrier walkthough method (Brajnik, 2007, 2006). Several metrics have been proposed to measure the accessibility level, so that features of web sites are mapped to a value representing the accessibility level of the site. In order to distinguish accessibility from conformance, we adopt the following definition, derived from Slatin and Rush (2003); U.S. Government (1998): “a web site is accessible if people with some impairment 1
can use it with the same effectiveness and safety as non-disabled people”. In this context, a failure mode of a web site is any accessibility hindrance that appears when somebody uses the web site. Sullivan and Matson (2000) define the failure rate (FR) on the basis of a subset of eight WCAG 1.0 checkpoints. The FR of a page is defined as the number of violations of any of those checkpoints divided by the maximum number of violations of any of those checkpoints that can take place (i.e. by the number of possible violations). By doing so, two pages that include 10 images, one with 3 properly defined “alt-text”, the other with 8, have FR = 0.7 and FR = 0.2 respectively. The advantage of such a metric lies in its simplicity: it’s easily interpretable, it provides normalized, quantitative and absolute values. However, with a large set of checkpoints, FR values tend to be close to 0, reducing the ability to discriminate among web sites that are fairly accessible. Furthermore, such a metric is based on conformance rather than accessibility (as defined above) and it does not consider severity of detected violations. FR also leads to apparently counterintuitive results: for example, a page with 3 violations over 20 possible violations scores better than a page with 1 violation over 5, even though it actually shows a higher number of violations. Zeng (2004) defines the Web Accessibility Barrier Score (WAB), for a web site constituted by NP pages {p, ...}, analyzed by WCAG 1.0 � check� F R(p,c) 1 P P points {c, ...} having priorities priorityc , as WAB = NP p c priority , c where F R(p, c) is the failure rate of checkpoint c on page p. Also in this case, a high WAB means a low accessibility level; WAB yields quantitative absolute values that are not normalized. This metric is based on conformance, and considers also the priority level of the checkpoints: higher priorities mitigate corresponding failure rates. The Unified Web Evaluation Methodology 1.0 (UWEM) Velleman et al. (2006) is a methodology designed to assess accessibility by merging manual and automatic evaluations. Within such a context, the accessibility value of a Q page p is AVp = 1− c (1−Rpc Fc ), where Fc is the probability that a violation of checkpoint c results in a failure mode (Fc is assumed to be constant, set to 0.05), whereas Rpc is a factor that depends on the agent who carries out the evaluation of the checkpoint. If it is a tool, then Rpc is the failure rate combined with the error rate of the tool; if it is an expert, then Rpc is the probability of error of the expert1 . AV p gives the probability that the page 1
Although Velleman et al. (2006) mentions the probabilities that the tool and the expert
2
leads to a failure mode; its mean over all the pages gives the accessibility value for the entire web site. The advantages of this conformance-based metric are that it yields a quantitative, normalized and absolute value, and that it is rooted on a clean mathematical background. In addition, the metric (in its more general definition) considers error rates, the impact on users, and supports integration of manual with automatic evaluations. However, from a practical viewpoint, no suggestions are given on how to reliably estimate these parameters. Web Accessibility Quantitative Metric (WAQM) Arrue et al. (2005) provides a solution to some of the problems discussed above. On the basis of automatic testing of WCAG 1.0 checkpoints, WAQM considers the failure rate of each checkpoint on each page: F R(p, c). Such a failure rate is transformed, through a piecewise linear function that approximates a hyperbole, to values that are more spread out as they get close to 0. These values are then weighted by priority of the checkpoint, and finally weighted by dp = e−i , where p is a page and i is its depth level in number of links from the home page (for which i = 0). Weights associated to priorities, slopes and intercepts of the piecewise linear function need to be experimentally tuned. A further study Vigo et al. (2007) discusses the dependence of the WAQM metric on the specific tool being used, and shows that although the numeric values produced by WAQM are tool-dependent, the ranking of web pages and web sites does not depend significantly on the tool. Advantages of WAQM include that it produces normalized quantitative values dependent on checkpoint priorities. On the other hand, it does not consider the error rate of the tool being used, and it does not provide means to combine automatic and manual evaluations. Anther metric is based on the evaluation form used by the Accessibility Internet Rally (AIR) judges. In this competition among web developers (designed and managed by Knowbility), a web site is ranked according to points given to it by human judges. A spreadsheet2 is used to collect the data and compute the score on the basis of penalty points associated to certain defects: for example, a deduction up to 20 points (out of 320) for images yield false negatives and false positives, no suggestions are given as to how to compute these probabilities, except for assuming that they are 0; in such a case Rpc becomes the failure rate F R(p, c) when using a tool, 0 when the expert did not find any violation of c on p, 1 if the expert found at least one violation. 2 See www.knowbility.org/air-austin/?content=judgingFAQ for details about the process and the actual judging form.
3
bearing information that have no proper alternative text. The criteria used by the judges include accessibility and usability aspects (e.g. aesthetics is also considered) and are not directly related to WCAG or Section 508 checkpoints, although addressing all important accessibility barriers. While providing a structured way to compute an accessibility score, AIR is not based on automatic testing tools (although judges can use them) and it does not specify which pages of the web site should be considered. Therefore it is not clear how much AIR scales up when applied to web sites that are highly dynamic or very large. SAMBA (Brajnik and Lomuscio, 2007) is a metric that was developed in order to address accessibility, as opposed to conformance, and still be based on automatic testing tools. SAMBA (Semi-Automatic Method for measuring Barriers of Accessibility) is a measuring methodology and a metric that merge human judgments with automatic testing, that go beyond conformance, and that provide values useful to understand how accessible a web site is with respect to some specific user category. It is based on the following key points: 1. Using tools to automatically identify potential accessibility barriers; 2. Sampling results that are submitted to human judgment. In order to judge sampled barriers, experts have: 1. to define user profiles (i.e. type of disability, experience level); 2. to define user scenarios (i.e. assistive technology, possible goals and user roles); 3. to select relevant types of barriers from existing lists; 4. to evaluate pages against barriers in the context of scenarios with respect to goals that users may achieve; 5. to estimate severity of detected barriers. 3. Statistically estimating — from the sample — false positives and severity of barriers for the entire web site; 4. Grouping barriers by disability types and deriving scores that represent non-accessibility with respect to disability type as well as a global nonaccessibility level. An important contribution of SAMBA is that differently from other automatable metrics, it is not based on conformance nor in failure rates, but it uses human judgements to 1) filter out noise produced by the testing tool, 2) to associate a severity (minor, significant, critical) to sampled barriers, and 3) to statistically derive upper and lower bounds on the accessibility level. 4
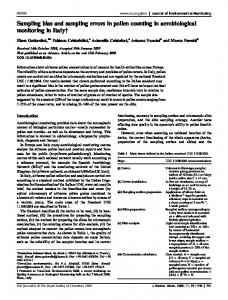
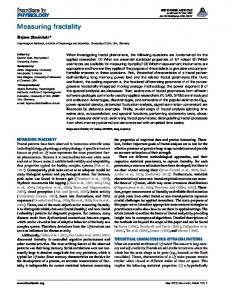
Figure 1: Distribution of intervals for AI. Figure 1 shows the distribution and width of the intervals of AI, the accessibility index computed by SAMBA over 15 web sites (results are taken from the study described in (Brajnik and Lomuscio, 2007)). Intervals of AI induce a partial order relationship on web sites, based on whether intervals overlap or not. Table 1 shows the pair-wise distance between AI for some of the sites. The distance between two intervals is 0 if they overlap or just touch, and it is the difference of adjacent endpoints otherwise. From the table it’s easy to see that, for example, london is more accessible than most other web sites, except for calgary, bolton and pretoria. It is also very close to five others, while being 22 points more accessible than nigeria. Since AI is computed from the confidence intervals severity matrix, these differences are valid (because free from tool errors), appropriate for accessibility (because they consider severities), significant (because they are conservative) and reliable (because they are statistically inferred). Another key ingredient of evaluating web accessibility is the method used for sampling pages. Except for trivial cases, any accessibility evaluation has to be based on some method for selecting pages to be analyzed. But this selection process may bias the evaluation. Up to know, not much is known about available selection methods, and about their effectiveness and 5
... irishTimes nigeria daily outlook dundee smh berkeley lancaster belfast kansas cambridge calgary bolton pretoria london
belfast 0 0.05 0 0 0 0 0 0
kansas 0 0.07 0 0 0 0 0 0 0
cambridge 0.02 0.09 0 0 0 0 0 0 0 0
calgary 0.05 0.12 0 0 0 0 0 0 0 0 0
bolton 0.11 0.18 0.05 0.05 0 0 0 0 0 0 0 0
pretoria 0.11 0.18 0.05 0.05 0 0 0 0 0 0 0 0 0
london 0.15 0.22 0.09 0.09 0.04 0.02 0.04 0.02 0.02 0.02 0.02 0 0 0
Table 1: Portion of the distance table between sites; for example, to go from nigeria (row) to belfast (column), AI increases by 0.05. efficiency. In all practical cases we have to face the problem of selecting only a small portion of the web pages in order to compute the metric value. This is usually due to the sheer size of some web sites (e.g. King et al. (2005) discusses assessments of a web site comprising 30 million pages), to the highly dynamic content of web sites, especially “Web 2.0” ones, and to the need of applying human judgment in order to decide whether certain web site features impact accessibility. Several sampling methods have been proposed so far. Ad hoc methods specify predefined criteria to choose web pages, such ad the home page, site map, contact page, and a representative page for each subsection of the web site. Other sampling methods are probabilistic in nature (e.g. random walk and uniform random sampling) and other ones are based on error profiles computed by accessibility testing tools. The uniform random sampling method, which guarantees that each page of the web site has the same probability to be included in the sample, is conceptually simple, but for large and dynamic web sites it is not practical since rarely one has an exhaustive list of all the pages ready to choose from and often the same url may lead to content that changes over time. However, this method can be easily approximated by having a tool download a large set of the pages and then implement a random sampling with no replacement 6
from such a set. Henzinger et al. (2000); Ulltveit-Moe et al. (2006) discuss two methods based on random walks over links between pages. The first method encompasses two phases; a walk phase during which, starting from the home page, with probability d an outgoing link and its destination page is selected, and with probability 1 − d the walk returns to another page selected from the set of already-visited pages. The subsequent sampling phase selects some of the pages visited during the walk phase so that each of the visited pages has the same probability to be included in the final sample. The second method, developed in the context of the European Internet Accessibility Observatory (EIAO) EIAO, for each page included in an initial pool, and for each of the links leaving the page, selects the corresponding destination page with probability d. d is recomputed at every cycle so that pages have the same probability to be selected. Sampling methods based on distributions of violations have the advantage of selecting pages on the basis of information relevant to accessibility evaluations. King et al. King et al. (2005) describe a sampling method based on clustering pages according to similarity of the distribution of checkpoint violations (called error profile) and to urls sharing a prefix. More specifically, the error profile of a page is a vector with n components, each consisting of the number of violations of a list of n checkpoints. Only automatically testable checkpoints are included, and the important assumption is made that automatically testable checkpoints have the same distribution as those that are not automatically testable). Using a clustering algorithm applied to a distance metric defined on error profiles, King et al. produced several clusters of pages. From each cluster they randomly sampled pages until a sample of size proportional to the average distance between error profiles in that cluster was reached. In this way, clusters with more heterogeneous error profiles lead to larger samples, coping therefore with the increased difference between profiles. A study that compared these sampling methods (Brajnik et al., 2007) reported that the quality of the methods (represented by the mean systematic error) is related to the metric that is being used (the study considered a conformance metric, WAQM and UWEM). In fact, accuracy of methods depends heavily on the metric, i.e. on the purpose for which sampling is performed. This means that the choice of the sampling method should be made after careful analysis, since the method will dramatically affect the outcome. The conformance metric is by far the most sensible one with respect 7
to method changes and sample size. In the worst case, inaccuracy can be so high that more than 50% of the checkpoints showing a violation are not detected; in the best case it can be 1.2%. Accuracy also depends on sample size. Sample size accounts, with conformance metric, for more than 11% difference in accuracy. In order to reach 5% or less of inaccuracy, with conformance a sample of at least 50 is needed. For the other two metrics sample size is not so important: with just one page one can get an error as low as 3.9% for WAQM and 5% for UWEM.
References M. Arrue, M. Vigo, and J. Abascal. Quantitative metrics for web accessibility evaluation. In Proceedings of the ICWE 2005 Workshop on Web Metrics and Measurement, 2005. G. Brajnik. Ranking websites through prioritized web accessibility barriers. In Technology and Persons with Disabilities Conference, Los Angeles, March 2007. CSUN, California State University Northridge. www.dimi. uniud.it/giorgio/papers/csun07.pdf. G. Brajnik. Web Accessibility Testing: When the Method is the Culprit. In K. Miesenberger, J. Klaus, W. Zagler, and A. Karshmer, editors, ICCHP 2006, 10th International Conference on Computers Helping People with Special Needs, Lecture Notes in Computer Science 4061, Linz, Austria, July 2006. Springer Verlag. G. Brajnik and R. Lomuscio. Samba: a semi-automatic method for measuring barriers of accessibility. In S. Trewin and E. Pontelli, editors, 9th Int. ACM SIGACCESS Conference on Computers and Accessibility, ASSETS, Tempe, AZ, Oct 2007. ACM Press. G. Brajnik, A. Mulas, and C. Pitton. Effects of sampling methods on web accessibility evaluations. In S. Trewin and E. Pontelli, editors, 9th Int. ACM SIGACCESS Conference on Computers and Accessibility, ASSETS, Tempe, AZ, Oct 2007. ACM Press. DRC. Formal investigation report: web accessibility. Disability Rights Commission, www.drc-gb.org/publicationsandreports/report.asp, April 2004. Visited Jan. 2006. 8
EIAO. European Internet Accessibility Observatory. www.eiao.net. W.D. Gray and M.C. Salzman. Damaged merchandise: a review of experiments that compare usability evaluation methods. Human–Computer Interaction, 13(3):203–261, 1998. S.L. Henry and M. Grossnickle. Accessibility in the User-Centered Design Process. Georgia Tech Research Corporation, Atlanta, Georgia, USA, 2004. On–line book, www.UIAccess.com/AccessUCD. M. R. Henzinger, A. Heydon, M. Mitzenmacher, and M. Najork. On nearuniform URL sampling. In Proceedings of the 9th international World Wide Web conference on Computer Networks: the International Journal of Computer and Telecommunications Networking, pages 295–308, Amsterdam, The Netherlands, 2000. North-Holland Publishing Co. doi: dx.doi.org/10.1016/S1389-1286(00)00055-4. M. King, J.W. Thatcher, P.M. Bronstad, and R. Easton. Managing usability for people with disabilities in a large web presence. IBM Systems Journal, 44(3):519–535, 2005. Jakob Nielsen. Usability engineering. Academic Press, Boston, MA, 1993. J. Preece, Y. Rogers, and H. Sharp. Interaction design. John Wiley and Sons, 2002. John Slatin and Sharron Rush. Maximum Accessibility: Making Your Web Site More Usable for Everyone. Addison-Wesley, 2003. T. Sullivan and R. Matson. Barriers to use: usability and content accessibility on the web’s most popular sites. In Proc. of ACM Conference on Universal Usability, pages 139–144, 2000. N. Ulltveit-Moe, M. Snaprud, A. Nietzio, M. Goodwin Olsen, and C. Thomsen. Early Results from Automatic Accessibility Benchmarking of Public European Web Sites from the EIAO. eiao.net/publications, 2006. Visited: May 2007. U.S. Government. SEC. 508. ELECTRONIC AND INFORMATION TECHNOLOGY, 1998 Amendment to Section 508 of the Rehabilitation Act. www.section508.gov/index.cfm?FuseAction=Content&ID=14, 1998. Visited: January 2007. 9
E. Velleman, C. A Velasco, M. Snaprud, and D. Burger. D-WAB4 Unified Web Evaluation Methodology (UWEM 1.0). Technical report, WAB Cluster, 2006. M. Vigo, M. Arrue, G. Brajnik, R. Lomuscio, and J. Abascal. Quantitative metrics for measuring web accessibility. In W4A ’07: Proceedings of the 2007 International Cross-Disciplinary Workshop on Web Accessibility (W4A), pages 99–107, New York, NY, USA, 2007. ACM Press. ISBN 1-59593-590-X. doi: \url{http://doi.acm.org/10.1145/1243441.1243465}. www.dimi.uniud.it/giorgio/papers/w4a07.pdf. X. Zeng. Evaluation of Enhancement of Web Content Accessibility for Persons with Disabilities. PhD thesis, University of Pittsburgh, 2004.
10