Automatic Validation of Terminology Translation Consistency with Statistical Method Masaki Itagaki, Takako Aikawa, Xiaodong He Microsoft Corp. One Microsoft Way Redmond, WA 98052 U.S.A.
[email protected],
[email protected],
[email protected] Abstract This paper presents a novel method to automatically validate terminology consistency in localized materials. The goal of the paper is two-fold. First, we explore a way to extract phrase pair translations for compound nouns from a bilingual corpus using word alignment data. To validate the quality of the extracted phrase pair translations, we use a Gaussian mixture model (GMM) classifier. Second, we quantify consistency of translation as a measurement of quality. With this approach, a quality assurance process for terminology translation can be fully automated. It can also be used for maintaining bilingual training data quality for machine translation.
1. Introduction Consistency is one of the primary quality measurements of translation. However, terminology can be translated differently, depending on a given context. For instance, one source term (e.g., “file name” in English) can have multiple variations in the target language (e.g., “ファイル の名前”, “ファイル名”, “文書名” in Japanese). Having multiple translations for such terms is inevitable by nature. However, if inconsistent term translations occur in similar contexts or are used for the same product, it is confusing to users. Consistency in terminology translations is critical to the readability of localized materials. Consistency in terminology translations is also critical to any example-based/statistical machine translation (MT) quality. The quality of such MT systems depends on the quality of their training data. Any inconsistency in terminology translations could lead to lower MT quality. Terminology translation inconsistency may derive from different sources, such as a lack of standardized terminology data. For instance, product development groups in a software company could use their own terminology and translations. Under such circumstances, the task of controlling terminology and checking terminology consistency is quite challenging. Human errors might be another cause for terminology inconsistency. For instance, using a translation memory (TM) tool that recycles previous translations, a translator could blindly copy an old translation without paying attention to a given context. Again, controlling such situations is almost impossible. In this paper, we explore a way to extract a bilingual compound noun list and check terminology translation consistency of the extracted terms automatically. We start with the process of mining compound nouns from English-Japanese bilingual corpus data. This process consists of two steps: (i) extracting a list of compound nouns from the source language data (in our experiments, English is the source language) and (ii) extracting a bilingual phrase table. The first step utilizes the part-ofspeech (POS) information of the data. The second step uses the word-alignment information provided by Giza++. The intersection of the two becomes our initial list. We use a Gaussian mixture-model (GMM) classifier to find
valid phrase pair translations from this list. The final step is to measure the terminology translation consistency. We devise a consistency index utilizing HerfindahlHirschman Index (Herfindahl, 1959; Hirshman, 1964), a commonly used measurement of market concentration. The organization of the paper is as follows: Section 2 describes the data we used and the process of extracting English compound nouns. Section 3 presents the process of extracting phrase pair translations for compound nouns from our bilingual corpus data. Section 4 describes the GMM classifier used in our experiment and the results of the experiment. Section 5 addresses the problem of terminology consistency and describes the consistency index we devised. Section 6 provides a summary of the paper and concluding remarks.
2. Data & Extraction of English Compound Nouns 2.1 Data We used English-Japanese parallel corpus data from software user interface (UI) strings, such as menu items, error messages and wizard text. Table 1 provides the size of the data used in the proposed experiments as well as the number of the products involved in the data.
English/Japanese
Sentences 300K
# of Products 104
Table 1: Training data
2.2 Extraction Method We extracted English compound nouns from the training data. To identity compound nouns in the English corpus, we parsed and analyzed the part-of-speech for all English sentences, using an English parser developed at Microsoft Research (NLPWin) (Heidorn, 2000). Then, we extracted consecutive-noun terms such as N/N as in “file name” and N/N/N as in “application programming interface”. The number of noun words within one compound term was limited to five.
We identified a total of 38,519 compound nouns from the English data of the English-Japanese corpus. Table 2 provides some samples of extracted compound nouns. form template disk space user name tools menu color scheme web browser start date file type
file type data connection company accounts database retrieval service dialog boxes network access path name security information
Table 2: Sample compound nouns
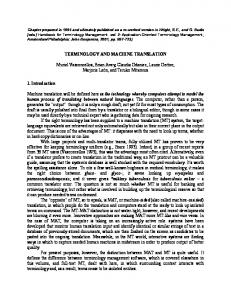
3. Phrasal Alignment Process Independently of the English compound noun extraction, we extracted a phrase table from the bilingual corpus data as shown in Table 1. The Giza++ (Och and Ney, 2000c) toolkit for IBM models (Brown et al., 1994) and HMM (Och and Ney, 2000a) is used to provide word alignment for the bilingual data. During implementation, we performed five iterations of model 1, followed by five iterations of HMM and then five iterations of model 4. As in Koehn et al. (2003), the bilingual corpus is aligned bidirectionally, i.e., first we perform word alignment from English to Japanese and second from Japanese to English, respectively. Then these two alignments are combined to form the final word alignment with the heuristics described in Och and Ney (Och and Ney, 2000b). From the bidirectional word alignment, we extracted phrasal translation pairs that are consistent with the word alignment. This means that words in a phrase pair are only aligned to each other (Och et al., 1999). The maximum phrase length used in our experiments was set to four. We now have two lists: (i) the list of the English compound noun described in Section 2.2 and (ii) the list of the bilingual phrasal translation pairs. We simply extracted the overlap between the two lists; that is, the phrase pairs whose English side strings are the same strings as those in the English compound noun list. The overview of the bilingual compound noun extraction process is described in Figure 1 below. Source (English)
Target (Japanese) Word-alignment
Extraction of compound nouns
Extraction of phrase pair translations
Intersection => Bilingual Phrase Table for Compound Nouns
Figure 1: Extraction of the initial bilingual phrase table for compound nouns
The extracted bilingual phrasal translation pairs are far from perfect. For instance, Table 3 provides some examples from the initial English-Japanese phrase table,. server administrator サーバー の 管理者 サーバー 管理者 参加 依頼* 依頼*
network connection ネットワーク へ 接続* ネットワーク の 接続 ネットワーク は 接続* ネットワーク 接続
Table 3: Examples of phrase pair translations for English and Japanese The items with an asterisk in the above tables are not the proper target candidates for the English compound nouns in question. We explored a statistical method to eliminate such false candidates while keeping the recall as high as possible. This method is described in Section 4.
4. Calculating Translation Validity 4.1 Features for Translation Validity When extracting phrase tables we can also estimate phrase translation probabilities. That is, if we use s to denote the phrase at the source side and t to denote the phrase at the target side, we can estimate the probability of translating s to t by relative frequency (Koehn et al., 2003).
p (t | s )
count (t , s ) t ' count (t ', s)
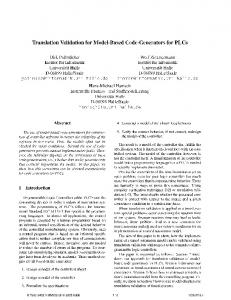
In our implementation, for each phrase pair we actually estimate two probabilities, p(t|s) and p(s|t), for translations from the source phrase to the target phrase and from the target phrase to the source phrase, respectively. Both probabilities are estimated by relative frequency as shown above. In the following sections, we will call them MLE1 and MLE2 scores, respectively. MLE1 and MLE2 scores describe the likelihood of translating s to t and vice versa. Based on these two scores, we can further build a classifier to decide whether the translation of phrase s to t is a valid translation. In order to train a translation validity classifier, we first built a training set. We drew a number of phrase pairs from the phrase table, and asked a human annotator to mark each of them as either valid or invalid translation. In Fig. 2, we plot out the (MLE1,MLE2) scores of phrase pairs in our English-Japanese classifier training set, where the cross mark „x‟ represents an invalid translation, and the circle mark „o‟ represents a valid translation. As expected, most invalid translations have both low MLE1 and MLE2 scores.
Given training samples of valid translations and invalid translations, the parameters of v and i , including
1
mixture weights, mean vectors and covariance matrices of Gaussian mixtures, can be trained using the maximum likelihood (ML) criterion. Specifically, for the GMM of the valid translation class, v is trained by:
0.9 0.8 0.7 0.6
N
v arg max p( xn | )
0.5 0.4
0.2 0.1 0
0
0.1
0.2
0.3
0.4
0.5
0.6
0.7
0.8
0.9
1
Figure 2, illustration of feature distribution of training data. The horizontal axis is MLE1, vertical axis is MLE2.
4.2 Gaussian Mixture Model based Classifier In our method, the Gaussian mixture model is used to build a Bayesian classifier (Bishop, 2006). Compared with other classifiers such as Support Vector Machine (SVM), GMM based classifier provides not only the classification decision, but also a posterior probability of the classification results, which usually can be used as a confidence measure. Moreover, with adequate number of mixtures, GMM can approach arbitrary distributions well. In GMM based classification, we build two GMMs, v and
n 1
where xn, n=1,…,N are N feature vectors of training samples marked as valid translations. The Efficient Expectation-Maximization (EM) algorithm exists to estimate model parameters of v (Bishop, 2006).
0.3
i ,
for the valid translation class and the invalid
translation class, respectively. The GMM takes the following form:
K
p( x | ) ck N ( x | k , k )
(1)
Similarly, we can estimate λi for invalid translation class. In classification, according to the Bayes‟ rule, a testing translation pair with feature vector y is classified to the class C(y) as follows (Bishop 2006)
C ( y ) arg max p(C | y ) C {valid ,invalid }
arg max p( y | C ) p(C )
(2)
C {valid ,invalid }
which can achieve a minimum Bayes risk under 0-1 loss condition. in(2), p( y | C ) is computed according to (1), and p( c ) is the prior probability of class C, which is either valid or invalid. in our method. This prior probability is simply estimated from the classifier training data set by relative frequency, i.e., for p( v ),
count (valid translation pairs) count (total translation pairs) and p( p ) = 1 - p( v ). p(v )
k 1
where K is the number of Gaussian compounds in the GMM, ck is a positive mixture weight of the k-th Gaussian K component, and ck 1 . N ( x | k , k ) is a k 1
Gaussian distribution taking the following form:
N ( x | k , k ) where
k
1 (2 ) D / 2 | |1/ 2
e
1 ( x k )T 1 ( x k ) 2
and k are the mean vector and covariance
matrix of the k-th Gaussian component, D is the dimension of feature vector x. In our approach, the feature vector includes two features, MLE1, and MLE2, i.e., x=[MLE1, MLE2]T. Therefore, D = 2, 𝜇 k and k is a two dimension vector and a 2 by 2 matrix, respectively. To further reduce the number of free parameters, we use diagonal covariance matrix, i.e., only the diagonal elements of k have non-zero values.
4.3 Experimental Results In order to evaluate the classifier, we have conducted experiments on the English-Japanese language pair. The training and test data are summarized in table 4 .In the development set (Dev), we have a total of 262 translation pairs from the raw phrase table. Of these, 183 are marked as valid translation pairs by human annotators, and 79 are marked as invalid. In the test set (Test), 188 out of 281 phrase pairs are valid translation pairs, and 93 of them are not. There is no overlap between the Dev set and the Test set. Sample counts valid translation pairs Invalid translation pairs
Dev 183
Test 188
79
93
Table 4: Training and test data for translation validity classification
During evaluation, we measured the classification performance using Precision and Recall of valid translation pairs, and we also computed the F-measure of valid translation pairs as the classification accuracy. Specifically, the Precision rate, Recall rate, and F-measure are defined at below.
P
count (correct classified valid pairs) count (total classified valid pairs)
R
count (correct classified valid pairs) count (total true valid pairs)
F
2PR PR
In experiments, for the baseline, we accept all phrase pairs in the raw phrase table as valid translation pairs. We then apply the GMM classifier to determine each translation pair is valid or not. In training, the GMMs for valid translation and invalid translation are trained based on the Dev set. Then these models are applied to classify each translation pair in the Test set into either valid or invalid class based on (2). In implementation, six components per GMM are used. The results are tabulated in Table 5. English /Japanese baseline GMM
Precision
Recall
F-measure
0.6690 0.8780
1.0000 0.9574
0.8017 0.9160
Terms
Trans.
ML1E (s/t)
MLE2 (t/s)
Validity (w/ GMM)
value type value type value type value type value type
値の種類 値の型 値型 値 型の値
0.04 0.4 0.4 0.12 0.04
0.5 0.3846 0.2941 0.0004 0.25
True True True False False
Table 8: Translations of “value type” and maximum likelihood Then we analyzed the values with the Gaussian mixture model to find out that the first three translations are valid. The fourth translation is mapped only to the translation of “value,” which could be regarded as an alignment error. The last translation means “value of type,” which is a wrong translation. Then we go back to the bilingual corpus and find cases where “value type” is translated into any of the three variations. Actual occurrences of “value type” are shown in Table 9, sorted by product. Product names .NET Framework
Dynamics AX Exchange Server Outlook SQL Server Visual Studio
Table 5: translation validity classification results for the English / Japanese language pair. From these results, we can see that the performance of GMM-based translation validity classification is pretty good. Compared with the baseline that all raw phrase pairs are accepted, GMM classification can give a much higher precision rate of the valid translation pairs, with a slight drop of recall. Overall, it improves the validity classification accuracy by more than 10% when measured by the F-measure score.
5. Calculating the Consistency Index 5.1 Measurement of Consistency Using the translation validity model described in the previous section, we checked whether extracted compound nouns are translated consistently in and across products. Let us take up the case of “value type” and its Japanese translations to explain the consistency validation process. First of all, the created phrasal alignment data shows the following translation variations and maximum likelihood estimated (MLE) values.
Translations 値の型 値の種類 値型 値の型 値の型 値の種類 値の型 値の型 値型 値の型 値型
Frequencies 15 1 23 4 3 1 1 5 1 18 55
Table 9: Translation variations for “value type” sorted by product For example, in .NET Framework, all three translations ( 値 の 型 , 値 の 種 類 and 値 型 ) occur with certain frequencies. In the case of SQL Server, there are two translations, 値の型 and 値型. In general, the number of translation variations per se does not directly reflect the quality of the translations. For example, while SQL Server has the first type of translation (値の型) five times, there is only one other kind (値型). This needs to be penalized in terms of quality measurement due to its multiplicity in translations. However, the penalty should be minimal compared to Visual Studio. That product has 18 of the first translation (値の型) and 55 of the second translation (値 型). This is apparently confusing to readers since both have a considerable number of occurrences. Meanwhile, some terms are consistently translated across products. One example is “Web server”, which is shown in Table 10.
Product names .NET Framework Access BackOffice - Servers BizTalk Server Code Advisor for Visual Basic Commerce Server
Translations Web サーバー Web サーバー Web サーバー Web サーバー
Frequency 12 2 2 10
Web サーバー Web サーバー
1 23
Table 10: Translation of “Web server” “Web server” is translated consistently into one translation for each product. The quality of translation consistency for such a case is therefore quite high.
5.2 Evaluation of Consistency Translation consistency for an English term is calculated with two factors – the number of translation variations within a product and frequencies for each variation. For example, if one product has only one translation for a certain English term, this should be given the highest score. As in Table 9, there is only one translation for “value type” in Dynamics AX. Product names Dynamics AX
Translations 値の型
Frequency 4
n
s
HHI =
i 1
2 i
S is the market share of firm i in the market, and n is the number of firms. HHI becomes 10000 (= 100 2) when one single firm dominates the entire market. When 10 firms have 10% each, the index is 1000. In the case of translation consistency, S becomes the ratio of each translation (i) to the total number of translations (n) within a product. As a result, when one product has translation variations for one source term, the HHI score that represents “intra-product” consistency becomes lower. After we calculate the HHI scores for all products, we take an average to create an overall translation consistency index(C) for a source term as follows: p
Ct =
n
f
( k x100) n 1
2 i
p
In this equation, p is the number of products that have the source term (t), and each “frequency share” is calculated as the ratio of its frequency (f) to the total translation occurrence within a product (k). With this formula, the consistency of “value type” as shown in Table 14 is calculated as following:
Table 11: The case of the most consistent translation When there are multiple translations within a product, but still the ratio of minority translations is very limited, the scores should remain high. Product names SQL Server
Translations 値の型 値型
Frequency 5 1
Table 12: The case of relatively consistent translations We penalize cases in which there are multiple translations within a product and the majority of translations are not concentrated in one translation. In the case of .Net Framework, both the first and third translations have high frequencies, and there is another variation (the second one), although its frequency is very low. Product names .NET Framework
Translations 値の型 値の種類 値型
Frequency 15 1 23
Table 13: The case of less consistent translations
Products
Trans.
Freq.
(
f x100) 2 k
n
f
( k ) i 1
.NET Framework
値の型 値の種類 値型
15 1 23
1479.3 6.6 3478.0
4963.8
Dynamics AX Exchange Server
値の型
4
10000.0
10000.0
値の型 値の種類
3 1
5625.0 625.0
6250.0
Outlook SQL Server
値の型 値の型 値型 値の型 値型
1 5 1 18 55
10000.0 6944.4 277.8 608.0 5676.5
10000.0 7222.2
Visual Studio
2 i
6284.5
Table 14: Calculation of Consistency Index for “value type” p
C(“value type”)=
n
f
( k x100) i 1
p
2 i
= 7453.4
5.3 Consistency Index To measure the overall translation consistency for a source term, we first look at distribution of multiple translations within each product. Here we utilize the Herfindahl-Hirschman Index (HHI), a commonly accepted measurement of market concentration.
In the meantime, the translation consistency index for “Web server” is 10000 since intra-product consistency for all products is 10000. Therefore, the translation of “Web server” is completely consistent.
5.4 Application of the Consistency Index The translation consistency index can be effectively used for quality assurance of translation data. One of the most difficult tasks in translation quality assurance is to find defects in the translations, such as inconsistent and wrong terminology translations. Since bilingual text data usually has a number of source and target segments and sentences, identifying multiplicity in translations in a large text data set always requires systematic approaches. Therefore, the translation consistency index could be a good tool for quality assurance (QA) automation. To use it as such, we have normalized the index so that it ranges between 0 – 100. The consistency index for “value type” and “Web server” can therefore be shown as:
“value type” – Consistency Index: 74.5 “Web server” – Consistency Index: 100.0
The index can also be used as an indicator of “translation stability.” When the system shows a consistency index of “100” for “Web server,” this indicates to translators that they should not create any new translation variations unless it is truly necessary. The higher index could also mean that translators do not need to spend too much time in terminology research since they could simply follow existing translations identified in old data. On the other hand, when a translator sees the consistency index of 74.5, or a relatively low consistency, this could indicate that the translator should not easily pick up one of the multiple translation variations without fully examining the context.
6. Concluding Remarks This paper explored a way to extract phrase pair translations for compound nouns from a English-Japanese parallel corpus and to check translation. As mentioned at the outset of the paper, inconsistent terminology translations could lead to MT quality issues. In this connection, we would like to address some of our future plans. At Microsoft, we have been localizing technical documents for several years, using a statistical MT system called MSR-MT (Quirk, et al., 2005). To enhance the quality of terminology translation of MSR-MT, we hope to be able to plug the proposed method into our MT workflow. We envision that this will help us to create an MT-friendly eco-system across different product groups. Also, we are entertaining some application ideas of the proposed term mining process in post-editing contexts. One of the major issues that post-editors face in postediting contexts lies in the verification and correction of the terminology in MT output. To facilitate this process, we can create a bilingual terminology look-up tool for any language pairs, using phrase pair translations extracted from our training data. An advantage of this is that the data can be domain-specific and customizable. We can see great potential in increasing the productivity of postediting efforts in this respect.
References Bishop, C. M. (2006). Pattern Recognition and Machine Learning. Springer. Brown, P., Pietra, S. D., Pietra, V. J. D. and Mercer, R. L (1994). The Mathematics of Statistical Machine Translation: Parameter Estimation. Computational Linguistics, 19:263–311. Heidorn, G. (2000). Intelligent writing assistance. In R.Dale, H.Moisl and H.Somers (eds.), A Handbook of Natural Language Processing: Techniques and Applications for the Processing of Language as Text. New York: Marcel Dekker, pp. 181-207. Herfindahl, O. C. (1959), Copper Costs and Prices: 1870 – 1957. Baltimore: The John Hopkins Press Hirschman, A. O. (1964), The Paternity of an Index. 1964. American Economic Review Vol. 54, pp 761-762. Koehn, P., Och, F. J. and Marcu, D. (2003). Statistical Phrase-based Translation. In Proceedings of HLTNAACL 2003. Melamed, I. D., (1997). Measuring Semantic Entropy. ACL-SIGLEX Workshop Tagging Text with Lexical Semantics: Why, What, and How? April 4-5, 1997, Washington, D.C., 41-46. Och, F. J. and Ney, H. (2000a). A comparison of alignment models for statistical machine translation. In Proceedings of COLING ‟00, pages 1086–1090. Och, F. J. and Ney, H.. (2000b). Improved statistical alignment models. In Proceedings of ACL 2000. Och, F. J. and Ney, H. (2000c). Giza++: Training of statistical translation models. http://www-i6.informatik. rwthaachen.de/och/software/GIZA++.html. Och, F. J., Tillmann, C. and Ney, H. (1999). Improved alignment models for statistical machine translation. In Proc. of the joint conf. of EMNLP and Very Large Corpora. Quirk, C., Menezes, A. and Cherry, C. (2005). Dependency treelet translation: Syntactically informed phrasal SMT. In Proceedings of the 43rd ACL, pages 271–279, Ann Arbor, Michigan, June