International Journal of Engineering and Technology, Vol. 5, No. 2, 2008, pp. 99-110
99
AUTOMATION OF DNA COMPUTING READOUT METHOD BASED ON REALTIME POLYMERASE CHAIN REACTION IMPLEMENTED ON DNA ENGINE OPTICON 2 SYSTEM M.F Mohamed Saaid1, Z. Ibrahim1, M. Khalid1, S. Sudin 2, and N.H Sarmin 3 Center for Artificial Intelligence and Robotics (CAIRO), Department of Mechatronics and Robotics 2 Control & Instrumentation Engineering Department Faculty of Electrical Engineering, Universiti Teknologi Malaysia, 81310 Skudai, Johor Darul Takzim, Malaysia 3 Department of Mathematics, Fac. of Science, Universiti Teknologi Malaysia, 81310 Skudai, Johor, Malaysia Email:
[email protected] 1
ABSTRACT In this paper, an automation of DNA computing readout method based on real-time Polymerase Chan Reaction (PCR) is developed, which employs a hybrid in vitro-in silico approach. In the in vitro phase, TaqMan-based real-time PCR reactions are performed in parallel, to investigate the ordering of pairs of nodes in the Hamiltonian Path Problem (HPP), in terms of relative distance from the DNA sequence encoding the known start node. The real-time PCR experiment is implemented on DNA Engine Opticon II system. Alternative Fuzzy C-Means (AFCM) clustering algorithm is used to identify automatically two different reactions in real-time PCR, followed by in silico algorithm, which in turn, enables extraction of the Hamiltonian path. A software called “SILICOIN” is built to implement the AFCM clustering and the in silico algorithm, which return the desired Hamiltonian path. Keywords: DNA Computing, Fuzzy C-Means, real-time PCR, TaqMan probes.
INTRODUCTION Since the discovery of the polymerase chain reaction (PCR) [1], numerous applications have been explored, primarily in the life sciences and medicine, and importantly, in DNA computing as well. The subsequent innovation of real-time PCR has rapidly gained popularity and plays a crucial role in molecular medicine and clinical diagnostics [2]. All real-time amplification instruments require a fluorescence reporter molecule for detection and quantitation, whose signal increase is proportional to the amount of amplified product. A TaqMan DNA probe is a modified, nonextendable duallabeled oligonucleotides. The 5’ and 3’ ends of the oligonucleotide are terminated with an attached reporter, such as FAM, and quencher fluorophores dyes, such as TAMRA, respectively, as shown in Figure 1 [3]. Upon laser excitation at 488 nm, the FAM fluorophore, in isolation emits fluorescence at 518 nm. Given proximity of the TAMRA quencher, however, based on the principle of fluorescence resonance energy transfer (FRET), the excitation energy is not emitted by the FAM fluorophore, but rather is transferred to TAMRA via the dipole-dipole interaction between FAM and TAMRA. As TAMRA emits this absorbed energy at significantly wavelengths (580 nm), the resulting fluorescence is not observable in Channel 1 of real-time PCR instruments [4]. The combination of dual-labeled TaqMan DNA probes with forward and reverse primers is a must for a successful real-time PCR. As PCR is a repeated cycle of three steps (denaturation, annealing, and polymerization), a TaqMan DNA probe will anneal to a site within the DNA template in between the forward and reverse primers during the annealing step, if a subsequence of the DNA template is complementary to the sequence of the DNA probe. During polymerization, Thermus aquaticus (Taq) DNA polymerase will extend the primers in a 5’ to 3’ direction. At the same time, the Taq polymerase also acts as a “scissor” to degrade the probe via cleavage, thus separating the reporter from the quencher, as shown in Figure 2 [5], where R and Q denote the reporter dye and quencher dye, respectively. This separation subsequently allows the reporter to emit its fluorescence [6]. This process occurs in every PCR cycle and does not interfere with the exponential accumulation of PCR product. As a result of PCR, the amount of DNA template increases exponentially, which is accompanied by a proportionate increase in the overall fluorescence intensity emitted by the reporter group of the excised TaqMan probes. Hence, the intensity of the measured fluorescence at the end of each PCR
ISSN 1823-1039 ©2008 FEIIC
International Journal of Engineering and Technology, Vol. 5, No. 2, 2008, pp. 99-110
100
polymerization is correlated to the total amount of PCR product, which can then be detected, using a real-time PCR instrument for visualization.
Figure 1: Illustration of the structure of a TaqMan DNA probe. Here, R and Q denote the reporter and quencher fluorophores, respectively
Figure 2: Degradation of a TaqMan probe, via cleavage by DNA polymerase
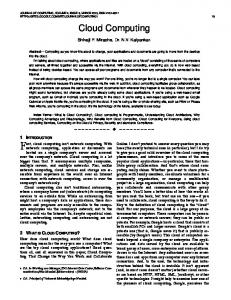
Previously, we proposed a readout method tailored specifically to the HPP in DNA computing, which employs a hybrid in vitro-in silico approach [7]. In the in vitro phase, O(|V|2) TaqMan-based real-time PCR reactions are performed in parallel, to investigate the ordering of pairs of nodes in the Hamiltonian path of a |V|-node instance graph, in terms of relative distance from the DNA sequence encoding the known start node. The resulting relative orderings are then processed in silico, which efficiently returns the complete Hamiltonian path. The proposed approach is experimentally validated optical method specifically designed for the quick readout of HPP instances, in DNA computing. Previously, graduated PCR, which was originally demonstrated by Adleman [8], was employed to perform such operations. While a DNA chip based methodology, which makes use of biochip hybridization for the same purpose has been proposed [9-11], this method is more costly, and has yet to be experimentally implemented. In this paper, an automation system for DNA computing readout method implemented on real-time PCR is developed, which consist of in vitro-in silico approach. The real-time amplification is performed with the TaqMan probes and the TaqMan detection mechanism was exploited for the design and development of the readout approach. The in vitro part is performed on the DNA Engine Opticon 2 System. As shown in Figure 3, the output of DNA computing readout method implemented on DNA Engine Opticon 2 System consist of two kinds of reactions, namely “YES” reaction and “NO” reaction. In the in silico information processing, Alternative Fuzzy C-Means (AFCM) [12] clustering algorithm is implemented for automatic classification of “YES” and “NO” reaction. A software called SilicoIn is developed and able to implement the in silico information processing during the in silico phase of readout approach in order to cluster the ‘‘YES’’ and ‘‘NO’’ reaction, followed by in silico algorithm which directly show the Hamiltonian path. NOTATIONS AND BASIC PRINCIPLE First of all, v1(a)v2(b)v3(c)v4(d) denotes a double-stranded DNA (dsDNA) which contains the base-pair subsequences, v1, v2, v3, and v4, respectively. Here, the subscripts in parenthesis (a, b, c, and d) indicate the length of each respective base-pair subsequence. For instance, v1(a) indicates that the length of the doublestranded subsequence, v1 is 20 base-pairs (bp). When convenient, a dsDNA may also be represented without indicating the segment lengths (e.g., v1v2v3v4). A reaction denoted by TaqMan(v0,vk,vl) indicates that real-time PCR is performed using forward primer v0, reverse primer vl , and TaqMan probe vk . Based on the proposed approach, there are two possible reaction conditions regarding the relative locations of the TaqMan probe and reverse primer. In particular, the first condition occurs when the TaqMan probe specifically hybridizes to the template, between the forward and reverse primers, while the second occurs when the reverse primer hybridizes between the forward primer and the TaqMan probe. As shown in Figure 3, these two conditions would result in different amplification patterns during real-time PCR, given the same DNA template (i.e., assuming that they occurred separately, in two
ISSN 1823-1039 ©2008 FEIIC
101
International Journal of Engineering and Technology, Vol. 5, No. 2, 2008, pp. 99-110
different PCR reactions). The higher fluorescent output of the first condition is a typical amplification plot for real-time PCR. In contrast, the low fluorescent output of the second condition reflects the cleavage of a few of the TaqMan probes via DNA polymerase due to the ‘unfavourable’ hybridization position of the reverse primer. Thus, TaqMan(v0,vk,vl) = YES if an amplification plot similar to the first condition is observed, while TaqMan(v0,vk,vl) = NO if an amplification plot similar to the second condition is observed. REAL-TIME PCR-BASED READOUT APPROACH Let the output of an in vitro computation of an HPP instance of the input graph be represented by a 140-bp dsDNA v0(20)v1(20)v4(20)v2(20)v5(20)v3(20)v6(20), where the Hamiltonian path V0→V1→V4→V2→V5→V3→V6, begins at node V0, ends at node V6, and contains intermediate nodes V1, V4, V2, V5, and V3, respectively. Note that in practice, only the identities of the starting and ending nodes, and the presence of all intermediate nodes will be known in advance to characterize a solving path. The specific order of the intermediate nodes within such a path is unknown. The first part of the approach, which is performed in vitro, consists of [(|V|-2)2-(|V|-2)]/2 real-time PCR reactions, each denoted by TaqMan(v0,vk,vl) for all k and l, such that 0 < k < |V|-2, 1 < l < |V|-1 , and k < l. For this example instance, so that the DNA template is the dsDNA, v0v1v4v2v5v3v6 these 10 reactions are as follows: (1) (2) (3) (4) (5) (6) (7) (8) (9) (10)
TaqMan(v0,v1,v2) = YES TaqMan(v0,v1,v3) = YES TaqMan(v0,v1,v4) = YES TaqMan(v0,v1,v5) = YES TaqMan(v0,v2,v3) = YES TaqMan(v0,v2,v4) = NO TaqMan(v0,v2,v5) = YES TaqMan(v0,v3,v4) = NO TaqMan(v0,v3,v5) = NO TaqMan(v0,v4,v5) = YES
5 4.5 4 Fluorescence
3.5 3 2.5 2 1.5 1 0.5 0 1
3
5
7
9
11 13 15 17 19 21 23 25 27 29 31 33 35 37 39 41 43 45 Cycle Numbers YES reaction
NO reaction
Figure 3: An example of reaction plots corresponding to TaqMan(v0,vk,vl) = YES(first condition) and TaqMan(v0,vk,vl) = NO (second condition)
Note that the overall process consists of a set of parallel real-time PCR reactions, and thus requires O(1) laboratory steps for in vitro amplification. The accompanying SPACE complexity, in terms of the required number of tubes is O(|V|2). Clearly, only one forward primer is required for all real-time PCR reactions, while the number of reverse primers and TaqMan probes required with respect to the size of input graph are each |V|-3. After all real-time PCR reactions are completed, the in vitro output is subjected to an algorithm for in silico information processing, producing the satisfying Hamiltonian path of the HPP instance in O(n2) TIME (here, n denotes vertex number).
ISSN 1823-1039 ©2008 FEIIC
102
International Journal of Engineering and Technology, Vol. 5, No. 2, 2008, pp. 99-110
The next step is to use all the information from the six TaqMan reactions to allocate each node of the Hamiltonian path. This can be done by applying the in silico algorithm, below. Input: N[0…|V|-1]=2 // N[0, ?, ?, ?, ?, ?, 6] A[1…|V|-2]=|V| // A[1, 1, 1, 1,1] for k=1 to |V|-3 for l=k+1 to |V|-2 if TaqMan(v0,vk,vl) = YES A[l] = A[l]+1 else A[k] = A[k]+1 endif endfor N[ A[k] ] = k endfor N[ A[ |V|-2] ]=|V|-2 In this algorithm, an array (N[0…|V|-1) that store all the nodes of the Hamiltonian path is defined. In addition, an array of aggregation values (A[1..|V|-2]) that is used to locate the Hamiltonian path in each array of nodes is also defined. Based on the modified algorithm, the input array N is first initialized to N={0,?,?,?,?,?,6} since the start and the end of the path are known, in advance. Next, the aggregation array A is initialized to A={1,1,1,1,1}. During the loop operations of the algorithm, the value of in the array A is increased in each iteration steps. The aggregation array A[i] is used for indexing the nodes array for each value of k. After the loop operation |V|-2 is assigned to the N[A[|V|-2]. The output of the in silico algorithm can be viewed by calling back all the nodes array N[0] to N[|V|-1]. The outcome of the this in silico algorithms is N={0,1,4,2,5,3,6}. Note that this algorithm can be done if all the information of TaqMan reactions is already achieved. This only can be done if clustering is applied to investigate “YES” and “NO” reaction.
EXPERIMENTS Preparation of input molecules A pool of 140-bp input molecules v0(20)v1(20)v4(20)v2(20)v5(20)v3(20)v6(20) is prepared, via standard protocol of parallel overlap assembly (POA) of singlestranded DNA strands (ssDNAs). For this purpose, 13 ssDNAs are required, including additional ssDNAs, which act as link sequences for self-assembly. These strands are listed in Table 1. After completion, amplification via PCR was performed using the same protocol as POA. The forward primers and reverse primers used for the PCR reaction were 5’-CGTCAAGGCCGTCTCTATAT-3’ and 5’GTAGATTAAGAAGGTGCGCG-3’, respectively. The PCR product was subjected to gel electrophoresis and the resultant gel image was captured, as shown in Figure 4. The 140-bp band in lane 2 shows that the input molecules have been successfully generated. Afterwards, the DNA of interest is extracted. The final solution for real-time PCR was prepared via dilution of the extracted solution, by adding ddH2O (Maxim Biotech, Japan) into 100 µl. Table 1: The required single-stranded dnas for the generation of input molecules Name
DNA Sequences (5’-3’)
v0 v1 v4 v2 v5 v3 v6 v0v1 v1v4 v4v2 v2v5 v5v3 v3v6
CGTCAAGGCCGTCTCTATAT CCACTGGTTCTGCATGTAAC TCCACGCTGCACTGTAATAC TGGACAACCGCAGTTACTAC ATGCGCCAGCTTCTAACTAC AGGAAACCTCACGACAGTCT CGCGCACCTTCTTAATCTAC GAACCAGTGGATATAGAGACGGCCTTGACG GCAGCGTGGAGTTACATGCA CGGTTGTCCAGTATTACAGT GCTGGCGCATGTAGTAACTG GAGGTTTCCTGTAGTTAGAA GTAGATTAAGAAGGTGCGCGAGACTGTCGT
ISSN 1823-1039 ©2008 FEIIC
Length 20 20 20 20 20 20 20 30 20 20 20 20 30
103
International Journal of Engineering and Technology, Vol. 5, No. 2, 2008, pp. 99-110
Figure 4: Gel image for the preparation of input molecules. Lane M denotes a 20-bp molecular marker, lane 1 is the product of initial pool generation based on parallel overlap assembly, and lane 2 is the amplified PCR product
Real-time PCR Experiments The real-time PCR reaction involves primers (Sigma Genosys, Japan), TaqMan probes (Sigma Genosys, Japan), and QuantiTect Probe PCR Kit (QIAGEN, Japan). The sequences for forward primers, reverse primers, and TaqMan probes are listed in Tables 2 and Table 3. QuantiTect Probe PCR Kit essentially contains 3 vials of 2x Master Mix and 2 vials of RNase-free Water. The master mix contains HotStarTaq® DNA Polymerase, QuantiTect Probe PCR Buffer, dNTP mix including dUTP, ROX™ (passive reference dye), and 8 mM MgCl2. For real-time PCR, as recommended by the manufacturer, the final concentration of primers should be 0.4 µM, whereas the final concentration of the DNA probes should be between 0.1-0.2 µM. In this study, the maximum final concentration of probe, which is 0.2 µM, was chosen and prepared. The real-time PCR was performed on a DNA Engine Opticon® 2 System (MJ Research, USA) where amplification is carried out in a 50 µl tube. Each tube contains 25 µl 2x PCR Master Mix, 0.4 µl forward primer, 0.4 µl reverse primer, 0.4 µl probe, 2 µl template, and 21.8 µl RNase-free Ultrapure Water. Ten separate real-time PCR reactions were performed in parallel, in order to implement the first stage of the proposed HPP readout. After the initial activation step at 95ºC for 15 minutes, the amplification consists of 45 cycles of denaturation and annealing/extension, performed at 94ºC for 15 s and 60ºC for 60 s, respectively. The resulting real-time PCR amplification plots are illustrated in Figure 5. Table 2: Sequences for forward primer and reverse primers employed for the real-time PCR Primer
DNA Sequences (5’-3’)
GC%
Tm (ºC)
Forward primer, v0 Reverse primer, v 4
CGTCAAGGCCGTCTCTATAT GTATTACAGTGCAGCGTGGA GTAGTAACTGCGGTTGTCCA
0.5 0.5 0.5
59.1 59.7 58.6
GTAGTTAGAAGCTGGCGCAT
0.5
59.5
AGACTGTCGTGAGGTTTCCT
0.5
58.7
Reverse primer, v 2 Reverse primer, v5 Reverse primer, v3
Table 3: Sequences for TaqMan dual-labeled probes TaqMan Probes Probe v1 Probe v2 Probe v3 Probe v4
Sequences R – CCACTGGTTCTGCATGTAAC – Q R – TGGACAACCGCAGTTACTAC – Q R – AGGAAACCTCACGACAGTCT – Q R – TCCACGCTGCACTGTAATAC – Q
ISSN 1823-1039 ©2008 FEIIC
International Journal of Engineering and Technology, Vol. 5, No. 2, 2008, pp. 99-110
104
Figure 5: Output of real-time PCR. Reactions 1 to 10 indicate the [(|V|-2)2-(|V|-2)]/2 TaqMan(v0,vk,vl) reactions of the input instance, as defined in Section 3. Note that reactions 6, 8, and 9, which correspond to “NO”, show virtually no amplification
IN SILICO INFORMATION PROCESSING Exporting data The data from DNA Engine Opticon 2 System can be exported by clicking the export data on the software. From the data, only the FAM reading was selected to be exported into the SilicoIn software, since the FAM emission reading is the actual result of TaqMan reaction shown in Figure 5. The exporting process was done after the in vitro phase is already completed. This exported data were written in the text file format, which show the fluorescence intensity from the first to the 46th thermal cycle for all 10 different TaqMan reactions. Clustering algorithm From the output graph of real-time PCR, an unsupervised learning such as clustering algorithm can be implemented for automatic classification of a data [13]. Clustering algorithm, K-means for example is easy to implement, since the number of groups for classification of TaqMan reactions are already known. However, hard partitioning or non-fuzzy clustering algorithm requires an exhaustive search in a huge space because some variables can only take two values 0 and 1. Meanwhile fuzzy clustering is more computational tractability than hard partitioning algorithm [14]. Hence, all the variables are continuous, so that derivatives can be computed to find the right direction for the search [15]. Fuzzy C-means (FCM) has become the well known and powerful method in cluster analysis, and has been applied in many fields. However FCM clustering algorithm cannot handles noise and outliers data. Thus, AFCM clustering algorithm has been developed by Wu and Yang, to enhance the robustness of FCM to noise and outliers as well as tolerate with unequal sized clusters [12]. FCM is a data clustering technique, which is based on the optimization of the objective function [16]: C
J (U , Y ) =
N
∑ ∑ (µ
ij
) m x j − yi
2
(1)
i =1 j =1
where C is a number of clusters and N is a number of data. Every data point in the data set requires to belong to a cluster at a particular membership degree. The purpose of FCM is to group data points into different specific clusters. Let X={x1, x2,…, xN} be a collection of data. By minimizing (1), X is classified into C homogeneous clusters, where µij is the membership degree of data xj to a fuzzy cluster set yi, Y={y1, y2,…, yC} are the cluster
ISSN 1823-1039 ©2008 FEIIC
International Journal of Engineering and Technology, Vol. 5, No. 2, 2008, pp. 99-110
105
centers. U=(µij)N*C is a fuzzy partition matrix, and µij indicates the membership degree of each data point in the data set to the cluster i. The value of U should satisfy the following conditions:
µ ij ∈ [0,1], ∀ i = 1,...C , ∀ j = 1 ... N
(2)
C
∑µ
= 1, ∀ j = 1,... N
ij
(3)
i =1
The ||xj - yi|| is the Euclidean distance between xj and yi. The parameter m is called fuzziness value index, which control the fuzziness value of membership of each datum. The cluster center can be calculated by using the following equation N
∑ (µ yi =
j =1 N
∑
ij
)m x j , ∀ i = 1,..., C
( µ ij )
m
(4)
j =1
Then, clustering can be achieved by iteratively minimize the aggregate distance between each data point in the data set and cluster centers until no further minimization is possible. Then, the fuzzy partition matrix U is updated by using following equation 1
µ ij = C
⎛ x
j
x
j
∑ ⎜⎜⎜ k =1
⎝
(5)
− y i ⎞⎟ − y k ⎟⎟ ⎠
2 m −1
Wu and Yang have shown that Euclidean norm is not robust in a noisy environment [12]. Thus, they proposed the exponential distance metric to replace the Euclidean distance in the objective function. The exponential distance is given by
(
1/ 2
)
2 ⎞ ⎛ d x j , yi = ⎜1 − exp⎛⎜ − β x j − yi ⎞⎟ ⎟ ⎝ ⎠⎠ ⎝
(6)
where β is a positive constant, defined by ⎛ ⎜ ⎜ β =⎜ ⎜ ⎜⎜ ⎝
N
∑ j =1
2⎞ xj − x ⎟ ⎟ ⎟ N ⎟ ⎟⎟ ⎠
−1
(7)
and x is defined as ⎞ ⎛ N ⎜ xj ⎟ ⎜ j =1 ⎟ ⎟ x =⎜ ⎜ N ⎟ ⎟⎟ ⎜⎜ ⎠ ⎝
∑
(8)
ISSN 1823-1039 ©2008 FEIIC
106
International Journal of Engineering and Technology, Vol. 5, No. 2, 2008, pp. 99-110
By replacing Euclidean distance with the exponential distance, the new objective function is formulated as C
J (U , Y ) =
N
∑∑ ( µ
ij )
i =1 j =1
m⎛
⎛ ⎜1 − exp ⎜ − β x j − yi ⎝ ⎝
2 ⎞⎞
⎟⎟ ⎠⎠
(9)
which defines the formulation of AFCM clustering algorithm. The necessary condition for minimizing equation (9) is given in equation (10) and (11) 1
µ ij = C
∑
k =1
⎛ (1 − exp( − β x − y ⎜ j i ⎜ ⎜ (1 − exp( − β x j − y k ⎝
N
∑ (µ yi =
(10)
ij
) m exp( − β x
)) ⎞⎟ ⎟ 2 )) ⎟ ⎠
2
− yi
2
)x
j
(11)
j =1 N
∑ (µ
j
1 m −1
ij
)
m
exp( − β x
j
− yi
2
)
j =1
A fixed-point iteration method can be implemented for calculating the yi. In order to cluster the results of TaqMan reaction, namely “YES” and “NO” reaction, each graph of the reactions are represented as vector xj={xj(1),xj(2),xj(3),…,xj(45),xj(46)}. The reactions are clustered into two groups, having their centre at y1={y1(1),y1(2),…,y1(45),y1(46)} and y2={y2(1),y2(2),…,y2(45),y2(46)}. The two centres can be viewed as graphs that similar to the TaqMan reaction “YES” and “NO”. It is noticed that the centre that is located in the amplification region always have greater value than the other center in the non-amplification region. The two centers are called as “YES” and “NO” center, where “YES” center is greater than “NO” center. This information is used to classify the TaqMan reactions “YES” and “NO” by comparing the fuzzy partition matrix U. If y2 represents the “YES” center and y1 represent the “NO” center (note that y2 is not always represent the “YES” center when the FCM algorithm is implemented), then y2 > y1. For example, if µ11 and µ 12 equals to 0.6 and 0.4, respectively, the “YES” and “NO” reaction can be determined by following this rule if (y1> y2 and µ i1> µ i2) or (y2> y1 and µ i2> µ i1) ) xj =”YES” else xj =”NO” Based on the proposed rule, xj is classified as “NO” reaction since µ i1> µ i2 and y1< y2. This rule is applied to the remaining “YES” and “NO” reactions. The whole classification process for FCM and AFCM can be described in the following steps FCM Step 1: Initialize the membership matrix U with random values, subject to (2) and (3) Step 2: Calculate the cluster center Y by using (4) Step 3: Update fuzzy partition matrix U by using (5) Step 4: Stop if ||U(t+1)-U(t)||< e, otherwise go to step 2 Step 5: Determine “YES” and “NO” centers (either y1> y2 or y2> y1) Step 6: Classify each TaqMan reactions by using the predefined rule 2 AFCM Step 1: Initialize the membership matrix U with random values, subjected to conditions (2) and (3) Step 2: Calculate the cluster center Y by solving the equation (11), and calculate for each dimension of Y. Step 3: Update fuzzy partition matrix U based on (10) Step 4: Stop if ||U(t+1)-U(t)||< e, otherwise go to step 2 Step 5: Determine “YES” and “NO” centers (either y1> y2 or y2> y1) Step 6: Classify each TaqMan reactions by using the predefined rule
ISSN 1823-1039 ©2008 FEIIC
International Journal of Engineering and Technology, Vol. 5, No. 2, 2008, pp. 99-110
107
RESULTS AND DISCUSSION As discussed previously, in the in vitro phase of the readout approach, each real-time PCR reaction is mapped to a binary output (i.e., either “YES” or “NO”), based on the occurrence or absence of an exponential amplification. Given the existence of this mapping, the subsequent in silico information processing is capable of determining the Hamiltonian path of the input instance (e.g., V0→V1→V4→V2→V5→V3→V6, for the example instance). The amplification responses observed in this study differ from the amplification responses which are typically obtained in the life sciences and medicine. In particular, while in life science and medical applications, the initial copy number of the DNA template is normally very low, in the current study the input molecule is actually a DNA species extracted from a polyacrylamide gel, which exists at a high concentration. That is the main reason why the amplification signals in the current study appeared more rapidly than normal. FCM and AFCM are implemented to classify the TaqMan reaction produced by the DNA Engine Opticon 2. The clustering parameters used are e=0.00001, m=2, N=10, and C=2. The algorithms are validated first on Matlab 7.0. The results are shown in Figure 6, and Figure 7. The fuzzy partition membership values for those two different algorithms are listed in Table 4. Based on Table 1, two misclassifications occurred when the conventional FCM is applied. On the other hand, the AFCM has correctly classified all the TaqMan reactions. Based on the amplification output of TaqMan reactions, reactions 1 and 10 are clearly out of range from the “YES” group, reactions 6, 8 and 9 are closely grouped together to form “NO” group, and reactions 2,3,4,5 and 7 can be viewed as “YES” group. The misclassification, occurred for the FCM, is affected by reactions 1 and 10, as the FCM clustering algorithm is based on the “means” or “average”. From this observation, reactions 1 and 10 can be classified as outliers or noises. The misclassification problem can be corrected by using different distance measure such as exponential Euclidean distance, which is employed by AFCM. Table 1 shows that the AFCM has correctly classified all the TaqMan reaction, which proves that the exponential distance is more robust than Euclidean distance, in terms of handling of outliers and noises. The “SILICOIN” software were built based on Visual C++ 6.0 running on Microsoft window xp. Tthis software is able to analyzed only 7 nodes of HPP problem. As shown in Figure 8, the exported data can be plot back in this software to visualize the difference between the “YES” and “NO” reaction. This software is able to cluster the TaqMan reactions, by implementing the AFCM algorithm based on the results shown by using Matlab 7.0. The in silico algorithm to obtain the Hamiltonian Path is also implemented in this software.
Figure 6: Output of real-time PCR. with “YES” and “NO” centers calculated using FCM clustering algorithm
ISSN 1823-1039 ©2008 FEIIC
108
International Journal of Engineering and Technology, Vol. 5, No. 2, 2008, pp. 99-110
Figure 7: Output of real-time PCR. with “YES” and “NO” centers calculated using AFCM clustering algorithm
Table 4: Fuzzy partition value for each TaqMan reactions TaqMan 1 2 3 4 5 6 7 8 9 10
manual YES YES YES YES YES NO YES NO NO YES
FCM µi1 0.89454 0.60642 0.97209 0.90606 0.17222 0.018769 0.45078 0.021623 0.017352 0.96744
µi2 0.10546 0.39358 0.027907 0.093941 0.82778 0.98123 0.54922 0.97838 0.98265 0.032556
Reaction (y1> y2) YES YES YES YES NO NO NO NO NO YES
AFCM µi1 0.52675 0.93949 0.90602 0.97078 0.58404 0.000716 0.8486 0.00265 0.000141 0.61813
µi2 0.47325 0.060506 0.093975 0.029225 0.41596 0.99928 0.1514 0.99735 0.99986 0.38187
Reaction (y1> y2) YES YES YES YES YES NO YES NO NO YES
Figure 8: The clustering process and the Hamiltonian Path computed in “SILICOIN”
ISSN 1823-1039 ©2008 FEIIC
International Journal of Engineering and Technology, Vol. 5, No. 2, 2008, pp. 99-110
109
CONCLUSIONS This research offers an automation of real-time PCR-based readout approach for DNA computing, which is implemented on DNA Engine Opticon 2 System. According to the experimental results, the amplification response for “YES” and “NO” reactions can be clearly distinguished. The in silico information of the real-time PCR readout method is computerized in the “SILICOIN” to cluster the TaqMan reaction the Hamiltonian Path automatically. By applying the AFCM clustering algorithm on the output results of real-time PCR, two different TaqMan reactions, “YES” and “NO”, can be clearly distinguished. Other algorithms that can handle noises and outliers can also be implemented to automatically classify the output of real-time PCR. Implementation of AFCM can also be discussed further so that the implementation can be fully maximized.
ACKNOWLEDGEMENT This research is supported financially by the Ministry of Higher Education (MOHE) under Fundamental Research Grant Scheme (FRGS) (Vot 78225) and partly supported by the Ministry of Science, Technology, and Innovation (MOSTI) under eScienceFund (Vot 79027). Muhammad Faiz Mohamed Saaid is indebted to Universiti Teknologi Malaysia for granting him a financial support and opportunity to do this research.
REFERENCES [1] Mullis, K. (1986) Specific enzymatic amplification of DNA in vitro: the polymerase chain reaction, Cold Spring Harbor Symposium on Quantitative Biology. [2] Overbergh, L. (2003) The use of real-time reverse transcriptase PCR for the quantification of cytokine gene expression, Journal of Biomolecular Techniques. [3] Walker, N.J. (2002) A technique whose time has come, Science. [4] Lakowicz, J.R. (1999) Principles of fluorescence spectroscopy, 2nd Ed., Kluwer Academic/Plenum Publishers, New York. [5] Heid, C.A. (1996) Real-time quantitative PCR. Genome Research. [6] Holland, P.M. (1991) Detection of specific polymerase chain reaction product by utilizing the 5’_3’ exonuclease activity of termus aquaticus DNA polymerase, Proceedings of the National Academy of Sciences of the United States of America. [7] Ibrahim, Z., Rose, J. A., Suyama, A. and Khalid, M. (2008) Experimental Implementation and Analysis of a DNA Computing Readout Method Based on Real-Time PCR with TaqMan Probes, Natural Computing Journal, Springer. [8] Adleman, L. (1994) Molecular Computation of Solutions to Combinatorial Problems, Science. [9] Rose, J.A. (1997) The Effect of Uniform Melting Temperatures on the Efficiency of DNA Computing, DIMACS Workshop on DNA Based Computers III. [10] Wood, D.H. (1998) A DNA computing algorithm for directed Hamiltonian paths, Proceedings of the Third Annual Conference on Genetic Programming. [11] Wood, D.H., Clelland, C.L.T. and Bancroft, C. (1999) Universal biochip readout of directed Hamiltonian path problems, Lecture Notes in Computer Science,(pp.168-181). Springer [12] Wu, K.L. and Yang M.S. (2000) Alternative C-Means Clustering Algorithm, Pattern Recognition. [13] Everitt, B., Landau, S. and Leese, M. (2001) Cluster Analysis. London: Arnold. [14] Bezdek,J.C. (1974) Cluster Validity with Fuzyy Sets, J. Cybernatics.
ISSN 1823-1039 ©2008 FEIIC
International Journal of Engineering and Technology, Vol. 5, No. 2, 2008, pp. 99-110
110
[15] Wang, L.X. (1997) A Course of Fuzzy Systems and Control. Prentice Hall. [16] Bezdek, J. (1981) Pattern Recognition with Fuzzy Objective Function Algorithms, Plenum Press, New York.
NOMENCLATURE vi Vi U Y X xj µij yi GC% Tm
double-stranded DNA Hamiltonian path nodes fuzzy partition matrix set of cluster centre set of data data membership value cluster centre GC percentage melting temperature
ISSN 1823-1039 ©2008 FEIIC