... reconstruction or extension of embankments, walls, dykes, dams, reservoirs, ...... Pikitch, E. K., C. Santora, E. A. Babcock, A. Bakun, R. Bonfil, D. O. Conover, P.
AGRICULTURAL DRAINS AS FISH HABITAT IN SOUTHWESTERN ONTARIO
A Thesis Presented to The Faculty of Graduate Studies of The University of Guelph
by KATIE LOUISE STAMMLER
In partial fulfillment of requirements for the degree of Master of Science December, 2005
© Katie Stammler, 2005
ABSTRACT AGRICULTURAL DRAINS AS FISH HABITAT IN SOUTHWESTERN ONTARIO Katie Stammler University of Guelph, 2005
Advisors: Dr. Robert L. McLaughlin Dr. Nicholas E. Mandrak
Research is needed to help ensure ecosystems heavily affected by human activities continue to provide natural-like ecosystem services. This study tested whether warmwater agricultural drains in southwestern Ontario provide fish habitat similar to that of reference watercourses not subjected to drain maintenance. Fish assemblage and habitat features were characterized using standardized sampling protocols in 24 pairs of agricultural drains and reference watercourses matched by size, stream order and location within the same watershed. Drains and reference watercourses did not differ significantly in species richness, total fish abundance and composition, occurrence of reproductive life stages within species, or habitat attributes expected to be altered by drain maintenance. These findings suggest drains in southwestern Ontario provide fish habitat of similar quality to that of reference watercourses. The findings will be used by fisheries and drain managers to develop drain management guidelines considering the needs of agriculture, while preserving fish biodiversity and habitat.
ACKNOWLEDGEMENTS I would like to thank my advisors Dr. Robert McLaughlin and Dr. Nicholas Mandrak for their incredible guidance and encouragement in the completion of this thesis and for helping me to learn and grow as a scientist. I would also like to thank Dr. Beren Robinson for his comments as a member of my advisory committee. I would like to thank my field assistants Matt Parslow and Matt Regan for their tireless efforts to collect the data for this project, for their willingness to brainstorm and for keeping me smiling. I would also like to thank Dr. Karl Cottenie for his help with redundancy analysis. Many thanks go to my colleagues who offered editorial comments at various stages during the writing process, Sarah Matchett, Andy Bramburger and Kathryn Peiman (while she was living the dream in Puerto Rico) and my mom who has read every draft of this thesis. For making my time at Guelph fun and memorable, I would like to thank my friends and lab mates Andrea Bernard, Sarah Matchett, Colette Ward, Belinda WardCampbell, Melissa Robillard, Michelle Farwell, Deb De Pasquale, Matt Moles and Dak DeKerckhove. To Alex Wilson and Bill Harford, I couldn’t have picked better lab mates if I tried! I would like to say a special thank you to my friends Kristen Hazlett, Johanna Lariviere and Holly Fledderjohann for standing by me and keeping me sane. To my family and friends at home, thank you for your constant love and support. To Lori and Richard for their long distance support and Bjorn and Brooklin whose little voices always make me smile. To Joe and Gianna, possibly the best brother and sister-inlaw anyone could hope for, thank you both for always being there and for sharing Jack’s contagious laughter. And most importantly, to my parents, words cannot possibly thank you enough for all you have done for me, I have gotten where I am because of you.
i
TABLE OF CONTENTS ACKNOWLEDGEMENTS………………………………………………………………..i TABLE OF CONTENTS…………………………………………………………………ii LIST OF TABLES……………………………………………………………………….iii LIST OF FIGURES………………………………………………………………………iv LIST OF APPENDICES…………………………………………………………………..v INTRODUCTION……………………………………………………………………...…1 METHODS………………………………………………………………………………13 Site selection……………………………………………………………………..13 Fish sampling…………………………………………………………………….16 Habitat sampling…………………………………………………………………18 Statistical analysis………………………………………………………………..19 RESULTS………………………………………………………………………………..21 DISCUSSION……………………………………………………………………………29 REFERENCES…………………………………………………………………………..35 APPENDIX .………………………………………………………………………….….45
ii
LIST OF TABLES Table 1. Summary of the DFO Drain Class Authorizations used to classify drains in southwestern Ontario based on water temperature, permanency of flow, fish species present, and the time since the last performed maintenance. Drain maintenance is restricted to certain activities for each class..…………....9
Table 2. Occurrences of each fish species in drains and reference watercourses………..22
Table 3. Summary of proportion of sites with occurrences of different life stages in drains and reference watercourses for each species. Life stages considered were spawning, mature size classes, and young-of-the-year size (YOY size)….25
Table 4. Summary of sampling effort measures and parameters used for matching pairs of drains and reference watercourses…………………………………………..27
Table 5. Summary of measured physical habitat variables expected to be affected by drain maintenance practices……………………………………………………28
iii
LIST OF FIGURES Figure 1. Study area showing the location of each sampling site……......................15
iv
LIST OF APPENDICES Appendix. Sizes for maturity according to Coker et al. (2001) and young of the year (YOY) according to Scott and Crossman (1973), unless otherwise noted, for species in this study…………………………………………………….45
v
AGRICULTURAL DRAINS AS FISH HABITAT IN SOUTHWESTERN ONTARIO
INTRODUCTION Our environment has been, and continues to be, greatly impacted by increasing human populations and activities. This is creating great need to preserve the last vestiges of natural ecosystems and to restore natural-like ecosystem services to systems that have been heavily altered (Rosenzweig 2003). We must further focus research efforts on ecosystems providing essential services for human societies, such as food and fresh water, if they are expected to provide these services in the future (Palmer et al. 2004, Foley et al. 2005). This new research should centre on understanding natural processes and designing ecological solutions to optimize ecosystem services for both human and natural use (Palmer et al. 2004). Because human populations will continue to grow and stress natural environments, it is important to acknowledge humans as integral components of most ecosystems (Palmer et al. 2004), and to discover ways to create or maintain habitats to conserve biodiversity in spaces used for human activities (Rosenzweig 2003). This study examines whether surface agricultural drains providing drainage of croplands function as fish habitat. A stronger scientific understanding of drains is needed because agricultural land-use practices have been developed to optimize the acquisition of natural resources to produce maximum crop yields without adequate consideration of natural services (Foley et al. 2005, Green et al. 2005). For example, the practices used to create and maintain drains may alter physical habitat features important to fishes. This has created tensions between the agricultural community and fisheries managers because
1
in Ontario drain maintenance is regulated by a provincial policy, the Drainage Act, while fish habitat is regulated by a federal policy, the Fisheries Act. Much of the world’s most productive, nutrient-rich soils occur in lands that are perennially wet, such as wetlands and flood plains of rivers (Van der Gulik et al. 2000). Conversion of wetlands to agricultural land requires the construction or modification of drains to remove excess water to create optimal soil and water conditions for crop growth (Skaggs et al. 1994, Van der Gulik et al. 2000). Drain construction commenced in North America in the late 1800’s and continued on a large scale through to the 1970’s (Skaggs et al. 1994). Today, nearly 70% of Ontario’s wetlands have been altered, and 85% of this land is now used for agriculture (Rudy 2004). Cultivated land, which has a high demand for drainage improvement, accounts for 61% of Ontario’s 5.5x10⁶ ha of agricultural land (Ritter et al. 1995). Regulations are now in place to protect Ontario wetlands, and to limit drainage alterations to maintenance of existing drains (Skaggs 1994). Drainage protects plants from excess soil moisture while retaining an adequate amount for growth (Skaggs et al. 1994, Van der Gulik et al. 2000). Drains work by reducing the amount of water held in the pores of soil. This makes more pores in the soil available to hold air and to deliver oxygen and nutrients to the roots of crop plants resulting in deeper and more extensive root development (Wesseling 1974, Smedema and Rycroft 1983). Oxygen is required for respiration in root tissue and for microorganisms in the soil. Under anaerobic conditions, root growth is limited and microorganisms produce compounds that are toxic to plant growth (Wesseling 1974). Increased respiration and transportation of water and nutrients through the roots result in enhanced plant growth and crop yield (Wesseling 1974). Drained soils also warm up more quickly
2
in the spring than undrained soils, increasing the length of the growing season (Wesseling 1974). Drainage also reduces soil compaction, which can degrade soil structure and hinder the emergence of seedlings (Van der Gulik et al. 2000). It is also safer to operate heavy farm machinery on well-drained soils as they can become stuck in wet soil due to lack of support or traction (Reeve and Fausey 1974). Drainage is typically achieved using either subsurface or surface drains (Van der Gulik et al. 2000). Subsurface drains work by artificially lowering the water table using perforated drain pipes installed below the soil surface, usually below the root zone, which collect and transport excess water to nearby open watercourses (Van der Gulik et al. 2000). Surface drains are shallow, open watercourses that remove water from large areas by surface runoff and eventually discharge into natural watercourses without lowering the water table (Van der Gulik et al. 2000). Surface drains can be completely manmade ditches or altered natural watercourses. The process used to convert a natural watercourse to a drain is commonly referred to as channelization and can include artificial straightening, widening and/or deepening of stream channels (Burgess 2003). Drain Construction and Maintenance: The Scientific Concerns Drains are created and maintained to meet the needs of the surrounding farmland. Engineers determine the water capacity, velocity of flow, dimensions and position of the channel. The water capacity of drains is influenced by precipitation, area of land being drained, topography, soil characteristics, vegetation and the frequency of flooding. A specific capacity is determined for each drain that will remove water at a rate that will not damage crops (Schwab et al. 1957). Drains are designed to ensure that the velocity of flow will not cause either serious scouring or sedimentation, that they will have adequate
3
depth to drain the land, and that the side slopes will be stable (Schwab et al. 1957). The position of some drains is determined by property lines and topography while main outlet drains are typically located in, or near, natural streams, which are modified to handle the required capacity (Donnan and Schwab 1974). This information is captured in an engineer’s report which becomes a municipal by-law, and channel specifications cannot deviate from those laid out in the report (DFO 2002). Drains are typically useful for 20-40 years and ongoing maintenance and/or repair are required to ensure proper function (Skaggs et al. 1994). Drain function can be impeded by sedimentation, obstruction by vegetation, or channel and bank erosion (Schwab et al. 1957). Maintenance refers to any work done to preserve a drain, and is not necessarily bound by the original engineer’s report (Drainage Act 1990). Maintenance includes the removal of vegetation or streambed material, spraying to control vegetation, seeding of disturbed bank slopes and bank stabilization (DFO 2002). Repairs are used to restore a drain to its original condition and must be done in accordance with the engineer’s report. Repairs include removal of sediment, restoring depth:width ratios or extending a drain downstream from the original termination if necessary (Drainage Act 1990). When the original drain no longer meets the needs of the area being drained, or if extensive mitigation measures are required, a new engineer’s report is needed for reconstruction. The new report may result in changing the course of the drain, making a new outlet, or constructing a tile drain under the bed of the drain. It can also include construction, reconstruction or extension of embankments, walls, dykes, dams, reservoirs, bridges or pumping stations (Drainage Act 1990).
4
Drains may function as fish habitat because of their connectivity to natural streams (Rudy 2004). The Fisheries Act defines fish habitat as “spawning grounds and nursery, rearing, food supply and migration areas on which fish depend directly or indirectly in order to carry out their life processes” (Fisheries Act 1985). Drain maintenance activities can alter essential fish habitat components by changing riparian vegetation, substrate composition, and channel features such as width, depth and occurrence of pools and riffles. Water quality can be impacted by the resuspension of fine sediments resulting in more turbid conditions. Furthermore, fish migrations can be blocked and water quality degraded while drain work is in progress (Skaggs et al. 1994, Van der Gulik et al. 2000, DFO 2002). Riparian zones are important to fishes because they filter runoff and retain nutrients (Gregory et al. 1991), which would otherwise alter fish habitat. They also influence cover, in-stream temperature and primary production (Gregory et al. 1991, Fitch and Adams 1998). However, riparian zones in agricultural areas are often altered due to land clearing for crops and grazing (Fitch and Adams 1998, Nerbonne and Vondracek 2001), and by flattening the banks and seeding with grass to prevent erosion (Schwab et al. 1957, Trimble 1997). Wooded riparian zones result in greater erosion of stream banks causing wider, instable stream widths, more variable flow and higher width:depth ratios (Trimble 1997), all of which are undesirable in drains because of the need for predictable flow. However, streams with wooded riparian zones have higher fish species richness and different species compositions than streams with open riparian zones (Stauffer et al. 2000). Changes in channel morphology, instream cover, habitat
5
volume and substrate size are also observed with changes in riparian vegetation (Stauffer et al. 2000, Nerbonne and Vondracek 2001). Drain maintenance involves the removal of any material that is blocking flow. This includes streambed material, such as gravel or large boulders, that provide substrate for spawning and cover for juveniles (DFO 2002) as well as foraging refugia for adults and juveniles (McLaughlin and Noakes 1998). Walser and Bart (1999) found reduced substrate complexity in general and a specific loss of cobble habitat in agriculturally impacted streams. The deposition of excess sediment is also considered to add to the simplification of streambeds and may result in decreased species diversity (Karr and Schlosser 1978, Walser and Bart 1999) Channelization of streams for drainage purposes results in the creation of uniform habitat including reduced variability in stream depth and a decreased occurrence of pool habitat (Etnier 1972, Walser and Bart 1999, Burgess 2003). This change in the variability of physical habitat is a significant factor in loss of species diversity in channelized streams (Etnier 1972, Walser and Bart 1999). Several studies noted decreases in fish species richness or diversity in channelized streams (Raborn and Schramm 2003, Sullivan et al. 2004). Agriculture is considered the leading source of water pollution. In 70% of impaired American streams, sediment is the most common pollutant (US EPA 1996 as cited in Nerbonne and Vondracek 2001). Surface drains can increase erosion and sedimentation when runoff catches loose soil or when vegetation is grazed from streambanks by livestock (Fitch and Adams 1998, Van der Gulik et al. 2000). Many species of fishes and invertebrates cannot tolerate the resulting excess fine sediment
6
(Lenat 1984, Walters et al. 2003) due to a reduction in food resources, habitat (Lenat 1984, Nerbonne and Vondracek 2001) and reproductive success in fishes (Berkman and Rabeni 1987). Drain Construction and Maintenance: The Policy Responses Management of drains requires the participation and cooperation of multiple government agencies. In Ontario, drains are created and maintained under the legislation of the Drainage Act, giving the provincial government authority over drains and the public lands and shorelines adjacent to them (DFO 2002). The Canadian federal government has authority for the protection of all fish habitat in the oceans, coastal lands and inland fisheries under the Fisheries Act. The overlap between these two levels of government requires them to work closely together on issues related to agricultural drainage and fish habitat. Where conflicts arise between the two Acts, the Fisheries Act takes precedence (DFO 2002). The potential for damage to fish habitat during drain construction and maintenance activities presents a conflict since drains originally constructed under the Drainage Act to service the needs of farmers are also protected under the Fisheries Act. Under the Fisheries Act, the harmful alteration, disruption or destruction (HADD) of fish habitat is prohibited unless it is authorized by the Minister of Fisheries and Oceans. Fish habitat is also protected by the Fisheries and Oceans Canada’s (DFO) Policy for the Management of Fish Habitat (DFO 1986) which has an overall objective of net gain of fish habitat and a guiding principle of no net loss of the productive capacity of fish habitat. The DFO recognizes that agriculture puts a legitimate demand on water
7
resources and that solutions must be found to integrate the needs of both agriculture and fisheries. Tensions regarding the application of the Fisheries Act to agricultural drains began in the early 1990s when the Ontario Ministry of Natural Resources (OMNR) implemented a fish habitat program through an Interim Habitat Agreement with DFO. The OMNR made efforts to educate the agricultural community about the application of the Fisheries Act to drains; however, these efforts were met with hostility from the agricultural community in parts of the province. This culminated in 1996 when the Ontario Federation of Agriculture requested that drains be exempted from the Fisheries Act. This request was denied by the DFO based on the definition of fish habitat in the Fisheries Act. However, an agreement was reached to create a system to classify drains in order to streamline the process of obtaining authorizations to perform maintenance activities (Norm Smith, DFO, pers. comm.). The Class Authorization system developed by the DFO and Conservation Ontario qualitatively classifies drains as Class A to F based on the permanency of flow, water temperature, fish species present, and the time since last maintenance (Table 1). The types of maintenance allowed have been pre-authorized for drains in Classes A to C and Class F. Drains in Classes D and E are considered the most sensitive to maintenance and require project specific authorizations from the DFO. Drains are considered sensitive if they have cool or cold water, if sensitive fish species (top-level predators, coldwater species, or other species considered to be sensitive to habitat alterations) are present or if the drains have not been maintained within 10 years and, therefore, may have reached an equilibrium state similar to natural watercourses (DFO 1999).
8
Table 1. Summary of the DFO Drain Class Authorizations used to classify drains in southwestern Ontario based on water temperature, permanency of flow, fish species present, and the time since the last performed maintenance. Drain maintenance is restricted to specific activities for each class.
9
Class A
Class B
Class C
Class D
Class E
Type F
Temp.
Cold/cool
Warm
Warm
Cold/cool
Warm
N/A
Flow
Permanent
Permanent
Permanent
Permanent
Permanent/ Intermittent
Intermittent
Fish species present
No sensitive species, baitfish only
No sensitive species, top-level predator species present
No sensitive species, baitfish only
Sensitive species
Sensitive species
No sensitive species
Last cleanout
N/A
Within 10 years
N/A
N/A
More than 10 years
N/A
Type of cleanout
Side slope brushing, Side slope brushing, Side slope brushing, Project specific bottom cleanout, bottom cleanout, bottom cleanout, debris cleanout, debris cleanout debris cleanout full cleanout
Project specific
Side slope brushing, bottom cleanout, debris cleanout, full cleanout
Although the implementation of this classification system has helped to ease the tensions between the agricultural community and fisheries managers, there are still stakeholders who do not agree with the application of the Fisheries Act to drains (Norm Smith, DFO, pers. comm.). This is evident in interactions with landowners where there appears to be a lack of understanding as to what constitutes fish habitat and the time required for fish to become established in that habitat (Katie Stammler, pers. obs.). The lack of scientific evidence regarding the potential of surface drains to provide fish habitat is a key uncertainty, as is the lack of effort to assess whether drains function in a manner comparable to natural streams (Rudy 2004, Veliz and Richards 2005). The tensions arising from this uncertainty create the need for an independent scientific assessment to address whether or not drains function as fish habitat. This assessment must be carried out before fisheries managers and the agricultural community can move forward with policy decisions. This study tests the hypothesis that surface drains in southwestern Ontario provide habitat for fishes that is similar in quality to that contained in similar-sized reference watercourses that have not been exposed to drain maintenance practices. From a scientific perspective, the definition of habitat and the selection and measurement of appropriate physical habitat variables can be difficult (Mitchell 2005). For example, only habitat features that are observable from a human perspective can be measured; however, these do not necessarily reflect the same features that fishes perceive as critical to defining habitat. In addition, there is conflicting information in the existing literature regarding the habitat features best explaining the presence of fishes (Mitchell 2005). From a policy perspective, the ecological effects of habitat change are typically measured
10
as changes in productive capacity (Jones et al. 1996), which is defined by the DFO Policy for the Management of Fish Habitat as, “the maximum natural capability of habitats to produce healthy fish, safe for human consumption, or to support or produce aquatic organisms upon which fish depend” (DFO 1986). The best measure of productivity is a direct measurement of the production rates of all fish species present, however this is very difficult to measure. There are acceptable alternatives for predicting productivity using biological indicators such as species richness, biomass and composition, or surrogate habitat variables (Jones et al. 1996, Minns 1997). My study tested five predictions. First, if drains provide habitat similar to references, I predicted that there would be no difference in the number of fish species (species richness) between drains and similar reference watercourses. It is well known that human alterations of habitat result in the loss of biodiversity (Chapin et al. 2000). In particular, several studies have shown a decline in species richness due to activities related to drainage (Etnier 1972, Walser and Bart 1999, Stauffer et al. 2000). Therefore, if habitat is altered by drainage practices, I predicted lower species richness in drains. Second,if drains provide habitat similar to references, I predicted that the total abundance of fishes present in drains and similar reference watercourses would not differ. The total abundance of fishes was used as a surrogate for total biomass because the geographic extent of the sampling carried out in this study did not allow adequate time for the calculation of the total biomass at each site. Biomass is positively correlated with changes in ecosystem productivity (Minns et al. 1996). Agricultural activities can cause an increase in productivity through the addition of nutrients, or a decrease through increases in suspended sediment and pesticides (Talmage et al. 2002).
11
Third, if drains provide habitat similar to references, I predicted that species composition, in terms of relative abundance, would not differ between drains and reference watercourses. In general, fishes have evolved to exploit specific habitats. Alterations to habitat result in the loss of species unable to adapt to the new conditions (Gorman and Karr 1978). Changes in the relative abundance of species in response to habitat change are expected to occur faster than changes in richness (Chapin et al. 2000). Fourth, if drains provide habitat similar to references, I predicted that there would be no difference in the proportion of sites with occurrences of individuals in different life stages (reproductive and juvenile) for species present in drains and reference watercourses. The Fisheries Act includes spawning, nursery or rearing grounds as part of its definition of fish habitat. Different life stages require different habitat features, and the size structure of fish assemblages can be limited by the quality of habitat (Minns 1997). Although this is not a direct measure of productivity, it does provide a link to the production of offspring (Minns 1997). This test also considers the possibility that areas with degraded habitat may act as sinks with reduced or no reproductive capacity (Pulliam 1988). The presence of reproductive and juvenile individuals could suggest that drains support self-sustaining populations. I tested the assumption that sampling effort was consistent for drains and reference watercourses (Assumption 1). Sampling effort was measured as the time spent electrofishing in seconds, the electrical power output from the electrofishing unit and the area of the watercourses sampled. I also tested the assumption that pairs were adequately matched by width and depth to assess the quality of the pairing of drains and reference watercourses (Assumption 2).
12
Fifth, if drains provide habitat similar to references, I predicted that there would be no differences in physical habitat features between drains and reference watercourses. To test this, I chose several habitat features expected to be altered by drainage activities. The velocity of flow, measured as hydraulic head and average and maximum flow, was predicted to be higher in drains as a result of channelization and the removal of materials blocking flow (Giller and Malmqvist 1998). The removal of materials blocking flow was also predicted to result in a lower average and maximum substrate size in drains (DFO 2002). The percentage of pools and riffles was predicted to be lower and the percentage of runs higher in drains because of channelization (Etnier 1972). The average bank slope was predicted to be lower because banks are often flattened to prevent erosion (Schwab et al. 1957, Trimble 1997). I predicted a lower percentage of trees and shrubs and a higher percentage of grass in riparian vegetation due to the removal of trees for crop land and the seeding of banks with grass to prevent erosion (Trimble 1997, Nerbonne and Vondracek 2001). The percentage of overhanging cover was predicted to be lower in drains and water temperature was predicted to be higher as a result of the loss of shade trees (Gregory et al. 1991). Turbidity was predicted to be higher in drains because of runoff and erosion (Van der Gulik et al. 2000).
METHODS Site Selection Forty-eight watercourses (24 pairs) were sampled in this study. Each pair consisted of one drain and one reference watercourse. Five pairs were tributaries of Lake Erie, 6 of Lake Huron and 13 of Lake St. Clair and the St. Clair River.
13
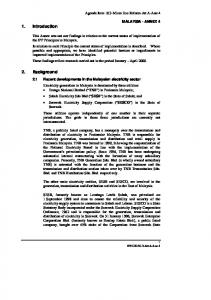
In an effort to examine the mean effect of drains over a broad geographical range, sites were located in Essex, Chatham-Kent, Lambton, Middlesex, Norfolk, Oxford, Perth, Waterloo and Wellington counties in southwestern Ontario, Canada (Fig. 1). Sites were selected based on reviews of the Drain Class Authorization Data (Arc View maps and Microsoft Access files), consultations with biologists from the local Conservation Authorities and site surveys. Reference sites were chosen from watercourses that had not been modified for drainage purposes, based on the criteria that they were in the same subcatchment, the same stream order and similar in width and depth (Osborne and Wiley 1992, Fairchild et al. 1998). These steps were taken in an effort to ensure drains and reference watercourses provided roughly the same amount of habitat for fishes, and that they had the potential to be colonized by the same species pool. However, site selection was limited by the availability of drains and reference watercourses that met these predetermined criteria. It is generally accepted that the best sampling design to assess environmental impacts includes both impacted and references sites sampled before, and after, a known impact (BACI design) (Hewitt et al. 2001, Stewart-Oaten and Bence 2001, Hayes et al. 2003). However, this intensive approach is not always possible given the time required for sampling, funding constraints, and lack of suitable historical data (Hayes et al. 2003). When it is not possible to use a BACI design, concurrently studying fish assemblages at paired reference and impact sites has been identified as a suitable alternative method to assess environmental impacts (Fairchild et al. 1998, Hayes et al. 2003, Bailey et al. 2004).
14
$ # $#
N
$
$
#
$
#
$ #
#$ #
20
N
N
0
20
$
$ # $ #
40 Kilometers
#
#$
#$
N
15
# $ $ # $
#
# $
#$
#$
$# $ $#
# # #
$
$#
Figure 1. Study area showing the location of each sampling site. ▲ represent drain sites and ● represent reference watercourses.
Sampling locations within the selected watercourses were determined by availability of access points at road crossings. For each pair, sampling began in the same direction and at approximately the same distance from the road. To decrease road impacts, sampling began 20m upstream or downstream of the road crossing where possible (Warren and Pardew 1998). In ten of the 24 pairs, this was not possible due to inability to sample a full site length before running into a physical barrier. Of these ten pairs, five were sampled approximately 15m from the road crossing, four were 10m from the road crossing and one pair was sampled less than 5m from the road crossing. Upstream or downstream location was determined by conditions such as bank slope, heavy vegetation, fences or other hazards that prevented physical access, as well as the location of the drain or reference watercourse relative to the access point. For a given pair, drain and reference watercourse sites were sampled on the same day in random order, June-August 2004, to minimize sampling effects due to weather and season. Site lengths were determined following the protocol in Smith (2003), which was developed for the purpose of defining sampling effort guidelines for fish species inventories in Great Lakes streams. Sites in first and second order streams were 18 mean stream widths (MSW) in length, and subdivided into six contiguous sample units, where each sample unit was three MSW in length. Sites in third order or higher streams were 12 MSW in length, and subdivided into four contiguous sample units of three MSW.
Fish Sampling Fishes were collected during daylight hours using a combination of seining and backpack electrofishing. Sampling was standardized in terms of gear type and effort in 16
each pair of watercourses, but varied between pairs depending on the depth, flow and presence of snags. Whenever possible, both methods were employed to ensure effective sampling of riffles, runs and pools (Walser and Bart 1999). Earlier research on similarsized watercourses in southern Ontario indicated that the order of electrofishing and seining does not affect the richness or abundance of fishes caught (Poos 2004). However, for the purpose of standardized sampling, electrofishing was always carried out first. Sites with depths less than 1m and flow less than 1ms-1 were sampled using single pass backpack electrofishing (pulsed DC current at 170-200 volts, 60 Hz). Electrofishing was performed systematically, covering the entire area of each sample unit moving upstream through the site (Stanfield et al. 2000, Poos 2004). Seining was carried out at sites that were relatively free of snags and less than 1.2m deep using a bag seine (8.2m x 2m, 7.5mm mesh, bag 2m x 2m x 2m). The entire length of the site was sampled using one seine haul for every 2 sample units. For example, in sites with six sample units, three seine hauls were conducted. All fishes were identified to species and counted. At least one individual of each species captured was kept as a voucher using either a photograph or preservation in 10% formalin. All fishes not kept as voucher specimens were returned to the watercourse. Total lengths were measured to the nearest millimeter on the first 30 individuals of each species caught at each site with each gear type. Signs of reproductive maturity, such as spawning colours, nuptial tubercles, or presence of eggs or milt, were also noted. Sampling effort was recorded as the total electrofishing time in seconds at 20 pairs, the power output of the electrofisher in watts at 12 pairs and the area of the site sampled at 14 pairs to ensure sampling effort did not differ within pairs. These data were not 17
collected at every site and pairs were only included in the analysis if the data were present for the drain and reference watercourse. At least one measure of effort was recorded for each pair.
Habitat Sampling Physical and flow characteristics were measured using a modified version of the Ontario Stream Assessment Protocol (Stanfield et al. 2000, Poos 2004). Wetted width (mm), hydraulic head (mm) and substrate size (mm) (average and maximum) were measured at the midpoint of each sample unit. Water depth (mm) was measured at three points across each sample unit perpendicular to the bank. The depth measured in the middle of each sample unit was used as a surrogate for maximum depth and is referred to as ‘centre depth’. An FP101-FP201 Global Flow Probe current meter, which can detect flow in the range of 0.1-4.5 ms-1, was used to determine average and maximum flow by moving the probe up and down slowly across each sample unit. Percentages of riffle, run and pool habitat were recorded for each sample unit. Bank slope, percentage of the channel overhung by riparian vegetation (percent cover), and percentage of the type of riparian vegetation (grass, shrubs and trees) were recorded in the top, middle and bottom sample units at each site. The average bank slope for each watercourse was calculated from both the left and right hand banks of the watercourses (Poos 2004). To determine the maximum temperature at each site, water temperature was measured to the nearest 0.01 oC using StowAway® Tidbit® data loggers over a period of at least 24 hours. Maximum temperature was chosen to reflect increases in solar input due to loss of riparian vegetation (Gregory et al. 1991). Water temperature to the nearest 1.0 oC and conductivity (µScm-1) were also recorded at each site at the time of sampling 18
using a hand held meter. Turbidity was measured prior to fish sampling using a Secchi disk.
Statistical Analyses I tested whether species richness (Prediction 1) and total abundance (Prediction 2) differed between drains and reference watercourses using a non-parametric Wilcoxon paired-sample test with α = 0.05 (JMPIN 2001). This test involves calculating the difference in values between each pair of sites, assigning ranks to the absolute value of the differences and testing the sum of ranks against a critical value (Zar 1999). This test was selected because differences for 12 of the 24 variables tested in this study were not normally distributed, and to maintain consistency in testing predictions 1, 2 and 5 and assumptions 1 and 2. The Wilcoxon test has 95% of the power of the analogous parametric paired t-test (Zar 1999). I tested whether species composition, based on relative abundances, differed between drains and reference watercourses (Prediction 3) by performing a redundancy analysis (RDA) using the vegan platform (Oksanen 2005) written for the statistical software R (R Development Core Team 2004). Prior to testing, abundances of each species were fourth-root transformed to normalize the skewed data (Cottenie 2005). RDA is a direct ordination technique based on a linear model of species responses (ter Braak 1994). It works by relating a matrix of species occurrences to a matrix of environmental features, in this case the designation of a watercourse as a drain or reference, using multiple linear regressions (McCune et al. 2002). The redundancy analysis was blocked by pairs and Great Lake basin (Erie, Huron and St. Clair) was used 19
as a covariable to remove the potential effect of differences in species pools between basins. I tested whether the presence of different life-stages of fishes varied between drains and reference watercourses (Prediction 4) using three measures of stage classification. One measure was the presence of individuals with obvious signs of spawning, such as spawning colouration, nuptial tubercles or the release of eggs or milt. We were able to identify obvious signs of spawning for 20 species. A second measure was the presence of individuals large enough to be considered mature. Lengths at maturity were obtained from Coker et al. (2001) for 37 species. A third measure was the presence of individuals small enough to be considered young of the year (YOY). YOY lengths were obtained from Scott and Crossman (1973) and other literature sources for 30 species (Appendix 1). For each measure and each species, the number of drain and reference watercourse sites containing individuals that met the above criteria were counted. Fisher’s exact tests (JMPIN 2001) were then used to test whether the proportion of sites with occurrences of spawning, mature-sized, or YOY-sized individuals differed between drains and reference watercourses for each species (Zar 1999). I tested whether measures of sampling effort, electrofishing seconds, power output and area sampled (Assumpion 1), and measures used to match drain and reference pairs, width and average and maximum depth (Assumption 2) differed between drains and reference watercourses using Wilcoxon paired-sample tests. I tested whether habitat variables differed between drains and reference watercourses (Prediction 5) using a Wilcoxon paired-sample test for each habitat variable measured (JMPIN 2001). Mean values for each habitat variable for each site were used 20
in the tests. Due to the large number of tests performed on habitat variables (n=16), a Bonferroni corrected α-level of 0.0031 was applied to protect against Type I error. Multivariate analysis of variance was not suitable for the current dataset because of missing values for a small number of variables. Turbidity was assessed by testing if the likelihood of the Secchi disk being visible at the maximum depth was related to the depth of the watercourse and whether this relationship differed between drains and reference watercourses using an effect likelihood ratio test (JMPIN 2001).
RESULTS A total of 59 fish species were collected during this study. Of these, 38 species were found in both drains and reference watercourses, 13 were found only in drains and 8 were found only in reference watercourses (Table 2). Of the 21 species found only in one type of watercourse, 20 species were observed only at a single site. Species richness did not differ systematically between drains and reference watercourses (Wilcoxon paired-sample test: p > 0.85, df = 23). Species richness in drains ranged from 3 to 15 species, with a median of 8.5 species. Species richness in reference watercourses ranged from 0 to 16 species, with a median of 9.5 species. The median difference between the drain and reference watercourse pairs was 1 species. Total abundance did not differ systematically between drains and reference watercourses (Wilcoxon paired-sample test: p > 0.20, df = 23). The total abundance of fishes in drains ranged from 10 to 1109 individuals, with a median of 122.0 individuals.
21
Table 2. Occurrences of each fish species in drains and reference watercourses. Scientific names and common names according to Nelson et al. (2004)
Petromyzontidae Clupeidae Salmonidae
Esocidae
22
Umbridae Catostomidae
Cyprinidae
Scientific Name Lampetra appendix Alosa pseusdoharengus Oncorhynchus mykiss Oncorhynchus tshawytscha Salvelinus fontinalis Esox americanus vermiculatus Esox lucius Umbra limi Carpiodes cyprinus Catostomus commersoni Ictiobus sp. Campostoma anomalum Carassius auratus Cyprinella spiloptera Cyprinus carpio Hybognathus hankinsoni Luxilus chrysocephalus Luxilus cornutus Lythrurus umbratilis Margariscus margarita Nocomis biguttatus Notemigonus crysoleucas Notropis atherinoides Notropis buchanani Notropis heterolepis Notropis hudsonius Phoxinus eos
Common Name American brook lamprey alewife rainbow trout Chinook salmon brook trout grass pickerel northern pike central mudminnow quillback white sucker buffalo central stoneroller goldfish spotfin shiner common carp brassy minnow striped shiner common shiner redfin shiner pearl dace hornyhead chub golden shiner emerald shiner ghost shiner blacknose shiner spottail shiner northern redbelly dace
Number of occurrences Drains Reference 1 0 1 0 0 1 0 1 0 1 1 0 6 2 6 3 1 0 15 14 1 0 4 8 1 1 3 1 1 0 0 2 1 1 10 9 1 5 2 1 3 3 1 2 2 2 1 1 1 3 1 1 3 3
Ictaluridae
Cyprinodontidae Gasterosteidae Centrachidae
23 Percidae
Gobiidae Cottidae
Pimephales notatus Pimephales promelas Rhinichthys atratulus Semotilus atromaculatus Ameiurus melas Ameiurus natalis Ameiurus nebulosus Ictalurus punctatus Noturus flavus Noturus gyrinus Fundulus diaphanus Fundulus notatus Culaea inconstans Ambloplites rupestris Lepomis cyanellus Lepomis gibbosus Lepomis humilis Lepomis macrochirus Lepomis megalotis Micropterus salmoides Pomoxis annularis Percina maculata Etheostoma flabellare Etheostoma blennioides Etheostoma exile Etheostoma nigrum Etheostoma microperca Perca flavescens Etheostoma caeruleum Neogobius melanostomus Proterorhinus marmoratus Cottus bairdii
bluntnose minnow fathead minnow creek chub blacknose dace black bullhead yellow bullhead brown bullhead channel catfish stonecat tadpole madtom banded killifish blackstripe topminnow brook stickleback rock bass green sunfish pumpkinseed orangespotted sunfish bluegill longear sunfish smallmouth bass white crappie blackside darter fantail darter greenside darter Iowa darter johnny darter least darter yellow perch rainbow darter round goby tubenose goby mottled sculpin
18 11 9 19 1 1 0 1 1 3 1 0 12 9 10 5 1 4 2 0 1 3 2 3 1 13 6 3 2 2 1 0
16 8 10 18 0 0 1 0 5 3 0 1 6 5 6 4 0 2 1 1 0 7 2 4 1 15 5 4 2 1 0 1
The total abundance of fishes in reference watercourses ranged from 0 to 483 individuals, with a median of 105.5 individuals. The median difference between the drain and reference watercourse pairs was 19 individuals. Species composition, measured as relative abundance, also did not differ between drains and reference watercourses (F = 0.85, P > 0.35, df = 43). The proportion of sites with observed reproductive, mature and YOY life stages did not differ systematically among drains and reference watercourses for any of the common species examined. There were no differences in the proportions of sites containing individuals with obvious spawning characteristics (all p-values > 0.28), mature-sized individuals (all p-values > 0.17) or YOY-sized individuals (all p-values > 0.29) for any species (Table 3). Sampling effort did not differ systematically between drains and reference watercourses in terms of the time spent electrofishing in seconds, power output or area sampled (all p-values > 0.52). Width and depth also did not differ systematically between drains and reference watercourses (all p-values > 0.20) (Table 4). Physical habitat features did not differ significantly between drains and reference watercourses (all p-values > 0.02, α = 0.0031) (Table 5). The likelihood of the Secchi disk being visible at maximum depth decreased with depth (Effect likelihood ratio test: 7 χ2 = 7.65, p < 0.01) and this relationship did not differ between drains and reference watercourses (Effect likelihood ratio test: χ2 = 0.05, p > 0.75). Therefore, the probability of a watercourse being turbid at any given depth does not differ between drains and reference watercourses.
24
Table 3. Summary of proportion of sites with occurrences of different life stages in drains and reference watercourses for each species. Life stages considered were spawning, mature size classes, and young-of-the-year size (YOY size). – represents data not available.
25
Species blacknose dace blacknose shiner blackside darter bluegill bluntnose minnow brook stickleback central mudminnow central stoneroller common shiner creek chub emerald shiner fantail darter fathead minnow ghost shiner golden shiner green sunfish greenside darter hornyhead chub Iowa darter johnny darter least darter longear sunfish northern pike northern redbelly dace pearl dace pumpkinseed
Spawning Drains References 5 4 4 4 3 0 1 3 0 2 1 0 1 1 0 1 0 1 0 2 2 2 1 3 0 1 2 0 1 0 0 1
Mature size Drains References 8 12 1 2 2 5 1 0 15 12 7 4 1 1 3 8 5 7 14 12 2 2 2 2 4 3 1 1 0 1 5 3 3 3 2 3 1 1 12 14 5 4 0 0 0 0 3 2 0 0 2 3
YOY size Drains References 9 9 0 0 4 1 12 9 1 0 1 1 4 3 17 18 1 1 0 1 1 0 0 0 6 4 3 2 1 2 1 0 3 1 0 0 1 1 5 3
Total sites collected Drains References 9 10 1 3 3 7 4 2 18 16 12 6 6 3 4 8 10 9 19 18 2 2 2 2 11 8 1 1 1 2 10 6 3 4 3 3 1 1 13 15 6 5 2 1 6 2 3 3 2 1 5 4
rainbow darter redfin shiner rock bass round goby spotfin shiner spottail shiner stonecat striped shiner tadpole madtom white sucker yellow perch
1 2 0 1 -
1 4 0 0 0 -
2 1 8 3 1 0 0 1 0 0
2 5 5 1 0 5 1 1 1 0
2 1 1 2 1 1 1 3 10 3
2 5 4 1 1 1 1 2 7 2
2 1 9 2 3 1 1 1 3 15 3
2 5 5 1 1 1 5 1 3 14 4
26
Table 4. Summary of sampling effort measures and parameters used for matching pairs of drains and reference watercourses. All variables were tested using Wilcoxon paired-sample tests, p-values indicate that there were no significant differences between drains and reference watercourses.
Varaiable Electrofishing seconds Power output (watts) Area sampled (m2) Width (mm) Avg depth (mm) Centre depth (mm)
Min 340 42 4.68 x 10⁴ 1440.00 153.33 164
Drain Max 2814 202 1.70 x 10⁶ 11825.00 919.17 1030
Median 1166 103 2.10 x 10⁵ 3580.00 276.56 300.60
Min 225 59 2.91 x10⁴ 1248.00 74.44 79
Reference Max 2803 215 9.33 x 10⁵ 7775.00 468.75 557.5
Median 1280 108 2.07 x 10⁵ 3537.50 217.29 250.60
p 0.52 0.76 0.59 0.84 0.23 0.20
df 19 10 13 23 19 23
27
Table 5. Summary of measured physical habitat variables expected to be affected by drain maintenance practices. All variables were tested using Wilcoxon paired-sample tests, p-values indicate that there were no significant differences between drains and reference watercourses at α = 0.0031 (Bonferroni corrected). *Indicates variables significant at α = 0.05
28
Varaiable Hydraulic head (mm) Avg flow (m/s) Max flow (m/s) Avg substrate (mm) Max substrate (mm) % Riffle % Run % Pool Average bank slope % Grass % Trees % Shrubs % Cover Max water temp (oC) Water temp (oC) Conductivity (uS/cm)
Min 0.00 0.00 0.09 0.01 8.25 0.00 0.00 0.00 0.26 10.00 0.00 0.00 0.00 19.18 14.00 39.00
Drain Max 28.33 0.68 0.92 23.00 359.75 45.00 100.00 100.00 1.17 100.00 90.00 50.00 95.00 28.29 28.50 104.00
Median 1.67 0.10 0.12 3.17 31.50 0.00 95.00 0.00 0.55 72.50 11.67 0.00 23.33 22.44 18.35 68.00
Min 0.00 0.00 0.09 0.01 0.01 0.00 0.00 0.00 0.27 0.00 0.00 0.00 0.00 15.87 13.80 42.00
Reference Max Median 27.50 2.50 0.55 0.15 0.97 0.18 71.25 4.71 290.75 72.28 96.67 6.25 100.00 74.16 100.00 0.00 0.77 0.45 100.00 51.67 90.00 41.67 70.00 0.00 98.33 56.67 35.90 23.68 26.00 18.35 176.00 61.00
p 0.79 0.87 0.89 0.04* 0.13 0.02* 0.06 0.70 0.06 0.02* 0.05* 0.56 0.07 0.62 0.18 0.13
df 18 16 10 23 23 23 23 23 23 23 23 23 18 18 23 23
Discussion The results of my study support the hypothesis that surface drains in southwestern Ontario provide habitat for fishes that is similar in quality to that contained in similarsized reference watercourses that have not been exposed to drain maintenance practices. This conclusion is supported by the consistent lack of differences between drains and reference watercourses in fish species richness (Prediction 1); total abundance of fishes (Prediction 2); species composition, measured using relative abundance (Prediction 3); proportion of sites with occurrences of spawning, adult, and young-of-the-year life-stages (Prediction 4); and physical habitat features expected to be altered by drain maintenance practices (Prediction 5). Additionally, post hoc analyses showed that there were no systematic differences in the sizes of drains and reference watercourses sampled or in the sampling effort devoted to them. Taken together, these findings demonstrate that drains are not only useful for agricultural functions, but also provide important habitat for fish communities. My study represents the first geographically and biologically comprehensive comparison of drains and reference watercourses. In extensive literature reviews, Veliz and Richards (2005) found no references comparing the characteristics or functions of first and second order drains to natural watercourses and Rudy (2004) emphasized a lack of data describing fish habitat in drains. The majority of existing literature focuses on general impacts of agricultural land use to streams adjacent to, or downstream of, an agricultural site (Luey and Adelman 1980, Lenat 1984, Walser and Bart 1999, Nerbonne and Vondracek 2001, Sullivan et al. 2004). However, these streams are not necessarily physically-altered drains. Other studies focus on a single agricultural impact such as
29
sedimentation (Berkman and Rabeni 1987), channelization (Etnier 1972, Burgess 2003, Raborn and Schramm 2003) or changes in riparian vegetation (Trimble 1997, Stauffer et al. 2000). Many of these studies examine agricultural impacts in a single watershed or, in the case of channelization, in a single watercourse. From a scientific perspective, my study suggests that drain maintenance practices do not have long-term effects on physical habitat features important to fishes. This is reflected by not detecting any differences in habitat features between drains and reference watercourses. While drain maintenance practices are expected to alter instream habitat and riparian vegetation, these effects may be short-lived or variable depending on the type of drain and the maintenance it receives. Fish and invertebrate species in drains have been observed to recover to pre-maintenance condition as quickly as one month following maintenance activities (Belinda Ward-Campbell, University of Guelph, pers. comm.). Many fish species are known to be associated with particular habitat features (Gorman and Karr 1978, Schlosser 1982), and habitat loss and degradation are known to be the predominant threats to fish species at risk in Canada (Dextrase and Mandrak 2005). Therefore, it may be reasonable that there were no differences in fish assemblages between drains and reference watercourses given that we did not detect any differences in habitat features. Also, unmeasured characteristics such as water chemistry, land use or geomorphology, do not appear to be limiting to the fish assemblages in the systems studied because there was no detectable difference in fish assemblages. Therefore, it may be reasonable to assume that physical habitat is the limiting factor in these systems. I have also shown that drains do not appear to be sink habitats (Pulliam 1988) because
30
they are similar to reference watercourses in the occurrence of different life stages of fish species. From a policy perspective, the lack of differences in species richness, total abundance or species composition, show that drains do not exhibit a net loss of productivity in comparison to reference watercourses (DFO 1986, Minns 1997). I have shown that drains function as habitat of similar quality to reference watercourses and recommend that they continue to be managed as fish habitat under the Fisheries Act, and that they be studied further to establish whether drain maintenance has short-term effects on fish assemblages. I also recommend that managers curtail the conversion of surface drains to subsurface drains in headwater areas until further information becomes available regarding the biological functions of subsurface drains. Surface drain enclosures occurred mainly between 1960 and 1980; however, proposals to enclose drains continue to be submitted across southern Ontario (Veliz and Richards 2005). In one southwestern Ontario sub-basin, approximately 38% of the watercourses are considered to be enclosed (Veliz and Richards 2005). While subsurface drains may perform some headwater functions, it is not likely that they provide fish habitat. Fishes are not expected to enter these drains given that outlets typically enter open watercourses at least 15 cm above the water surface at normal flow levels (Donnan and Schwab 1974). The results of my study suggest that enclosing drains could result in a net loss of fish habitat because I have shown that open drains provide fish habitat, but there is no indication that subsurface drains provide fish habitat.
31
As with any study, there are limitations with my sampling design and important qualifications on my conclusions that need to be considered to best identify where the information can be applied appropriately. This study focuses specifically on whether stream sections maintained as drains differ in fish assemblage characteristics and habitat features relative to stream sections that have not been maintained. However, it does not provide information about the broad effects of agricultural land use, such as sedimentation and the input of nutrients and pesticides, which may extend throughout a significant portion of the catchment (Luey and Adelman 1980, DFO 2002). As both drain and reference sites were exposed to agricultural land use, it is possible that fish assemblages would be equally altered by these effects. In southwestern Ontario, it is not possible to find a reference stream in pre-settlement condition, as such, the reference watercourses chosen are references for drain maintenance and not for the broad effects of agricultural land use. These references represent the best condition expected (Bailey et al. 2004) for streams in southwestern Ontario. Sampling for this study occurred only during the summer months and, therefore, does not account for possible differential seasonal variation in fish assemblages between drains and reference watercourses. It is well documented that fish assemblages in streams are affected by seasonal variations in environmental variables (Horwitz 1978, Schlosser 1982, Angermeier and Schlosser 1989). It has also been reported that proximate streams with distinctly different fish assemblages do not differ among seasons (Luey and Adelman 1980, Adams et al. 2004), suggesting that fish assemblage structure is more likely dependent on local habitat characteristics than seasonal variation (Ostrand and Wilde 2002). It may be useful to examine the possibility that drains and reference
32
watercourses differ in seasonal variation; however, it is not clear that the regional-scale sources of seasonal variation would differ between them. For example, sites that are of the same stream order and are located in close proximity to each other would exhibit little variation in streamflow due to position within a watershed and weather events would not be expected to differ (Horwitz 1978). It is also unlikely that differences in seasonal variation would result in the DFO rejecting my recommendation to manage drains as fish habitat. My study sought to acquire an initial assessment of the use of drains as fish habitat by sampling multiple pairs of drain and reference watercourses. Using a paired design increases the precision of the mean effect size of drains by accounting for variability among drains and among the watersheds where they are found. It also increases the interpretability of the estimated effect size by including similar-sized reference watercourses (Hayes et al. 2003). The interpretability of the estimate could have been strengthened by a before-after-control-impact (BACI) sampling design (Underwood 1992, Stewart-Oaten and Bence 2001) using historical records or sampling drains and references prior to maintenance and for an extended period following maintenance. A BACI design was not feasible for my study because historical data were not available for the sites sampled and constraints on funding and time prevented the intensive sampling required for a BACI design. However, a complementary study employing a BACI design on several drains is currently underway and will provide insight into the duration of any effects drain maintenance has on fishes and macroinvertebrates (Belinda Ward-Campbell, University of Guelph, pers. comm.).
33
My study has demonstrated that one component of an ecosystem altered or created to optimize human exploitation of natural resources for agricultural purposes can still provide natural-like services (Palmer et al. 2004). It has also provided scientific information that will help drain and fisheries managers make more logical and scientifically defensible decisions regarding the maintenance and construction of drains. Managing drains to optimize their function for land drainage and fish habitat provides a unique opportunity to design ecological solutions that help maintain, and possibly create, the habitat needed to conserve fish biodiversity in an ecosystem heavily impacted by human activities (Rosenzweig 2003, Palmer et al. 2004).
34
REFERENCES Adams, S. B., L. W. Melvin, and W. R. Haag. 2004. Spatial and temporal patterns in fish assemblages of upper coastal plain streams, Mississippi, USA. Hydrobiologia 528:45-61. Angermeier, P. L., and I. J. Schlosser. 1989. Species-area relationships for stream fishes. Ecology 70:1450-1462. Bailey, R. C., R. H. Norris, and T. B. Reynoldson. 2004. Bioassessment of freshwater ecosystems. Kluwer Academic Publishers, Norwell, Massachusetts, USA. Berkman, H. E., and C. F. Rabeni. 1987. Effect of siltation on stream fish communities. Environmental Biology of Fishes 18:285-294. Bunt, C. M., S. J. Cooke, and R. S. McKinley. 1998. Creation and maintenance of habitat downstream from a weir for the greenside darter, Etheostoma blennioides – a rare fish in Canada. Environmental Biology of Fishes 51:297-308. Burgess, C. C. 2003. Summer fish assemblages in channelized and unchannelized reaches of the South Sulphur River, Texas. M.Sc. Thesis. Department of Wildlife and Fisheries Sciences, Texas A&M University. Chapin, F. S., E. S. Zavaleta, V. T. Eviner, R. L. Naylor, P. M. Vitoursek, H. L. Reynolds, D. U. Hooper, S. Lavorel, O. E. Sala, S. E. Hobbie, M. C. Mack, and S. Diaz. 2000. Consequences of changing biodiversity. Nature 405:234-242. Coker, G. A., C. B. Portt, and C. K. Minns. 2001. Morphological and ecological characteristics of Canadian freshwater fishes. Can. MS Rpt. Fish. Aquat. Sci. 2554:iv+89p.
35
Cottenie, K. 2005. Integrating environmental and spatial processes in ecological community dynamics. Ecology Letters 8:1175-1182. Dextrase, A., and N. E. Mandrak. 2005. Impacts of invasive alien species on freshwater fauna at risk in Canada. Biological Invasions Accepted October 13, 2004. DFO. 1986. The Department of Fisheries and Oceans policy for the management of fish habitat. Communications Directorate, Fisheries and Ocean, Ottawa, Canada. DFO. 1999. A class authorization system for agricultural municipal drains in the southern Ontario region. Available at: http://www.dfo-mpo.gc.ca/regions/central/pub/factfait/L2_e.htm. DFO. 2002. Agricultural drain maintenance in southern Ontario: guidance to meeting requirements of the Fisheries Act. Unpublished report, Burlington, ON, Canada. Donnan, W. W., and G. O. Schwab. 1974. Current drainage methods in the USA. Pages 93-114 in J. V. Schilfgaarde, editor. Drainage for Agriculture. American Society of Agronomy, Inc, Madison, WI, USA. Drainage Act. 1990. R.S.O., c. D.17. Etnier, D. A. 1972. The effect of annual rechanneling on a stream fish population. Transaction of the American Fisheries Society 2:372-375. Fairchild, G. W., R. J. Horwitz, D. A. Nieman, M. R. Boyer, and D. F. Knorr. 1998. Spatial variation and historical change in fish communities of the Schuylkill River drainage, southeast Pennsylvania. The American Midland Naturalist 139:282-295. Fisheries Act. 1985. R.S., c. F-14. Fitch, L., and B. W. Adams. 1998. Can cows and fish co-exist? Canadian Journal of Plant Science 78:191-198.
36
Foley, J. A., R. DeFries, G. P. Asner, C. Barford, G. Bonan, S. T. Carpenter, F. S. Chapin, M. T. Coe, G. C. Daily, H. K. Gibbs, J. H. Helkowski, T. Holloway, E. A. Howard, C. J. Kucharik, C. Monfreda, J. A. Patz, I. C. Prentice, N. Ramankutty, and P. K. Snyder. 2005. Global consequences of land use. Science 309:570-574. Giller, P. S., and B. Malmqvist. 1998. The biology of streams and rivers. Oxford University Press, Oxford, NY, USA. Goodchild, C. D. 1993. Status of the striped shiner, Luxilus chysocephalus, in Canada. Canadian Field Naturalist 107:446-454. Gorman, O. T., and J. R. Karr. 1978. Habitat structure and stream fish communities. Ecology 59:507-515. Green, R. E., S. J. Cornell, J. P. W. Scharlemann, and A. Balmford. 2005. Farming and the fate of wild nature. Science 307:550-554. Gregory, S. V., F. J. Swanson, W. A. McKee, and K. W. Cummings. 1991. An ecosystem perspective of riparian zones: focus on links between land and water. Bioscience 41:540-551. Hayes, D. B., J. R. Baylis, L. M. Carl, H. R. Dodd, J. D. Godstein, R. L. McLaughlin, D. L. G. Noakes, and L. M. Porto. 2003. Biological effect of low-head sea lamprey barriers: designs for extensive surveys and the value of incorporating intensive process-oriented research. Journal of Great Lakes Research 29:373-385. Hewitt, J. E., S. E. Thrush, and V. J. Cummings. 2001. Assessing environmental impacts: effects of spatial and temporal variability at likely impact scales. Ecological Applications 11:1502-1516.
37
Holm, E., and J. Houston. 1993. Status of the ghost shiner, Notropis buchanani, in Canada. Canadian Field Naturalist 107:440-445. Horwitz, R. J. 1978. Temporal variability patterns and the distributional patterns of stream fishes. Ecological Monographs 48:307-321. JMPIN. 2001. version 4.0.4 academic, SAS Institute Inc. Jones, M. L., R. G. Randall, D. Hayes, W. Dunlop, J. Imhof, G. Lacroix, and N. J. R. Ward. 1996. Assessing the ecological effects of habitat change: moving beyond productive capacity. Canadian Journal of Fisheries and Aquatic Science 53:446457. Jude, D. J., R. H. Reider, and G. R. Smith. 1992. Establishment of Gobiidae in the Great Lakes basin. Canadian Journal of Fisheries and Aquatic Sciences 49:416-421. Karr, J. R., and I. J. Schlosser. 1978. Water resources and the land-water interface. Science 201:229-234. Lenat, D. R. 1984. Agriculture and stream water quality: a biological evaluation of erosion control practices. Environmental Management 8:333-334. Luey, J. E., and I. R. Adelman. 1980. Downstream natural areas as refuges for fish in drainage-development watersheds. Transactions of the American Fisheries Society 109:332-335. McCune, B., J. B. Grace, and D. L. Urban. 2002. Analysis of ecological communities. MjM Software Design, Gleneden Beach, Oregon, USA. McLaughlin, R. L., and D. L. G. Noakes. 1998. Going against the flow: an examination of the propulsive movements made by young brook trout in streams. Canadian Journal of Fisheries and Aquatic Science 55:853-860.
38
Minns, C. K. 1997. Quantifying "no net loss" of productivity of fish habitats. Canadian Journal of Fisheries and Aquatic Science 54:2463-2473. Minns, C. K., J. R. M. Kelso, and R. G. Randall. 1996. Detecting the response of fish to habitat alterations in freshwater ecosystems. Canadian Journal of Fisheries and Aquatic Science 53:403-413. Mitchell, S. C. 2005. How useful is the concept of habitat? - a critique. Oikos 110:634638. Nelson, J. S., E. J. Crossman, H. Espinosa-Penez, L. T. Findley, C. R. Gilbert, R. N. Lea, and J. D. Williams. 2004. Common and scientific names of fishes for the United States and Canada, 6th edition. American Fisheries Society Special Publication 29. Nerbonne, B. A., and B. Vondracek. 2001. Effects of local land use on physical habitat, benthic macroinvertebrates, and fish in the Whitewater River, Minnesota, USA. Environmental Management 28:87-99. Noltie, D. B. 1989. Status of the redfin shiner, Notropis umbratilis, in Canada. Canadian Field Naturalist 103:201-215. Oksanen, J. 2005. Vegan: R functions for vegetation ecologists. Available at: http://cc.oulu.fi/~jarioksa/softhelp/vegan.html. Osborne, L. L., and M. J. Wiley. 1992. Influence of tributary spatial position on the structure of warmwater fish communities. Canadian Journal of Fisheries and Aquatic Sciences 49:671-681. Ostrand, K. G., and G. R. Wilde. 2002. Seasonal and spatial variation in a prairie streamfish assemblage. Ecology of Freshwater Fish 11:137-149.
39
Palmer, M., E. Bernhardt, E. Chornesky, S. Collins, A. Dobson, C. Duke, B. Gold, R. Jacobson, S. Kingsland, R. Kranz, M. Mappin, M. L. Martinez, F. Micheli, J. Morse, M. Pace, M. Pascual, S. Palumbi, O. J. Reichman, A. Simons, A. Townsend, and M. Turner. 2004. Ecology for a crowded planet. Science 304:1251-1252. Pikitch, E. K., C. Santora, E. A. Babcock, A. Bakun, R. Bonfil, D. O. Conover, P. Dayton, P. Doukakis, D. Fluharty, B. Heneman, E. D. Houde, J. Link, P. A. Livingston, M. Mangel, M. K. McAllister, J. Pope, and K. J. Sainsbury. 2004. Ecosystem-based fishery management. Science 305346-347. Poos, M. S. 2004. Science in support of policy: assessment and recovery of fish species at risk in the Sydenham River. M.Sc. Thesis, Department of Zoology, University of Guelph. Pulliam, H. R. 1988. Sources, sinks, and population regulation. The American Naturalist 132:652-661. R Development Core Team. 2004. R: a language and environment for statistical computing. R Foundation for Statistical Computing, Vienna, Austria. Raborn, S. W., and J. L. Schramm. 2003. Fish assemblage response to recent mitigation of a channelized warmwater stream. River Research and Applications 19:289301. Reeve, R. C., and N. R. Fausey. 1974. Drainage and timeliness of farming operations. in J. Van Schilfgaarde, editor. Drainage for agriculture. American Society of Agronomy, Inc, Madison, WI, USA.
40
Resetarits, W. J. 1997. Interspecific competition and qualitative competitive asymmetry between two benthic stream fish. Oikos 78:429-439. Ritter, W. F., R. P. Rudra, P. H. Milburn, and S. Prasher. 1995. Drainage and water quality in northern United States and eastern Canada. Journal of Irrigation and Drainage Engineering 121:296-301. Rosenzweig, M. L. 2003. Win-win ecology: how the Earth's species can survive in the midst of human enterprise. Oxford University Press, New York, NY, USA. Rudy, H. 2004. Environmental impacts of agricultural drains. Unpublished report prepared for Resources Management Branch, Ontario Ministry of Agriculture and Food. Schlosser, I. J. 1982. Fish community structure and function along two habitat gradients in a headwater stream. Ecological Monographs 52:395-414. Schwab, G. O., P. W. Manson, J. N. Luthin, R. C. Reeve, and T. W. Edminster. 1957. Engineering aspects of land drainage. Pages 287-394 in J. N. Luthin, editor. Drainage of agricultural lands. American Society of Agronomy, Madison, WI, USA. Scott, W. B., and E. J. Crossman. 1973. Freshwater fishes of Canada. Fisheries Research Board of Canada, Bulletin 18, Ottawa, Canada. Simon, T. P., and D. J. Faber. 1987. Descriptions of eggs, larvae, and early juveniles of the Iowa darter, Etheostoma exile (Girard), from Lac Heney, Quebec. Canadian Journal of Zoology 65:1264-1269.
41
Skaggs, R. W., M. A. Breve, and J. W. Gilliam. 1994. Hydrologic and water quality impacts of agricultural drainage. Critical Reviews in Environmental Science and Technology 24:1-32. Smedema, L. K., and D. W. Rycroft. 1983. Land drainage: planning design of agricultural drainage systems. Cornell University Press, Ithaca, NY. Smith, K. L. 2003. Strategies for the assessment of fish species composition in Great Lakes streams. M.Sc. Thesis, Department of Fisheries and Wildlife, Michigan State University. Stanfield, L., M. Jones, M. Stoneman, B. Kilgour, J. Parish, and G. Wichert. 2000. Stream assessment protocol for southern Ontario. Ontario Ministry of Natural Resources, Salmonid Unit, Picton, ON, Canada. Stauffer, J. C., R. M. Goldstein, and R. M. Newman. 2000. Relationship of wooded riparian zones and runoff potential to fish community composition in agricultural streams. Canadian Journal of Fisheries and Aquatic Sciences 57:307-316. Stewart-Oaten, A., and J. R. Bence. 2001. Temporal and spatial variation in environmental impact assessment. Ecological Monographs 71:305-339. Sullivan, B. E., L. S. Rigsby, A. Berndt, M. Jones-Wuellner, T. P. Simon, T. Lauer, and M. Pyron. 2004. Habitat influence on fish community assemblage in an agricultural landscape in four east central Indiana streams. Journal of Freshwater Ecology 19:141-148. Talmage, P. J., J. A. Perry, and R. M. Goldstein. 2002. Relation of instream habitat and physical conditions to fish communities of agricultural streams in the northern Midwest. North American Journal of Fisheries Management 22:825-833.
42
ter Braak, C. J. F. 1994. Canonical community ordination. Part I: basic theory and linear methods. Ecoscience 1:127-140. Trimble, S. W. 1997. Stream channel erosion and change resulting from riparian forests. Geology 25:467-469. Underwood, A. J. 1992. Beyond BACI: the detection of environmental impacts on populations in the real, but variable, world. Journal of Experimental Marine Biology and Ecology 161:145-178. Van der Gulik, T. W., L. H. Christl, D. R. Coote, C. A. Madramootoo, T. J. Nyvall, and T. J. V. Sopuck. 2000. Managing excess water. Pages 121-129 in D. R. Coote and L. J. Gregorich, editors. The health of our water - toward sustainable agriculture in Canada. Research Planning and Coordination Directorate, Research Branch, Agriculture and Agri-Food Canada, Ottawa, ON. Veliz, M., and J. S. Richards. 2005. Enclosing surface drains: what's the story? Journal of SOil and Water Conservation 60:70-73. Walser, C. A., and H. L. Bart. 1999. Influence of agriculture on in-stream habitat and fish community structure in Piedmont watersheds of the Chattahoochee River System. Ecology of Freshwater Fish 8:237-246. Walters, D. M., D. S. Leigh, and A. B. Bearden. 2003. Urbanization, sedimentation, and the homogenization of fish assemblages in the Etowah River Basin, USA. Hydrobiologia 494:5-10. Warren, M. L., and M. G. Pardew. 1998. Road crossings as barriers to small-stream fish movement. Transaction of the American Fisheries Society 127:637-644.
43
Wesseling, J. 1974. Crop growth and wet soils. in J. Van Schilfgaarde, editor. Drainage for agriculture. American Society of Agronomy, Inc., Madison, WI, USA. Zar, J. H. 1999. Biostatistical analysis, 4th edition. Prentice-Hall, Inc., Upper Saddle River, NJ, USA.
44
Appendix. Sizes for maturity according to Coker et al. (2001) and young of the year (YOY) according to Scott and Crossman (1973), unless otherwise noted, for species in this study. Species blacknose dace blacknose shiner blackside darter bluegill bluntnose minnow brook stickleback central mudminnow central stoneroller common shiner creek chub emerald shiner fantail darter fathead minnow ghost shiner golden shiner green sunfish greenside darter hornyhead chub Iowa darter johnny darter least darter longear sunfish northern pike northern redbelly dace pearl dace pumpkinseed rainbow darter redfin shiner rock bass round goby spotfin shiner spottail shiner stonecat striped shiner tadpole madtom white sucker yellow perch
Size at maturity (TL) (mm) 58.16 28.70 70.00 108.35 57.35 57.34 110 SL 70.00 87.02 101.01 47.42 55.00 65.07 43.00 77.82 76.00 56.00 104.44 43 SL 44.25 32.00 99.00 602.35 55.57 110.36 73.04 43.00 34.95 67.88 43.00 65.00 63.03 89 SL 78.32 73.72 295.00 201.25
Size of YOY (TL) (mm) 25-61 by 1 year 20 18-81 yoy 37 by December 18-37.5 23-39 (Pikitch et al. 2004) 13.2 - larval 51-89 by 1 year 51 by November 30 by 1 year (Resetarits 1997) 20-38 (Holm and Houston 1993) 76 by 1 year 20-64 yoy 52-60 at 1 year (Bunt et al. 1998) 44-58 by 1 year 14.6 juvenile (Simon and Faber 1987)
20-46 yoy 152 by September 21 by 1 year 55-65 1y 20-81 yoy 28-46 by Oct 18-51 (Noltie 1989) 20-51 yoy 29-61 yoy (Jude et al. 1992)
30-81 yoy 25-64 (Goodchild 1993) 18-56 by Sept 55.2 by Sept. 46-102 by Oct
45