for adult cyclists (on the road network). â Which factors explain that .... FINAL MODEL. Choice of the specification ... Exit ⨠High traffic volume. Succession of ...
Predicting cycling accident risk in Brussels A spatial case-control approach . Gregory VANDENBULCKE Isabelle THOMAS Luc INT PANIS (1)
Center for Operations Research and Econometrics (CORE) and Department of Geography Université catholique de Louvain (UCL) (2) National Fund for Scientific Research (FRS-FNRS), Belgium (3) Flemish Institute for Technological Research (VITO) (4) Transportation Research Institute, Universiteit Hasselt
Introduction • Bicycle use is promoted by public health and transportation specialists – effective way to induce a shift to a healthier and environmentally sustainable lifestyle
(Buehler et al., 2011; Chapman, 2007; de Geus et al., 2008; de Nazelle et al., 2011; Elvik, 2009; Jacobsen, 2003; Oja et al., 2011; Polis, 2012; Vandenbulcke et al., 2009; WHO, 2002)
– adverse health effects due to the exposure to traffic exhaust compounded by physical activity (Int Panis et al., 2010; Rojas-Rueda et al., 2011; Bos et al., 2013).
– wide consensus: risks are dwarfed by the health benefits (de Hartog et al., 2010; Rabl and de Nazelle, 2011).
• Accident risk is poorly known (relative to cycling volume & controls) (Aertsens et al., 2010)
Bicycle accidents in 1892
Attractive environment and high bicycle share
Brussels
Greg
% Commuters cyclists
Accident Risk (Nbr. accidents / 100.000 minutes)
Research question
Objective & region
Methodology
Data
Results
Network location 2
Network location 1 Bicycle traffic =
Accident risk location 2 > location 1 Importance of space/location
Spatial factors?
?
? ?
?
Conclusions
Research question
Objective & region
Methodology
Data
Results
Conclusions
• Objectives: – Explain the spatial variation of accident risk for adult cyclists (on the road network) – Which factors explain that location 2 > location 1?
• Method: multivariate spatial model (Bayesian) • Studied area: Brussels-Capital Region (BCR), 19 municipalities • Spatial units: bicycle accidents – individual data – Any trip purpose, 2006-2008 accident street network
Research question
Objective & region
Methodology
Data
Results
Conclusions
Accident models • Overall, traffic accident research aims at predicting – accident frequency or – injury severity – as a function of several independent variables/factors
• Methodological problems – Underreporting – Lack of exposure data (e.g. Cyclist traffic flows) – Lack of suitable controls
Research question
Objective & region
Methodology
Data
Results
Conclusions
Accident models Models based on accident-only data Regression methods (e.g. multinomial logit models) Issues: over-/under-dispersion, underreporting, etc.
Models based on surveys, road trajectories
Regression methods (e.g. logistic models) Main issue: bias in the selection of road trajectories
Models based on case-controls?
Casecontrol strategy
(Cases = accidents) + (Controls = generated absences) yi = (0,1) Regression methods (e.g. logistic models) Advantage: estimation of risk, reduced statistical bias Issues: no vehicle & human factors, selection of controls
Transportation (gravity-based models)
Epidemiology (case-control studies)
Ecology (generation of controls)
Research question
Objective & region
Methodology
Data
Results
Conclusions
Rigorous spatial modeling • Binary dependent variable (yi = 0,1) logistic specification • Corrections for – Multicollinearity – Heteroskedasticity – Residual spatial autocorrelation omitted variables? spatial models
• Spatial models (Bayesian framework) – Hierarchical auto-logistic model
Research question
Objective & region
Methodology
Data
Results
• Accident risk = time-consuming process – Accidents (cases) to be geocoded/located – ‘Absences’ (controls) to be generated • … rigorous sampling method
– Road network exclude ‘unbikeable’ links – Risk factors at different scales
Conclusions
Research question
Objective & region
Methodology
Data
Results
Conclusions
Road network • Orthophotos network data in GIS Cinquantenaire, Schuman Place SaintPierre
La Chasse
Merode
Research question
Objective & region
Methodology
Data
Road network • Represented as lines in GIS
• Exclusion of ‘unbikeable links’, i.e. motorways, tunnels, etc. ~ 2000 km • Elevations (bridges) • Traffic direction • Contraflow cycling • One-way streets (contraflow cycling not permitted) • Roundabouts, etc.
Results
Conclusions
Research question
Objective & region
Methodology
Data
Results
Conclusions
Geocoding accidents Accident data (2006-2008)
600 Geocoded accidents (93%) Reference data (addresses) Combination
Reference data (bikeable network)
Semi-automatic process
Manual process if: (1) Unmatched, tied (2) Check process not ok
Research question
Objective & region
Methodology
Data
Results
Conclusions
Controls/‘absences’ • Controls = locations without any accident (officially) supposed to be safe • Generation of controls = random sampling of points along the road network, BUT: Proportional to bicycle traffic (stratified sampling) Exclude ‘black zones’ (hot spots of accidents) from the
bikeable network Black zones
1) Negative exponential function 2) 500 impedance functions 3) No edge effect
Sampling intensity
Potential bicycle traffic
Stratified random sampling Ncontrols = 4*Naccidents
Sampling region
Black spots (network kernel densities)
1 1 1111 1111 1 1
Research question
Objective & region
Methodology
Data
Results
Risk factors • Digitized in GIS from: – Orthophotos
GeoLoc 2009 (high resolution)
• GeoLoc: 2004-2009 • Google Earth: 2004-2007-2009
– Shapefiles – Cycling maps (2006-2007-2008)
• Infrastructures – Control for: – Traffic direction – Building year
Google Earth 2004 (low-medium resolution)
Conclusions
Research question
Objective & region
Methodology
Data
Results
Conclusions
Risk factors
Road complexity?
Suggested cycle lanes
Contraflow cycling
Research question
Objective & region
Methodology
Data
Results
Conclusions
Risk factors Infrastructure factors • Cycling facilities & contraflow cycling • Discontinuities • Parking areas & garages • Bridge & funnels • Crossroads & complexity • Tram railways Discontinuity • Traffic-calming areas • Major roads • Proximity city centre • Distance to specific points of interest (e.g. schools, bus stops, etc.)
Park
Traffic conditions • Cars • Trucks/lorries & buses • Vans
Transport stops Environmental factors • Gradients • Green blocks (parks, etc.)
Research question
Objective & region
Methodology
Data
Results
MODELLING PROCESS
DATASET DEPENDENT VARIABLE (BINARY) Accident data (geocoded) Controls/absences
Choice of the specification Corrections for spatial effects Convergence diagnostics
GIS INDEPENDENT VARIABLES (RISK FACTORS)
FINAL MODEL
Infrastructure factors Traffic conditions Environment (physical)
PREDICTIONS
Conclusions
Research question
Objective & region
Methodology
Data
Results
Conclusions
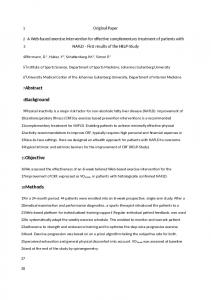
Predictions for a trajectory Succession of crossroads on a major road (Wetstraat/Rue de la Loi) + segregated cycling facility
Exit High traffic volume
Schuman’s roundabout
High traffic volume
Residential ward + contraflow Tram railways
Residential ward
End of a separated cycling facility at the crossroad
PART B: ACCIDENT RISKS
Accident risk
« Black spots » (reported accidents)
Indicated in ellips: • no bicycle accidents (officially) • But … P(accident) is far from being negligible Unreported accidents at these places?
Research question
Objective & region
Methodology
Data
Results
Conclusions
Operationnally • identification of significant infrastructure factors • Great care to be taken with: – Intersections (–) – Intersections equipped with cycling facilities (–): no half-measures… – Cycling facilities along parking areas (–) – Streets with on-road tram railways (–) – Streets with high van & truck traffic volumes (–)
• Favouring streets with contraflow cycling (+)
Research question
Objective & region
Methodology
Data
Results
Conclusions
Limitations & perspectives • Data limitations – Quality of the data (e.g. underreporting of accidents) – ...
• Case-control strategy – Time-consuming digitization – No human- or vehicle-related attributes – Dependent on the selection of controls (?)
Testing the validity of the results for… – sampling methods – ratios controls/cases
Research question
Objective & region
Methodology
Data
Results
Conclusions
Conclusions • Cycling accident risks were calculated using an innovative case-control framework • Control sites are sampled on the bikeable network in function of expected bicycle traffic flows • A very detailed spatial dataset of potential risk factors was build for Brussels • On-road tram tracks, bridges and complex intersections carry the highest risk • Shopping centres, garages, busy van and truck traffic and parked vehicles also increase risk • Contrary to popular belief contraflow cycling reduces accident risk.
Risks may still be high even where no accident has yet been reported
Questions? => papers by Vandenbulcke et al. • •
•
•
Grégory Vandenbulcke, Isabelle Thomas, Bas de Geus, Bart Degraeuwe, Rudi Torfs, Romain Meeusen, Luc Int Panis, 2009. Mapping bicycle use and accident risk for commuters in Belgium. Transport Policy, 16, 77-87 doi:10.1016/j.tranpol.2009.03.004 Joris Aertsens, Bas de Geus, Grégory Vandenbulcke, Bart Degraeuwe, Steven Broekx, Leo De Nocker, Inge Liekens, Inge Mayeres, Romain Meeusen, Isabelle Thomas, Rudi Torfs, Hanny Willems, Luc Int Panis, 2010. Commuting by bike in Belgium, the costs of minor accidents. Accident Analysis and Prevention 42 (2010) 2149–2157. http://dx.doi.org/10.1016/j.aap.2010.07.008 Grégory Vandenbulcke, Claire Dujardin, Isabelle Thomas, Bas de Geus, Bart Degraeuwe, Romain Meeusen, Luc Int Panis, 2011. Cycle commuting in Belgium: Spatial Determinants and ‘Re-Cycling’ Strategies. Transportation Research Part A 45: 118–137 doi:10.1016/j.tra.2010.11.004 Grégory Vandenbulcke, 2011. ‘Spatial analysis of bicycle use and accident risks for cyclists’ (Analyse spatiale de l’utilisation du vélo et des risques d’accident pour les cyclistes). Université Catholique de Louvain (UCL), 25 novembre 2011, Doctorat en sciences (UCL géographie).
References • •
•
•
Grégory Vandenbulcke, Isabelle Thomas, Bas de Geus, Bart Degraeuwe, Rudi Torfs, Romain Meeusen, Luc Int Panis, 2009. Mapping bicycle use and accident risk for commuters in Belgium. Transport Policy, 16, 77-87 doi:10.1016/j.tranpol.2009.03.004 Joris Aertsens, Bas de Geus, Grégory Vandenbulcke, Bart Degraeuwe, Steven Broekx, Leo De Nocker, Inge Liekens, Inge Mayeres, Romain Meeusen, Isabelle Thomas, Rudi Torfs, Hanny Willems, Luc Int Panis, 2010. Commuting by bike in Belgium, the costs of minor accidents. Accident Analysis and Prevention 42 (2010) 2149–2157. http://dx.doi.org/10.1016/j.aap.2010.07.008 Grégory Vandenbulcke, Claire Dujardin, Isabelle Thomas, Bas de Geus, Bart Degraeuwe, Romain Meeusen, Luc Int Panis, 2011. Cycle commuting in Belgium: Spatial Determinants and ‘Re-Cycling’ Strategies. Transportation Research Part A 45: 118–137 doi:10.1016/j.tra.2010.11.004 Grégory Vandenbulcke, 2011. ‘Spatial analysis of bicycle use and accident risks for cyclists’ (Analyse spatiale de l’utilisation du vélo et des risques d’accident pour les cyclistes). Université Catholique de Louvain (UCL), 25 novembre 2011, Doctorat en sciences (UCL géographie).