BackStreamDB: A Distributed System for Backbone Traffic Monitoring Providing Arbitrary Measurements in Real-Time Christian Lyra1 , Carmem S. Hara2 , and Elias P. Duarte Jr.2 1
Brazilian Research Network (RNP) – Point of Presence at Parana State P.O.Box 19037 81531-990 Curitiba-PR, Brazil 2 Department of Informatics – Federal University of Parana P.O.Box 19081 81531-990 Curitiba-PR, Brazil
[email protected], {carmem, elias}@inf.ufpr.br Abstract. Monitoring the traffic of wide area networks consisting of several autonomous systems connected through a high-speed backbone is a challenge due to the huge amount of traffic. Keeping logs for obtaining measurements is unfeasible. This work describes a distributed real-time strategy for backbone traffic monitoring that does not employ logs and allows arbitrary metrics to be collected about the traffic of the backbone as a whole. Traffic is sampled by monitors that are distributed across the backbone and are accessed by a Stream Processing Engine (SPE). Besides the distributed monitoring architecture, we present an implementation (BackStreamDB) that was deployed on a national backbone. Case studies are described that show the system flexibility. Experiments are reported in which we evaluated the amount of traffic that can be handled.
1
Introduction
Consider a wide area network, consisting of several Autonomous Systems (AS) connected through a high-speed backbone. Obtaining information about the network as a whole and about individual components, in particular traffic information, is the first step for most of network management tasks. Traffic information is important for evaluating the performance, monitoring the security and for generating profiles that can be used by accounting systems. Although a combination of polling and alarms offered by traditional network management protocols can be effectively used in certain limited settings, it does not scale well, and cannot be used for monitoring traffic in large backbones. One way to gather information about network traffic is by using a sniffer. Sniffers are able to store and decode all network traffic they see. Although this may allow the extraction of any type of traffic information, in order to be deployed at a wide area backbone sniffers should obtain the complete network traffic, and the amount of data to be processed can be overwhelming. To solve this problem, network vendors have been developing for several years products that are effective in gathering information on network traffic. Protocols like Netflow3 and Sflow [13] obtain information at the packet flow level. A “flow” 3
http://www.cisco.com/web/go/netflow
is defined as a set of packets of a given protocol flowing between two endpoints, each consisting of an IP address and transport-layer port. After the flow information is obtained, it is stored in secondary memory, and tools like flow-tools4 and ntop5 can be employed for obtaining information about the traffic. This approach for network monitoring has several drawbacks. First, the majority of existing tools require flow data to be stored in order to be analyzed. Depending on the volume of traffic, this would demand considerable storage space for keeping logs, and possibly a tool for managing the log size, such as RRD6 . In addition, since data flows are not processed at the time they are processed by routers, flow measurements are not provided in real-time. This may have an impact on important network administration tasks, such as the detection of traffic anomalies generated by port sweeps or port scans. Second, both ntop and flowtools are based on a limited set of predefined metrics. Although they are meant to cover a large number of network administration needs, it is quite common for network administrators to develop scripts in order to obtain additional monitoring information. However, this approach does not exempt flow traffic from being stored, and does not provide results in real-time. In this paper we propose a distributed architecture for integrating Stream Processing Engines (SPE) and flow monitoring tools within a framework developed for large-scale backbones consisting of multiple autonomous systems. SPEs [10] were developed to provide the same basic features found in traditional Database Management Systems, but operations are executed in real time on continuous data streams. In our case the data stream is the network traffic itself. We have implemented a system, called BackStreamDB, based on the proposed architecture. In this system, metrics of interest to the network administrator are expressed in a high level SQL-like language. This allows arbitrary queries to be issued about the traffic that is flowing across the whole backbone, in which flow data sources may be geographically distributed. Query results are provided in real time, and can refer to either a particular segment, or to a set of (or all) autonomous systems of the backbone. This approach of defining metrics as queries allows modifications and improvements to be easily made on the fly by just executing a different query. In addition, one of the most significant contributions of the system is that arbitrary measures can be obtained without storing any traffic logs. As the amount of traffic in these systems is huge, existing passive monitoring strategies that rely on logs [4, 8] are hardly able to offer similar functionality. Another key advantage of the proposed strategy is extensibility. In its current implementation, BackStreamDB monitors a backbone using Netflow records as source data. It extends our previous work [11], in which we propose a system to monitor local segments at the packet level. Thus, the system can provide a general framework for monitoring a network, in which the administrator issues queries to gather measurements from both local and wide area networks using the same language. 4 5 6
http://www.splintered.net/sw/flow-tools/ http://www.ntop.org http://ee-sta~ethz.ch/~oetiker/webtools/rrdtool/
BackStreamDB has been tested on the Brazilian RNP backbone7 , showing the feasibility of the proposed approach. Case studies are described that show the system flexibility. Experiments are reported in which we evaluated the amount of traffic that can be handled. The main contributions of this paper are: – An architecture for distributed traffic monitoring based on a Stream Processing Engine and flow processing protocols, integrated to a multi-AS backbone traffic monitoring framework; – Development of a distributed traffic monitoring system based on the proposed architecture. It allows arbitrary queries about the traffic on a wide area backbone to be processed in real time; – Experimental deployment of the system on the Brazilian national RNP backbone and analysis of results on real datasets. The rest of this paper is organized as follows. Section 2 presents an architecture for traffic monitoring based on SPEs, and BackStreamDB, the system built based on the proposed architecture. Section 3 presents experimental results and Section 4 describes related work. The conclusion follows in Section 5.
2
An Architecture for Backbone Traffic Monitoring
The distributed monitoring architecture we propose allows a network administrator to issue arbitrary queries to obtain network traffic information from a multi-AS backbone. Different granularity are permitted as monitored objects may range from individual segments to the backbone as a whole. Data is obtained from multiple flow data sources that are geographically distributed across the network, and traffic information is obtained and processed in a distributed fashion in real time. This strategy is scalable, as it is possible to accommodate increasingly larger traffic loads by changing the system configuration to distribute data to other existing nodes in the network. The architecture is shown in Figure 1. SPE (Stream Processing Engine) nodes are deployed for processing queries, and the system has three other main components: acquisition modules, universal receiver (ureceiver), and global catalog, that are described below. Acquisition modules are in charge of receiving flow data and of converting them to SPE conformant format. The data is then sent to one or more SPE nodes for query processing. An SPE node can either process the entire query or forward partial results to be processed by another SPE node. The final query results are sent to ureceiver. The acquisition modules are thus responsible for the interface between data sources and SPEs. A ureceiver (universal receiver) is responsible for the interface between SPEs and visualization tools. Query results can also be stored for historical purposes. In short, ureceiver is responsible for consuming data produced by SPEs and forwarding them to appropriate applications. Information about queries that are being processed by SPEs are stored on the third component of the system: the global catalog. For each query the catalog maintains the query definition and information specifying the SPE nodes which are executing the query. There is a large spectrum of possible system configurations, ranging from a fully distributed system in which each module is assigned to a distinct node, to 7
http://www.rnp.br
Fig. 1. Architecture for traffic monitoring based on SPE and flow protocol.
a centralized system, in which a single node runs all modules. Ideally, when data sources are geographically distributed, both an acquisition module and an SPE node should be deployed close to the source. In this way, source data can be locally filtered by the SPE node, reducing the volume of data to be transmitted among SPE nodes and the ureceiver. Query results can be either accessed in real time by a network administrator with visualization tools, or can also be stored if required. Since the system does not log flow data, but only query results that have been individually specified by the administrator, BackStreamDB can drastically reduce the storage cost. Query definitions are fed to the system by a Query Register Tool in a high-level query language, which makes queries easy to maintain. 2.1 BackStreamDB A distributed monitoring system called BackStreamDB was implemented based on the proposed architecture. Borealis [1] was chosen as the SPE. The main reason for this choice is that its distributed nature enables a set of SPE nodes to be deployed across the network, and in particular, close to data sources. The Borealis component called BigGiantHead is used to deploy a query on SPE nodes. The BigGiantHead can be executed in either transient or “daemon” mode. In transient mode, the application is invoked only to send control data to SPEs, and then quits. Control data include assignment of query tasks to SPEs, and data flow information. In “daemon” mode it continuously listens for query invocation requests and sends the control data accordingly to SPEs. Currently, BackStreamDB processes Netflow data. In the current system, the acquisition module obtains data using the New Netflow Collector (NNFC)8 . NNFC is a tool for capturing and storing Netflow data sent by a router. An NNFC plugin was developed to allow communication using Internet Process Communication (IPC) with flowsender, an application we developed for translating and forwarding data to Borealis SPEs. BackStreamDB can be easily extended to support other formats besides Netflow. A new input format can be configured in a way that is similar to defining a new schema for databases, or wrappers to exchange data between applications. This process involves: specification of the Borealis input format, and development of an application for translating data collected from the source to the new format in the acquisition module. 8
http://sourceforge.net/projects/nnfc
(a)
(b)
Fig. 2. (a)Query that generates a traffic matrix. (b)Anomaly detection query.
Query results produced by SPE nodes are sent to a ureceiver. In the standard Borealis distribution it is necessary to develop a new receiver application for each distinct query result format. This is because Borealis outputs results in binary format, and the receiver is responsible for decoding these values into typed output fields. We have changed this approach by coding the ureceiver with the capability to infer the output format based on the query definition. As a result, the system does not have to be recompiled when new query results are defined, as in the standard Borealis distribution. When invoked, ureceiver waits for a connection from a Borealis SPE, and when new query results arrive, they are output either in text or graphical form by a visualization tool. For the query language, we employ the same language adopted by Borealis, in which queries are expressed in an XML document, containing input, output, and query definitions. BackStreamDB’s query register tool reads the XML document, stores the information in the global catalog, and communicates with BigGiantHead through the network in order to deploy the execution of queries on different nodes. For showing the generality of the proposed architecture and system, we next present how one can easily build a traffic matrix and detect traffic anomaly using BackStreamDB. Traffic Matrix A traffic matrix shows the amount of traffic transmitted among all possible pairs of nodes of a given network. It provides useful information for defining routing policies and for taking traffic engineering decisions. Building a traffic matrix with BackStreamDB is simply a matter of configuring the system to aggregate the records by source and destination AS while summing up the octets, as depicted in Figure 2(a). Here, we use a graphical representation of a query, in which each box executes an operation supported by the query language. First, the query computes the sum of octets in Netflow records with the same source and destination autonomous systems, src AS and dst AS, respectively, generating a result every 300 seconds. Then, a union operator is applied to combine the results in a single output stream. Traffic Anomaly Detection It is possible to use BackStreamDB to detect traffic anomalies such as port sweeps or port scans. A very common type of network probing consists of sending packets to all hosts on a given network in order to find the active and working ones. This probe can be characterized by packet flows consisting of one single packet; that is, usually the probing host sends just one ICMP or UDP packet. A query for detecting this kind of anomaly is shown in Figure 2(b). First, flows are filtered, selecting only those that consist of one single packet (pkt == 1). These flows are then grouped by
source (src ip) and destination IPs (dst ip). In order to count the number of distinct destinations of packet flows sent from a single source, we regroup them considering only the source IP. The result is the number of one packet flows sent by distinct source addresses. This result can then be filtered considering a given threshold. In our example, only source addresses issuing at least 500 probes are considered suspicious, and are reported in the query result. These two examples show the expressive power of the system’s query language, and the flexibility of the proposed system, which has several applications. In the next section, we present experimental results that show that it is feasible to deploy BackStreamDB for monitoring the traffic of a wide area network.
3
Experimental Evaluation
In order to validate BackStreamDB three experiments were executed and are described below. These experiments show the amount of traffic the system is able to handle in terms of Netflow records. Experiment 1: Single Node, Synthetic Traffic The first experiment involved a single node processing synthetic traffic, which we fully controlled in order to check whether results generated by BackStreamDB were as expected. This experiment also allowed the evaluation of how much traffic could be processed by an SPE. Two hosts were employed, a processing node and a client node. The processing node was an Athlon XP 2600+ with 1 GB of RAM. We implemented and used a tool (dummysender) for generating synthetic Netflow data. The client node, which executed the BigGiantHead, dummysender, flowsender and ureceiver applications, was a 900MHz Celeron CPU with 2GB of RAM. Both computers were connected to a 100Mbps Ethernet LAN. The traffic rate generated ranged from 1,000 to 4,000 Netflow records per second, using steps of 1,000 records. The SPE executed a simple but useful query which computes the number of packets processed within an interval (window) of 10 seconds. Since we knew the expected results in advance, it was straightforward to verify the results. The experiment was repeated 10 times for each record rate, and the results were accurate for all record rates up to 35,000 records per second, approximately. At rates above this point the SPE entered an error state and crashed. The same experiment was later executed using a faster processor, a 2GHz Core 2 Duo machine with 1GB of RAM. In this case we were able to achieve accurate results for rates up to 60,000 records per second. Experiment 2: Multiple Nodes, Synthetic Traffic In order to simulate an environment similar to the Brazilian RNP backbone, with several geographically distributed Autonomous Systems, we have deployed multiple SPE nodes, each of them capturing a distinct stream of Netflow records, as illustrated in Figure 3(a). Similar to the first experiment, we considered a synthetic load generated by dummysender, and employed 3 processing nodes and one client node. The processing nodes were based on Athlon XP processors (models 2600+, 2400+ and 2200+) each with 1GB of RAM. The client node (executing BigGiantHead and ureceiver applications) was the same one employed in the previous experiment, featuring a 900MHz Celeron processor with 2GB of RAM. All computers were connected to a 100Mbps Ethernet LAN.
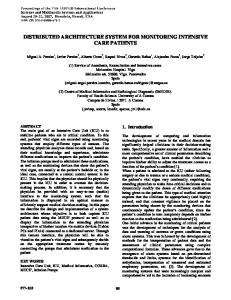
1.80 M
BackStreamDB File
1.60 M
# records
1.40 M 1.20 M 1.00 M 800.00 k 600.00 k 400.00 k 200.00 k 0.00 0
10
20
30
40
50
60
time (m)
(a)
(b)
Fig. 3. (a)Experiments with synthetic traffic. (b)Results generated on real traffic.
The same query employed in the first experiment was issued in this case: the number of packets processed within 10 seconds window. However, in this experiment each node processes only the locally generated records. Partial results were then sent by each processing node to a node elected to produce the final result. On each processing node we generated traffic at a rate of 30,000 records per second, which was correctly summed up by the elected node, which produced the output of 90,000 records at all repetitions of the experiment. Observe that similar rates are expected for processing queries as the ones illustrated in Figures 2(a) and 2(b). For 2(a), the grouping and sum of octets could be locally executed at each processing node, and only the union of all results at the client node. For distributing the query on Figure 2(b), the filtering and the first grouping and counting operations could be executed locally at each processing node, while the second aggregation and filtering operations at the client. This experiment results show that BackStreamDB scales well, and is capable of processing heavier traffic loads by adding new processing nodes to the system. Experiment 3: Multiple Nodes, Real Traffic The goal of the third experiment was to evaluate the tool with a real traffic load. This experiment was conducted at the Brazilian Research Network (RNP), using traffic flow data collected at the Parana state Point of Presence (PoP-PR). Traffic information was collected with Nprobe, an application that collects traffic from a mirrored port of a border switch, and outputs a Netflow stream. Nprobe was configured to send a copy of the Netflow stream to our acquisition application, and also to an application for storing the data. The processor that collects Netflow streams produces output data in intervals of 5 minutes, the standard window size for this kind of application. We have issued queries to generate results in the same window size by BackStreamDB. This allows a straightforward verification of the results, with a direct comparison with the expected results generated from stored data. The real traffic load differs from the synthetic load of Experiments 1 and 2 described above because of its high variance. While the synthetic load is a continuous stream, the real load oscillates from very low rates to occasional bursts containing a large number of packets. Records were sent to BackStreamDB at intervals of 30 seconds.
The traffic processed by Nprobe was around 1Gbps, which corresponds to 100,000 packets per second. When this traffic is transformed to Netflow, about one million records are generated every 5 minutes. We used the same query of the other experiments. The processing node was a 2GHz Core 2 Duo CPU with 1GB of RAM. Figure 3(b) shows the total number of records produced by BackStreamDB and also the values obtained by processing the Netflow files for an interval of one hour. It can be observed that the results are not identical throughout the experiment. There are two reasons for this difference. First, there is a small difference on the total number of records stored on the file, and processed by BackStreamDB. While BackStreamDB processed 14,160,930 records during an hour, the file contained 14,799,980 records, resulting in a difference of 0.1% records, possibly due to the loss of a few UDP packets, which is the transport protocol employed to carry Netflow data. The second reason is that the application that collects Netflow records uses the machine local time to determine its window, while BackStreamDB uses the timestamp from the record itself. So it is possible that the set of records processed in each system on a given time window is not the same. This can be evidenced on the graphic, which shows a smaller number of records in a time frame, followed by a time frame with larger number of records. However, during the entire experiment, this difference was at most 5.2%, which happened around the 40th minute. This experiment showed that BackStreamDB was able to monitor the traffic of a high-speed national backbone, providing real time measurements that were consistent with the ones generated from stored data.
4
Related Work
Several existing network management and traffic monitoring tools can be considered to be related to this work. An extensive list can be found in [6]. Among the tools that process Netflow, one of the first distributed as open source is cflowd9 , which later originated flowscan10 . In [8] the authors argue that tools for packet analysis do not scale well for high speed networks and propose a framework for monitoring backbones in real time which is based on Netflow. The framework has a centralized architecture, and requires users to write plugins for each monitoring task. In [12], a tool which collects Netflow data and export them in pcap format is described. Such data can then be used as input to Wireshark11 to obtain analytical information. Ntop12 is a tool that can be used both for packet analysis and for flow management, using a Netflow/Sflow plugin. It is possible to generate various types of reports and graphics using Ntop, but they are limited to the predefined metrics provided by the tool, i.e. arbitrary queries are not supported. Another system for traffic monitoring based on Netflow is presented in [4]. That system captures Netflow records which are then stored in an Oracle Database. Databases allow arbitrary queries to be issued on the stored data. However, this approach still requires a considerable amount of storage, as 9 10 11 12
http://www.caida.org/tools/measurement/cflowd http://www.caida.org/tools/utilities/flowscan/ http://www.wireshark.org http://www.ntop.org
opposed to on-the-fly stream processing. The authors of SMART [15] argue that traditional Netflow tools that store collected data on disk for later processing are not efficient for large-scale network traffic monitoring. They propose an in memory storage in order to process data efficiently. The reported results in terms of Netflow records processed per second - thirty thousand records per second is very close to what we have achieved using an SPE, as detailed in Section 3. Borealis is a second generation distributed SPE. Other prototypes have been developed in the context of TelegraphCQ [5] and STREAM [3] projects. Gigascope [7] is a system which uses an SPE tailored for high speed network monitoring. Although reported results are promising, Gigascope is a proprietary (AT&T’s) commercial product. Motivated by the possibility of developing an open source SPE for traffic monitoring, the authors of [14] describe a case study using TelegraphCQ SPE [5]. It involved a functionality analysis to determine whether the SPE can be used to provide the same metrics of T-RAT, a tool developed for analyzing TCP packet traces. The results obtained in terms of traffic volume were modest, but it can be considered a seminal work, in which a single centralized SPE is applied for network management. MaD-WiSe [2] is a distributed monitoring system for managing data streams generated by wireless sensor networks. Our previous work, PaQueT [11], has been proposed to monitor a single network segment, generating packet level metrics. Moreover, PaQueT has not been designed as a distributed system in which modules with specific functionalities can be spread over a wide area network. Some of the main features of BackStreamDB include the following: it allows data gathering from multiple data sources and features distributed processing at multiple nodes. It is also based on an architecture with separate modules for data acquisition and query result treatment, and is able to process data in Netflow format, considering the whole backbone.
5
Conclusion
In this paper we proposed an architecture for real time backbone traffic monitoring that provides arbitrary measurements about individual segments or the backbone as a whole. The strategy is based on both flow protocols and stream processing engines and does not require traffic logs to be stored. The distributed nature of the proposed system is scalable as depending on the amount of traffic, more nodes can be deployed for monitoring tasks. BackStreamDB is an implementation of the proposed strategy, based on Borealis SPE and Netflow. BackStreamDB was deployed and validated on the Brazilian national RNP backbone. An experimental study involving both synthetic as well as real traffic shows that the approach is feasible and dependable, generating consistent results in both settings. BackStreamDB was able to process a workload of one million Netflow records of real traffic in intervals of five minutes. To highlight the system functionality in order to show how it can help network administrators to fulfill their tasks, case studies were presented for computing a traffic matrix, and detecting traffic signatures. We are currently developing a version of BackStreamDB to be a service provider in the PerfSONAR framework [9], a service-oriented architecture for multi-domain network monitoring.
Acknowledgments. We thank the Brazilian National Research Network, RNP, for supporting the deployment of the proposed system through Working Group GT-BackStreamDB. This work was partially supported by grant 304013/2009-9 from the Brazilian Research Agency (CNPq).
References 1. Abadi, D.J., Ahmad, Y., Balazinska, M., C ¸ entintemel, U., Cherniack, M., Hwang, J.H., Lindner, W., Maskey, A.S., Rasin, A., Ryvkina, E., Tatbul, N., Xing, Y., Zdonik, S.: The Design of the Borealis Stream Processing Engine. In: Proc. of the Conf. on Innovative Data Systems Research. pp. 277–289 (2005) 2. Amato, G., Chessa, S., Vairo, C.: MaD-WiSe: A Distributed Stream Management System for Wireless Sensor Networks. Software Practice and Experience 40(5), 431451 (2010) 3. Arasu, A., Babcock, B., Babu, S., Cieslewicz, J., Datar, M., Ito, K., Motwani, R., Srivastava, U., Widom, J.: STREAM: The Stanford Data Stream Management System. IEEE Data Engineering Bulletin 26(1), 19–26 (2003) 4. Bin, L., Chuang, L., Jian, Q., Jianping, H., Ungsunan, P.: A NetFlow-based Flow Analisys and Monitoring System in Enterprise Networks. Computer Networks 52(5), 1074–1092 (2008) 5. Chandrasekaran, S., Cooper, O., Deshpande, A., Franklin, M.J., Hellerstein, J.M., Hong, W., Krishnamurthy, S., Madden, S., Raman, V., Reiss, F., Shah, M.: TelegraphCQ: Continuous Dataflow Processing for an Uncertain World. In: Proc. of the Conf. on Innovative Data Systems Research (2003) 6. Cottrell, L.: Network Monitoring Tools. http://www.slac.stanford.edu/xorg/ nmtf/nmtf-tools.html (2011) 7. Cranor, C., Johnson, T., Spataschek, O.: Gigascope: A Stream Database for Network Applications. In: Proc. of the ACM SIGMOD Int. Conf. on Management of Data Conference. pp. 647–651 (2003) 8. Dubendorfer, T., Wagner, A., Plattner, B.: A Framework for Real-Time Worm Attack Detection and Backbone Monitoring. In: Proc. of the IEEE Int. Workshop on Critical Infrastructure Protection. pp. 3–12 (2005) 9. Hanemann, A., W., J., Boyd, E.L., Durand, J., Kudarimoti, L., Lapacz, R., Swany, D.M., Zurawski, J., Trocha, S.: PerfSONAR: A service oriented architecture for multi-domain network monitoring. In: Proc. of the Int.Conf. on Service Oriented Computing - LNCS 3826. pp. 291–304 (2005) 10. Koudas, N., Srivastava, D.: Data Stream Query Processing: A Tutorial. In: Proc. of the Int. Conf. on Very Large Data Bases. p. 1149 (2003) 11. Ligocki, N., Gomes, C.L., Hara, C.: A Flexible Network Monitoring Tool based on a Data Stream Management System. In: Proc. of the IEEE Symp. on Computers and Communications. pp. 800–805 (2008) 12. Munz, G., Carle, G.: Distributed Network Analysis Using TOPAS and Wireshark. In: Network Operations and Management Symp. Workshops. pp. 161–164 (2008) 13. Phaal, P., Panchen, S., McKee, N.: RFC 3176: InMon Corporation’s sFlow: A Method for Monitoring Traffic in Switched and Routed Networks (2001) 14. Plagemann, T., Goebel, V., Bergamini, A., Tolu, G., Urvoy-Keller, G., Biersack, E.W.: Using Data Stream Management Systems for Traffic Analysis - A Case Study. In: Proc. of the Int. Workshop on Passive and Active Network Measurement. pp. 215–226 (2004) 15. Zhou, A., Yan, Y., Gong, X., Chang, J., Dai, D.: SMART: A System for Online Monitoring Large Volumes of Network Traffic. In: Proc. of the IEEE Int. Conf. on Data Engineering. pp. 1576–1579 (2008)