Motivation Microeconomics Logic What is BackTesting? Significance region VaR and ES calculation Conclusions
BackTesting Expected Shortfall: An Application to Emerging Market Stock Indices Andres Mora Valencia
1
Daniel Vel´asquez Gaviria
1 Universidad de Los Andes
[email protected] 2 Universidad EAFIT
[email protected]
27 July, 2017 Cagliari, Sardegna, Italy World Finance Conference
Backtesting Expected Shortfall
2
1
Motivation VaR vs ES dilemma
2
Microeconomics Logic Capital Reserves for Market Risk Consequences of the New Regulation
3
What is BackTesting? Acerbi and Sz´ekely (2014, 2017) Backtesting Tests
4
Significance region Monterlo Carlo Simulation
5
VaR and ES calculation VaR and ES calculation
6
Conclusions
Motivation Microeconomics Logic What is BackTesting? Significance region VaR and ES calculation Conclusions
VaR vs ES dilemma
VaR: The best of worst x% losses. Is a threshold of x% ES: The avergae of x% worst losses. Is the expected x% loss
World Finance Conference
Backtesting Expected Shortfall
Motivation Microeconomics Logic What is BackTesting? Significance region VaR and ES calculation Conclusions
VaR vs ES dilemma
VaR is not coherent, problems with fat tails in P&L ES multiple advantages: Tail sensitivity, subadditivity, mathematical tractability, uniqueness. BUT ES is not elicitable, Gneiting (2011). ES Can not be BackTested Embrechts et al, (2014); Carver (2013) Basel roadblock for ES, there is no general consensus about the BackTesting
World Finance Conference
Backtesting Expected Shortfall
Motivation Microeconomics Logic What is BackTesting? Significance region VaR and ES calculation Conclusions
VaR vs ES dilemma
A little history 1994: RiskMetrics Technical Document popularizes “Value at Risk” (VaR) 1996: Basel Committee internal-based approach to capital adequacy, based on VaR 1997: Artzner criticized VaR because is not a Coherent risk Measure 2001: Rockafellar and Uryasev, Acerbi and Tasche, define Expected Shortfall (aka CVaR), a coherent measure of risk 2000: VaR and ES are widely adopted by financial institutions as complementary tools 2011: Gneiting, ES is not elicitable 2013: Basel Committe replaces VaR-1% y ES-2.5%, “Fundamental review of the trading book, a revised market risk framework” World Finance Conference
Backtesting Expected Shortfall
Motivation Microeconomics Logic What is BackTesting? Significance region VaR and ES calculation Conclusions
VaR vs ES dilemma
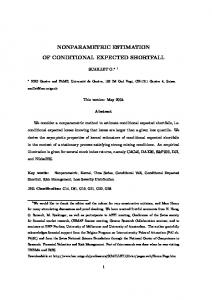
Changes in market risk framework, Basel Committee 2013
World Finance Conference
Backtesting Expected Shortfall
Motivation Microeconomics Logic What is BackTesting? Significance region VaR and ES calculation Conclusions
World Finance Conference
Capital Reserves for Market Risk Consequences of the New Regulation
Backtesting Expected Shortfall
Motivation Microeconomics Logic What is BackTesting? Significance region VaR and ES calculation Conclusions
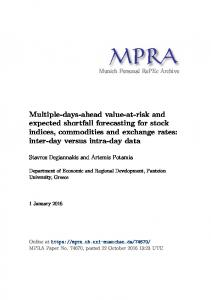
Capital Reserves for Market Risk Consequences of the New Regulation
Skew-t Distribution
World Finance Conference
Backtesting Expected Shortfall
Motivation Microeconomics Logic What is BackTesting? Significance region VaR and ES calculation Conclusions
Acerbi and Sz´ ekely (2014, 2017) Backtesting Tests
Backtesting means checking whether realizations were in line with model forecasts Base VaR BackTest is based on the Coverage Test since 1996.(Basel VaR Backtest: Traffic Light System) ES cannot be backtested because it fails to satisfy elicitability ... If you held a gun to my head and said: ”We have to decide by the end of the day if Basel 3.5 should move to ES, with everything we know now, or do we stick with VaR”, I would say: ”Stick with VaR” (Paul Embrechts, March 2013, RISK.net)
World Finance Conference
Backtesting Expected Shortfall
Motivation Microeconomics Logic What is BackTesting? Significance region VaR and ES calculation Conclusions
Acerbi and Sz´ ekely (2014, 2017) Backtesting Tests
They introduce 4 Test to BackTest ES the ES BackTesting will need more information (P&L distribution each day) than VaR BackTesting, but this problem Will be overshadowed by the increase in the statistical power of the tests. VaR Violations: Bernoulli process ( 1 rt < VaRt It = 0 rt > VaRt ES test Z1 =
T X t=1
It Xt −1 T αES1−α,t
World Finance Conference
Backtesting Expected Shortfall
Motivation Microeconomics Logic What is BackTesting? Significance region VaR and ES calculation Conclusions
Acerbi and Sz´ ekely (2014, 2017) Backtesting Tests
Scenarios Analysis
World Finance Conference
Backtesting Expected Shortfall
Motivation Microeconomics Logic What is BackTesting? Significance region VaR and ES calculation Conclusions
Acerbi and Sz´ ekely (2014, 2017) Backtesting Tests
Settings We look at ES from a regulatory point of view Profit-loss: independent Xt ∼ Ft Pt ∼ F t Normal, t-Student and skew-t Predictive and real but unknown distributions VaR and ES are calculated with regulatory levels. α = 0.01, β = 0.025 World Finance Conference
Backtesting Expected Shortfall
Motivation Microeconomics Logic What is BackTesting? Significance region VaR and ES calculation Conclusions
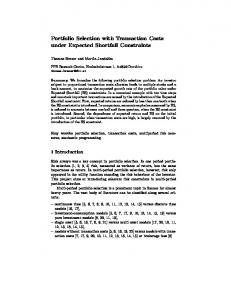
Monterlo Carlo Simulation
Test’s Significance Threshold
World Finance Conference
Backtesting Expected Shortfall
Motivation Microeconomics Logic What is BackTesting? Significance region VaR and ES calculation Conclusions
VaR and ES calculation
VaRα = −P −1 (α); ESβ = −
1 β
Z
β
P −1 (q)dq
0
We use an ARMA-GARCH process with Normal, t-Student and skew-t innovations Estimating the parameters in 500 days rolling window We employ daily stock index returns from the Morgan Stanley Capital International Inc. Emerging Markets Index comprising the 2000 – 2015 period. (Why?)
World Finance Conference
Backtesting Expected Shortfall
Motivation Microeconomics Logic What is BackTesting? Significance region VaR and ES calculation Conclusions
Conclusions
This study implements very well-known backtesting methods for VaR and two methods for ES, recently proposed in the literature (Acerbi and Sz´ekely, 2014) and applied to emerging market stock indices. We compare the performance of three distributions: normal, Student’s t and skewed-t for emerging market stock index logreturns. For the latter distribution, the significance thresholds have been derived for the two ES tests in this paper.
World Finance Conference
Backtesting Expected Shortfall
Motivation Microeconomics Logic What is BackTesting? Significance region VaR and ES calculation Conclusions
The test results show that Gaussian distribution performs well in pre-crisis periods only. Whereas Student’s t and skewed-t work well throughout the whole sample, including pre-crisis and crisis periods as expected. As a consequence of switching 99%-VaR to 97.5%-ES, a slight relative change is noticed under the same distribution. However, the relative variation between using a Gaussian distribution and a heavy-tailed distribution can be significant in calculating expected shortfall.
World Finance Conference
Backtesting Expected Shortfall
Motivation Microeconomics Logic What is BackTesting? Significance region VaR and ES calculation Conclusions
Further Investigation
Future research will focus on comparing other ES backtesting methods, for instance the one proposed in Fissler and Ziegel (2016), and other risk measures such as median shortfall and expectiles.
World Finance Conference
Backtesting Expected Shortfall
Motivation Microeconomics Logic What is BackTesting? Significance region VaR and ES calculation Conclusions
Thanks for this great opportunity !!
World Finance Conference
Backtesting Expected Shortfall