Backtesting Expected Shortfall Carlo Acerbi Balazs Szekely January 21, 2015 . Outline The VaR vs ES Dilemma Elicitability Three Tests for ES
Backtesting Expected Shortfall Carlo Acerbi Balazs Szekely January 21, 2015
©2015 MSCI Inc. All rights reserved.
Outline
The VaR vs ES Dilemma Elicitability Three Tests for ES Numerical Results Testing ES in Practice Back to Elicitability Conclusions
2
The VaR or ES Dilemma The Importance of Backtest
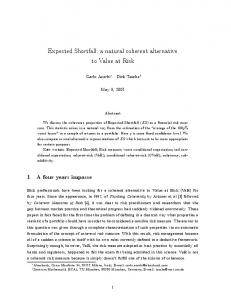
VaR and ES VaR: the best of worst x% losses; losses ES: the average of worst x% losses
→ threshold of x%
→ expected x% loss
Profit and Loss Distribution
ES VaR
ES multiple advantages: tail sensitivity, subadditivity (→ coherent), mathematical tractability, uniqueness, uses same risk models … Last roadblock for ES toward Basel: backtesting As of Oct13, no general consensus ES backtest
4
Basel: VaR or ES? 1994: RiskMetrics Technical Document popularizes “Value at Risk” (VaR) 1996: Basel Committee internal-based approach to capital adequacy, based on VaR 1997: Artzner et al. “Coherent Measures of Risk”: axioms for sensible risk measures. VaR criticized for not complying 2001: Rockafellar and Uryasev, Acerbi and Tasche, define “Expected Shortfall” (ES, aka CVaR), a coherent measure of risk 2000s VaR and ES are widely adopted by financial institutions as complementary tools 2013: Basel Committee replaces VaR1% with ES2.5% VaR is maintained for model backtesting
5
Backtesting in a Nutshell predicted
predicted
predicted
predicted
realized realized
realized
t
t+1 realized
Backtesting means checking whether realizations were in line with model forecasts However, distributions (and statistics) do not materialize Only one scenario at a time does
Not all risk measures can be backtested And it is not easy to say which ones can
Opposite examples VaR: just test whether losses exceed VaR x% of the times (model independent!) Mode: probably impossible to backtest 6
Basel VaR Backtest: Null and Alternative Hypotheses 𝐻0
𝐻1
“Fundamental review of the trading book, a revised market risk framework”, Basel Committee 2013 7
Basel VaR Backtest: Traffic Light System
Same mechanism since 1996
8
Time Independence
Conditional coverage tests (Christoffersen ‘98) However, in practice, independence of arrival of VaR exceptions is normally tested through visual inspection 9
Why so Difficult with ES? Backtesting ES is less immediate “How can I backtest ES, if it’s the average of the x% worst cases, but life is a single scenario only?” It sounds like we need multiple scenarios to compute a realized ES
As a matter of fact, literature on backtesting ES is scarce and fragmentary Only one proposed model-independent ES backtest (Kerkhof and Melenberg 2004)
Legitimate doubt: is ES backtestable at all? A recent result (Gneiting 2011) seemed to have proven that it is not
10
Elicitability
Eliciwhat? A statistic 𝑌 is said to be elicitable if it solves 𝑌 = arg min 𝔼 𝑆(𝑦, 𝑋) 𝑦
for some scoring function 𝑆 𝑦, 𝑥 Popular examples: Mean:
𝑦 = arg min 𝔼 (𝑦 − 𝑋)2
Median:
𝑦 = arg min 𝔼 𝑦 − 𝑋
𝛼-quantile:
𝑞𝛼 = arg min 𝔼 (𝑋 − 𝑞)(𝛼 − (𝑋 − 𝑞 < 0))
𝑦 𝑦
𝑞
→ VaR !
If a statistic 𝑌 is elicitable, given forecasts 𝑦𝑡 and realizations 𝑥𝑡 the mean score 1 𝑆= 𝑇
𝑇
𝑆 𝑦𝑡 , 𝑥𝑡 𝑡=1
ranks predictive models: the lower the better Natural test: think of mean squared errors, for instance 12
ES is not Elicitable Gneiting 2011 proves that there is no 𝑆 𝑦, 𝑥 that elicits ES Many risk experts concluded that ES cannot be backtested ES cannot be backtested because it fails to satisfy elicitability ... If you held a gun to my head and said: ‘We have to decide by the end of the day if Basel 3.5 should move to ES, with everything we know now, or do we stick with VaR’, I would say: ‘Stick with VaR’ (Paul Embrechts, March 2013, RISK.net)
Criticism followed the announced choice of the Basel Committee to adopt ES Are there risk measures which are both coherent and elicitable? Yes, expectiles (Ziegel, 2013, Bellini et al. 2014) Explosion of interest for these measures
13
Something is not Quite Right If non-elicitable means non-backtestable Why has VaR never been backtested by exploiting its elicitability? The exceptions test has nothing to do with scoring functions
How about variance? It’s not elicitable either! Should we drop it as well? And what about Kerkhof and Melenberg 2004? “…contrary to common belief, ES is not harder to backtest than VaR... Furthermore, the power of the test for ES is considerably higher”
We will answer all of these questions
14
Three Tests for Expected Shortfall
Model Independent Setting Basel choices: 1 year lookback window: 𝑡 = 1, … 𝑇 = 250 𝑉𝑎𝑅1% and 𝐸𝑆2.5%
Independent (not iid) Profit-loss 𝑋𝑡 𝐹𝑡 real (unknown) distribution 𝑃𝑡 forecast (model) distribution
Only assumption: continuous distributions → we can write:
𝐸𝑆𝛼,𝑡 = −𝔼 𝑋𝑡 𝑋𝑡 + 𝑉𝑎𝑅𝛼,𝑡 < 0]
Standard hypothesis testing framework (the below is generic) 𝐻0 :
𝐹𝑡 = 𝑃𝑡
null: model is perfect
𝐻1 :
𝐹 𝑃 𝐸𝑆𝛼,𝑡 > 𝐸𝑆𝛼,𝑡
alternative: ES underestimated (one sided test)
Proposed tests must be model-independent No distribution families, no location-scale, no asymptotic convergence, …
16
Test 1: Testing ES After VaR 𝔼
From
𝑋𝑡 𝐸𝑆𝛼,𝑡
𝑋𝑡 + 𝑉𝑎𝑅𝛼,𝑡 < 0 + 1 = 0
𝑍1 𝑋 =
Define
𝑇 𝑋𝑡 𝐼𝑡 𝑡=1𝐸𝑆 𝛼,𝑡 𝑇 𝐼 𝑡=1 𝑡
+1
where 𝐼𝑡 = 𝟏{𝑋𝑡+𝑉𝑎𝑅𝛼,𝑡 1
24
𝐻0 : Student-t, 𝜈 = 100; 𝐻1: Scaled Distributions
25
𝐻0 : Student-t, 𝜈 = 100; 𝐻1: Scaled Distributions
26
𝐻0 : Student-t, 𝜈 = 5; 𝐻1: Scaled Distributions
27
𝐻0 : Student-t; 𝐻1: ES Coverage 95%, 90% 𝐻0 : 𝐹𝑡 = 𝑃𝑡 , Student-t distributions 𝐻1 : 𝐹𝑡 (𝑥) = 𝑃𝑡 (𝑥/ 𝛾), scaled distribution, 𝛾 > 1, but labeled in terms of ES coverage 𝐸𝑆𝛼𝑃 = 𝐸𝑆𝛼𝐹′ with 𝛼 = 2,5% and 𝛼 ′ = 5%, 10% Analogous to the Basel VaR coverage tables
28
𝐻0 : Student-t , 𝜈 = 100; 𝐻1: ES Coverage 95%, 90%
29
𝐻0 : Student-t , 𝜈 = 5; 𝐻1: ES Coverage 95%, 90%
30
𝐻0 : Student-t , 𝜈 = 100; 𝐻1: 𝜈 = 10, 5, 3 𝐻0 : 𝐹𝑡 = 𝑃𝑡 , Student-t distributions 𝐻1 : Student-t distributions with lower 𝜈 Notice that standard deviation is also larger 𝜎 =
31
𝜈/(𝜈 − 2)
𝐻0 : Student-t , 𝜈 = 100; 𝐻1: 𝜈 = 10, 5, 3
32
𝐻0 : Student-t , 𝜈 = 100; 𝐻1: 𝜈 = 10, 5, 3
33
𝐻0 : Student-t , 𝜈 = 10; 𝐻1: 𝜈 = 5, 3
34
𝐻0 : Normalized Student-t , 𝜈 = 100; 𝐻1: 𝜈 = 10, 5, 3 𝐻0 : 𝐹𝑡 = 𝑃𝑡 , Normalized Student-t distributions with 𝜎 = 1 𝐻1 : Normalized Student-t distributions with lower 𝜈 and 𝜎 = 1
35
𝐻0 : Normalized Student-t , 𝜈 = 100; 𝐻1: 𝜈 = 10, 5, 3
36
𝐻0 : Normalized Student-t , 𝜈 = 100; 𝐻1: 𝜈 = 10, 5, 3
37
𝐻0 : Normalized Student-t , 𝜈 = 10; 𝐻1: 𝜈 = 5, 3
38
𝐻0 : Normalized Student-t ; 𝐻1: fixed VaR2.5%
𝐻0 : 𝐹𝑡 = 𝑃𝑡 , Normalized Student-t distributions with 𝜎 = 1 𝐻1 : Normalized Student-t distributions with lower 𝜈 and 𝜎 = 1 Distributions offset so that they have equal VaR2.5% Alternative hypotheses built to analyze Test 1
39
𝐻0 : Norm. Student-t 𝜈 = 100; 𝐻1: fixed VaR2.5%
40
𝐻0 : Norm. Student-t 𝜈 = 100; 𝐻1: fixed VaR2.5%
41
𝐻0 : Norm. Student-t 𝜈 = 10; 𝐻1: fixed VaR2.5%
42
Summary of Results All tests for ES 2.5% generally display more power than the Basel test for VaR 1% in identical conditions Test 1 is subordinated to testing VaR first, but has strong power for model misspecifications in the tail index Test 2 and test 3 excel in different cases: test 2 is more powerful on scaled distributions; test 3 is more powerful on distributions with different tail index
43
Testing ES in Practice Implementing Test 2
Implementing Test 2 Test 2 can be adopted without storing forecast distributions 95% and 99.99% significance level thresholds are fixed values 𝑍2 = −0.70 and 𝑍2 = −1.8
Every day, it is sufficient to record the quantities 𝑋𝑡 𝐼𝑡 :
magnitude of exceptions, or zero
𝐸𝑆𝑡 :
predicted ES
The graph
𝑠↦
𝑋𝑡 𝐼𝑡 𝑠 𝑡=1 𝑇 𝛼 𝐸𝑆
𝛼,𝑡
+
𝑠 𝑇
for 𝑠 = 1, … , 𝑇 allows us to
visualize the time evolution of the contributions to the final 𝑍2 and check time independence
45
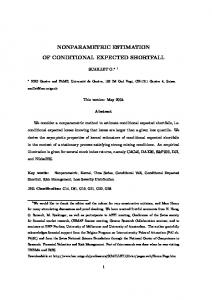
𝑍2 Past History (of a Poor Risk Model) Z stat (ES) Z stat (VaR) Critical values (ES) Critical values (VaR) jpmembig/hist1y - confidence level: 97.5% 1
Backtest stats (rolling window)
0.5
0
-0.5
-1
-1.5
-2
-2.5
Oct13
Jan14
Apr14
46
Jul14
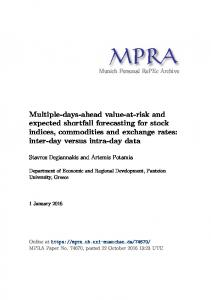
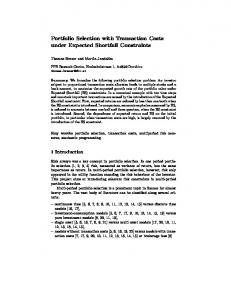
𝑍2 Is Not Rejected (But Some Exceptions Cluster) P&L - jpmembig/hist1y - confidence level: 97.5%
Return [%]
2 VaR bands ES bands
0 -2 -4
Jul13
Oct13
Jan14
Apr14
Contribution to ZES statistic 0.2 0 -0.2 -0.4 -0.6
Jul13
Oct13
Jan14
Apr14
Cumulative contribution to ZES statistic 1 0 -1 -2
Jul13
Oct13
Jan14
47
Apr14
𝑍2 Too High – Risk Overestimation P&L - jpmembig/hist1y - confidence level: 97.5%
Return [%]
2 VaR bands ES bands
1 0 -1 -2
Oct13
Jan14
Apr14
Jul14
Contribution to ZES statistic 0.05 0 -0.05 -0.1 -0.15
Oct13
Jan14
Apr14
Jul14
Cumulative contribution to ZES statistic 1 0 -1 -2
Oct13
Jan14
Apr14
48
Jul14
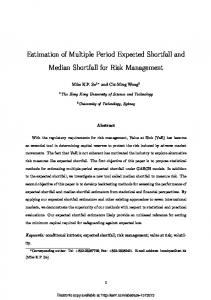
𝑍2 Far Too Low – Model failure P&L - jpmembig/hist1y - confidence level: 97.5%
Return [%]
2 VaR bands ES bands
0 -2 -4
Feb13
May13
Aug13
Nov13
Contribution to ZES statistic 0.2 0 -0.2 -0.4 -0.6
Feb13
May13
Aug13
Nov13
Cumulative contribution to ZES statistic 1 0 -1 -2 -3
Feb13
May13
Aug13
49
Nov13
Back to Elicitability Where Is The Catch?
Elicitable ≠ Backtestable We have shown that ES can be backtested without being elicitable Therefore backtestable ⇒ elicitable We are tempted to conclude that elicitability is not the only way to backtest
backtestable elicitable
VaR
Actually, there is even more…
51
ES
Elicitability: Model Selection, Not Model Testing If a measure is elicitable, we can rank models by their mean score However, this is a relative, not an absolute scale A mean score alone doesn’t tell us anything about the validity of a single model
A mean score allows to choose the best model among several ones which forecast the same random process Ex: Bank A has three VaR forecast models and runs a contest to select the best one → Model selection
Statistical test instead provides a validation with absolute significance Ex: Bank A wants to validate the model Ex: Regulators want to compare models of Banks A, B, C, …Z against the same scale → Model testing (a.k.a. validation)
This key observation has been completely overlooked so far in the public debate
52
Elicitability Has Nothing To Do with Backtestability So, in reality the situation is as follows: Elicitability is irrelevant for model testing!
Mode
backtestable elicitable
ES
VaR
As a matter of fact, the Mode is elicitable It is not by chance that VaR is not backtested via elicitability 53
By the Way, ES is Elicitable (at Least in Practice) A way to see why ES is not elicitable is to realize that there is no expression like 𝔼 𝐿 𝑋, 𝐸𝑆 = 0 If that were the case, we could interpret 𝜕𝑆 𝑋, 𝑒 𝐿 𝑋, 𝐸𝑆 = 𝜕𝑒 𝑒=𝐸𝑆
and build a scoring function 𝑆 However, there do exist null expectations involving both ES and VaR 𝔼 (𝑋 + 𝐸𝑆)(𝑋 + 𝑉𝑎𝑅 < 0) = 0 𝔼 𝑋 𝑋 + 𝑉𝑎𝑅 < 0 + 𝛼𝐸𝑆 = 0
54
By the Way, ES is Elicitable (at Least in Practice) It is (tedious but) straightforward to build a scoring function 𝑆𝑊
𝛼𝑒 2 𝑊𝛼𝑣 2 𝑊 𝑥2 − 𝑣2 𝑣, 𝑒, 𝑥 = + − 𝛼𝑒𝑣 + 𝑒 𝑣 + 𝑥 + 2 2 2
(𝑥 + 𝑣 < 0)
which jointly elicits ES and VaR if 𝐸𝑆 < 𝑊 𝑉𝑎𝑅, for a chosen 𝑊 ∈ ℝ 𝑉𝑎𝑅, 𝐸𝑆 = arg min 𝔼 𝑆 𝑊 (𝑣, 𝑒, 𝑋) 𝑣,𝑒
Some 𝑊 ∼ 2 will do for any concrete application Perfectly analogous to the variance, which is elicitable only jointly with the mean (Lambert et al. 2008) … we do not know any 𝔼 𝐿 𝑋, 𝑣𝑎𝑟𝑖𝑎𝑛𝑐𝑒
55
=0
Model Selection via ES-VaR Elicitability Example of elicitability contest for different Riskmetrics models on different test portfolios Data: RiskMetrics Year in Review 2014
56
On Davis’ Consistency Davis (2014): a risk measure 𝑋 is consistent if we can write 1 𝑛→∞ 𝑏𝑛
lim
𝑛 𝑖=1
𝑙(𝑋𝑖 , 𝑌𝑖 ) = 0 a.s.
where 𝑋𝑖 and 𝑌𝑖 are model predictions for the price process and for the risk measure respectively and 𝑏𝑛 is a suitable divergent sequence 𝑙 is called a calibration function Also in this case, if we extend the notion of consistency to vector statistics , we can prove it for 𝑌 = (𝐸𝑆, 𝑉𝑎𝑅) choosing 𝑏𝑛 = 𝑛
𝑙 𝑋, 𝐸𝑆, 𝑉𝑎𝑅 =
𝑋(𝑋+𝑉𝑎𝑅