... the two materials (between the. Fermi level of the metal and the valence-band edge of the ..... thermodynamic and kinetic factors in the formation of the interface. ...... [19] Cohen M L 1985 Int. School of Physics 'Enrico Fermi'. (Course LXXXIX ...
J. Phys. D: Appl. Phys. 31 (1998) 1273–1299. Printed in the UK
PII: S0022-3727(98)68953-1
REVIEW ARTICLE
Band engineering at interfaces: theory and numerical experiments M Peressi†, N Binggeli‡ and A Baldereschi†‡ † Istituto Nazionale di Fisica della Materia (INFM), Dipartimento di Fisica Teorica dell’Universita` di Trieste, Strada Costiera 11, I-34014 Trieste, Italy ´ Ecole Polytechnique Fed ´ erale ´ ‡ Institut de Physique Appliquee, de Lausanne, PHB-Ecublens, CH-1015 Lausanne, Switzerland Received 17 March 1997, in final form 14 November 1997 Abstract. Understanding the mechanisms which determine the band offsets and Schottky barriers at semiconductor contacts and engineering them for specific device applications are important theoretical and technological challenges. In this review, we present a theoretical approach to the band-line-up problem and discuss its application to prototypical systems. The emphasis is on ab initio computations and on theoretical models derived from first-principles numerical experiments. An approach based on linear-response-theory concepts allows a general description of the band alignment for various classes of semiconductor contacts and predicts the effects of various bulk and interfacial perturbations on the band discontinuities.
1. Introduction Semiconductor–semiconductor and metal–semiconductor interfaces play a crucial role in modern electronic and optoelectronic devices. The transport properties in heterojunction devices are controlled by the electronic band profiles at the interfaces, more specifically by the valence and conduction discontinuities that accommodate the difference in bandgap between the materials, namely, the valence and conduction band offsets (VBO and CBO) in the case of semiconductor heterojunctions and the p- and n-type Schottky barriers (φp and φn ) in the case of metal– semiconductor contacts (see figure 1). Extensive theoretical and experimental work has targetted the problem of the interface band alignment [1–8]. However, it is only in the last decade that the physical mechanisms which give rise to the band alignment at semiconductor heterojunctions have begun to be revealed [1–4] and that the connection between band offsets and Schottky barriers has been put on a firmer basis [1, 2, 9, 10]. Today we are still far from a complete understanding of the factors which control the band alignment, especially in the case of Schottky barriers. It is not our purpose to give a general overview on this broad subject. Many review articles and books already exist. In particular, a good introduction to the problem of semiconductor–semiconductor interfaces and a review both of experimental and of theoretical work can be found in the book edited by Capasso and Margaritondo [1]. Fundamental papers on this subject are collected in the book edited by Margaritondo [2]. More recently, a c 1998 IOP Publishing Ltd 0022-3727/98/111273+27$19.50
review article by Yu et al appeared [3]. For an extensive review on the problem of band offset engineering, we address the reader to the work by Franciosi and Van de Walle [4]. For an introduction and a review on the problem of Schottky barriers we refer the reader to the book by Rhoderick and Williams [5] and to the book edited by M¨onch, which contains fundamental papers on the physics of metal–semiconductor contacts [6]. A good review of the experimental situation in the field of semiconductor– semiconductor and metal–semiconductor interfaces can be found in the article by Brillson [7]. Finally, a recent assessment of the fundamental and technological knowledge on metal–semiconductor contacts is given in the book edited by Brillson [8]. An important and general issue, which has been widely debated in the literature, is that of whether the band discontinuities are essentially determined by the bulk properties of the constituents, or whether some interfacespecific phenomena may affect them in a significant way. In the latter case, the control of the interfaces could provide a way to manipulate the band line-ups and tune the transport properties across the junctions. In semiconductor technology, one of the most important and widely used features has been the possibility of intentionally varying the electronic properties by alloying and doping. For semiconductor contacts a similarly important challenge is to control and modify artificially the band offsets and Schottky barriers. We present here a theoretical approach to the problem. Theoretical investigations of the band-line-up problem can be divided mainly into two classes: (i) fully self-consistent 1273
M Peressi et al
Figure 1. Schematic diagrams of the band structures of semiconductor–semiconductor (a) and semiconductor–metal (b) junctions, as a function of the position along the growth direction. Definitions of band offsets (VBO and CBO) and of Schottky barriers (φn and φp ) are shown. Flat bands were represented, because we are focusing on a region which is of the order of 10 atomic units and the band bending is negligible at this scale.
ab initio calculations, which provide the electronic charge distribution at the interface and allow one to study the importance of interface details, such as orientation, abruptness and defects; and (ii) theories other than ab initio calculations, which can be described as ‘model’ theories, in that they make simplifying and sometimes drastic approximations in describing the interface, but have the advantage of being easier to implement. The work we present here is in the framework of the ab initio approach. First, we describe a state-of-the-art ab initio method employed for the study of interfaces (section 2). We then show (section 3) that an original approach based on linear response theory (LRT) concepts [11–13] underlies and explains a general trend of semiconductor–semiconductor interfaces: at lattice-matched isovalent heterojunctions the band offset depends only on the bulk properties of the two materials, whereas at heterovalent heterojunctions it crucially depends on the interface orientation and other microscopic details. However, once the atomic structure is known—either experimentally or theoretically by totalenergy minimization—the structure-dependent contribution to the band offset can be rigorously calculated from elementary electrostatics. Strain effects and the application of linear-response schemes to lattice-mismatched semiconductor heterojunctions are discussed in section 4. In section 5, we focus on epitaxial metal–semiconductor contacts and examine the link between Schottky barriers and band offsets. In particular, we illustrate how Schottky barrier trends observed in some epitaxial systems can be explained by extending to metal–semiconductor interfaces linear-response-theory concepts used in the study of band offsets. The possibility of artificially modifying band offsets and Schottky barriers is discussed in sections 6 and 7. We first discuss changes in band discontinuities produced by alterations of the bulk chemical and structural properties of the materials forming the junctions. We then look for interface-specific effects that may modify the interface dipole and thus change the line-up of the electronic states across the junctions. 1274
2. The computational approach 2.1. First-principles self-consistent calculations It is possible nowadays to study the energetics and the electronic structure of many-electron systems by performing fully ab initio computations, that is, by solving the quantum-mechanical equations for the system under consideration without any use of empirical parameters, for a meaningful comparison with experiment or even for accurate predictions of quantities not yet accessible experimentally. Among the existing ab initio schemes, the local-density approximation (LDA) to density-functional theory (DFT) [14, 15] has proven to yield reliable results, at an acceptable computational cost, on the electronic ground-state properties of complex crystalline systems [16–19]. Within DFT, the many-body problem of interacting electrons is reduced to a system of singleparticle Schr¨odinger equations [15], which must be solved self-consistently (SCF, for self-consistent-field). Electron– electron interactions are fully included by adding to the Hartree potential an exchange-correlation term, which is a functional of the charge density. In the LDA, this functional [15] is reduced to a function of the local charge density which has been calculated accurately and interpolated using a parametrized form [20]. The work on interfaces that we will illustrate in the following sections is based on the pseudopotential method, which is an efficient approach, within the LDA-SCF framework, for dealing with semiconductors and metals of practical interest for electronic devices. In the pseudopotential approach only the valence electrons, which are responsible for the formation of the chemical bonds and determine the relevant physical properties, are explicitly treated. The pseudopotential—derived from LDA-SCF calculations for the isolated atom with an all-electron technique—describes the effects of the nucleus and of the core electrons on the valence electronic states [21]. For periodic solids, a plane-wave basis set is generally used to
Band engineering at interfaces
expand the single-particle electronic orbitals. Plane waves up to a certain kinetic energy cut-off are included in the basis set, whose size is one of the ingredients determining the accuracy of the calculations. The choice of a plane-wave basis set allows for a convenient reciprocal space formulation and a straightforward evaluation of the total energy of the system, as well as the forces on the atoms and the macroscopic stresses [22]. These quantities can then be used to relax the atomic structure, allowing one to determine the equilibrium structural parameters of a bulk crystal or optimize the interface geometries in a complex superlattice. Integrals over the Brillouin zone (BZ), which are necessary in order to determine quantities such as the charge density, are performed by discrete summation over a set of special k points [23]. Such sets of k points are representative of a uniform grid covering the BZ, whose density is also an ingredient which determines the accuracy of the calculations. For metallic systems an electronic level broadening scheme is generally used to improve the convergence with respect to the k-point sampling [24]. A numerical uncertainty of a few milli-electronvolts can be typically achieved in LDA-SCF calculations of the band line-ups by controlling the convergence with respect to several parameters such as the number of plane waves in the basis set, the k points used and the size of the supercell describing the junction [13]. Other sources of uncertainty are the choice of the pseudopotentials and the resulting lattice parameters used in the calculations [12]; the global numerical uncertainty in the band alignments can be estimated to be of the order of 20-30 meV for fully converged calculations. We would like to point out that, in principle, the single-particle eigenvalues obtained from the LDA-SCF calculations and used to evaluate the bulk band structures and the interface line-ups, are not quasi-particle energies and should be corrected for many-body effects [25–27] which are much larger, in general, than the numerical uncertainty of the LDA-SCF values. Since these corrections are normally much less important for the valence bands than they are for the conduction bands in semiconductors (typically less than 0.3 eV for the valence-band edge and of the order of 1 eV for the conduction-band edge [25, 27]), it is convenient to calculate the band alignments for the valence part (VBO and φp ). We note that these many-body corrections affect the bulk band structure of the crystals and tend to cancel out for the VBO at semiconductor heterojunctions. Moreover, since they do not affect the potential line-up across the interface, which, being a function of the charge density, can be accurately calculated within a DFT–LDA approach, they have no effect on the dependence of the band alignment on interface properties such as orientation, chemical composition and abruptness (see section 2.4). In this review, we will often be dealing with alloys, which are widely used in semiconductor devices. If one is not interested in the atomic-scale structure of the alloy, simple non-structural theories can be applied. A widely used approach is the virtual-crystal approximation (VCA) in which an Ax B1−x alloy (or a pseudo-binary Ax B1−x C
alloy) is modelled using a single type of atoms on the AB lattice (or AB sublattice): the virtual atom hAx B1−x i, whose atomic pseudopotential is a weighted average of those of the ‘true’ A and B atoms. This VCA approach clearly cannot reproduce the structural relaxations present in real alloys, not only on the microscopic scale (since the bond-length relaxations are neglected), but also on the macroscopic scale. We found, for instance, that the VCA typically overestimates the equilibrium average lattice parameter of the alloys, giving positive deviations from Vegard’s law (linear interpolation between the lattice parameters of the constituents) [28]. The limits of the VCA in describing the structural properties of the alloys are even more serious in the case of ordered alloys and superlattices, for which the internal relaxations can give rise to anisotropic macroscopic strain. Nonetheless, the VCA is quite satisfactory in describing the electronic properties of the alloys, since the valence electrons are quite delocalized and experience a potential which is an average of the potentials individually originating from the real atoms. This is particularly true for the pseudo-binary alloys (such as Ga1−x Alx As and Ga1−x Inx As), with which we will be mostly dealing. These considerations, together with the absence of direct and precise information, in most cases, about the actual morphology of the alloy and their interfaces, justify the use of a simple non-structural theory such as the VCA in the present context. A quantitative discussion of the effects of the VCA on the band line-up can be found in [29] for the InP/Ga1−x Inx As interface. In the remainder of section 2, we present techniques specific to the study of interfaces and to the determination of band alignments; the last part is devoted to an approach based on LRT and implemented within the LDA-SCF framework, used to explain general trends of band offsets and interpret some properties of Schottky barriers. 2.2. Supercell and macroscopic average techniques Interfaces can be studied using periodically repeated supercells, which allow for a convenient reciprocal space formulation of the problem, which is otherwise not possible because of the loss of translational symmetry. Supercells are actually more suitable to describe superlattices rather than isolated interfaces. However, insofar as the bandstructure alignments are concerned, experience has shown that the relevant effects due to the presence of a neutral interface are confined to a small region and the bulk features of the charge density are completely recovered within a few atomic units far from the interface. This implies that the relevant interface features can be studied using supercells with a reasonably small number of atoms (a few atomic planes of each material). Typically the supercells contain two interfaces which are equivalent in terms of stoichiometry and geometry (see figure 2 for some prototypes for semiconductor heterojunctions), in order to avoid electric fields due to unbalanced charges. The isolated interface configuration is well represented, provided that the adjacent interfaces are sufficiently separated that they do not interact. 1275
M Peressi et al
Figure 2. Typical supercells used to describe GaAs/AlAs (001), (110) and (111) abrupt heterojunctions (from the top to the bottom).
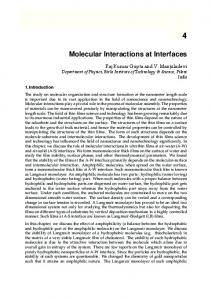
The supercell self-consistent calculations provide the electronic charge density distribution and the corresponding electrostatic potential. Figure 3(a) shows the contour plots of the electronic valence charge density of the GaAs/AlAs(001) interface simulated by a 3 + 3 superlattice in three different atomic planes containing the growth axis. Since the geometry is periodic in the planes parallel to the interface (the (x, y) planes), the first obvious simplification is to consider planar averages as a function of the z coordinate only: Z 1 f (x, y, z) dx dy. (1) f¯(z) = S S From the three-dimensional electronic charge density we get the one-dimensional charge density n(z) ¯ and S(z) shown in figure 3(b). This electrostatic potential V exhibits two distinct, albeit very similar, periodic functions in the two bulk materials, which smoothly join across the interface. Since the system is a lattice-matched one, the S(z) is the same on both side of period a of n(z) ¯ and V the interface and, in this particular case, equal to a0 /2, where a0 is the bulk lattice parameter. The effect of the interface is related to the difference between these periodic functions. Such a difference, which is barely visible in figure 3(b), can be enhanced by getting rid of the bulklike oscillations using the macroscopic average technique 1276
[11, 30]. The macroscopic average is a basic concept in classical electromagnetism [31]; for any microscopic quantity f (micro) (r) one can define a macroscopic average f (macro) (r): Z (macro) (r) = w(r − r 0 )f (micro) (r 0 ) dr 0 (2) f where w(r) is a properly chosen filter function depending on the geometry and on the characteristic length scale of the problem. The application is straightforward for interfaces between two isostructural lattice-matched materials, where w is a material-independent quantity. Acting directly on the planar average, the filter function can be chosen simply as � 1 �a − |z| w(z) = 2 a 2 where 2 is the one-dimensional step function, giving Z 1 z+a/2 ¯ 0 f (z ) dz0 . f (z) = (3) a z−a/2 The results for the GaAs/AlAs(100) charge and potential are shown in figure 3(c). The macroscopically averaged quantities exhibit no microscopic oscillations on either side of the interface and one recovers the constant [32] macroscopic limit in the two bulks. Conversely, deviations from the macroscopic value indicate the interface region
Band engineering at interfaces
Figure 3. Contour plots of the self-consistent electron density distribution (a) for a GaAs/AlAs(001) heterojunction over various atomic planes containing the growth axis and centred on the interface anion. Planar averages (n¯ (z ) and V¯ (z )) (b) and macroscopic averages (n¯ (z ) and V¯ (z )) (c) of the electron density and of the electrostatic potential along the growth direction are shown.
and allow one to define the ‘interface dipole’ without referring to arbitrary ‘ideal’ reference configurations. The macroscopic average technique can also be applied to an interface between two materials A and B with different periodicities because of lattice mismatch or even structural differences, the latter being the case of metal– semiconductor contacts. In order to recover macroscopic
features in the bulk regions of both materials, one has to filter twice, using the functions wA and wB appropriate to each material in turn. This double filtering can be recast in terms of the single filter function Z w(r) =
wA (r − r 0 )wB (r 0 ) dr 0
(4) 1277
M Peressi et al
which explicitly exhibits commutativity. We notice that, even if wA and wB are localized as much as possible, the double filtering reduces the resolution with respect to the single filtering and, for the special case wA = wB , the use of w is not equivalent to the use of wA . Different choices of the filter functions will give profiles with different details, but the macroscopic physics, which contains the relevant information, is the same. 2.3. Potential line-ups The long-range character of the Coulomb interaction makes the average electrostatic potential hV i of an infinite system in general ill defined [11, 33]. Consequently, the potential line-up across the interface between two semi-infinite solids cannot be simply calculated as the difference between bulk quantities; rather, it depends in principle on the detailed structure of the interface. This makes the problem of band alignment at interfaces difficult and it is in principle necessary to calculate accurately the interface charge distribution and the corresponding electrostatic potential. The difference between the macroscopic averages of the electrostatic potential in the two bulk regions is precisely the electrostatic potential line-up, 1V . The macroscopic average commutes with the spatial differentiation which occurs in the Poisson equation and the potential line-up is thus exactly related to the dipole moment of the charge profile: Z 1V = 4πe2
zρ(z) dz
(5)
where ρ is the total (ionic plus electronic) charge density which averages to zero in the bulk-like regions. Equation (5) allows one to define in an unambiguous way the concept of the interface dipole for any surface or interface. Formally, the average potential in a finite system is related to the long-wavelength limit of the charge distribution: 4πe2 ρ(q). ˜ q→0 q 2
e(q) = lim hV i = lim V q→0
(6)
For systems whose charge density ρ can be decomposed into localized atomic-like distributions X ρloc (r − R) (7) ρ(r) = R
where the charge distributions ρloc at the lattice sites R are neutral, carrying no dipole or quadrupole (that is, ρloc (q) ' αq 2 + O(q 3 )), the limit in equation (6) exists and the average potential is a well defined constant also in the infinite crystal. This means that, for solids composed of rigid neutral building blocks ρloc , neither the potential drop across the surface of a semi-infinite sample nor the line-up at an interface depends on the details of the surface or interface structure (namely the orientation and abruptness). For such systems, the potential line-up is simply the difference between the average potentials of the two infinite solids calculated from equation (6) and verifies the transitivity relationship 1V (A/C) = 1V (A/B) + 1278
1V (B/C), which characterizes line-ups controlled by bulk properties. This suggests that the potential line-up problem may be readdressed by studying the properties of single building blocks ρloc . This idea will be further developed within the linear-response formulation of section 2.5. 2.4. Band offsets and Schottky barriers From a theoretical point of view, the band offset (Schottky barrier) is conveniently split into two contributions: VBO = 1Ev +1V (φp = 1Ep +1V ). The band structure term 1Ev (1Ep ) is the difference between the relevant valence band edges in the two materials (between the Fermi level of the metal and the valence-band edge of the semiconductor for a metal–semiconductor contact), when the single-particle eigenvalues are measured with respect to the average electrostatic potential in the corresponding bulk crystal. The band-structure term is characteristic of the individual bulks. This term can be obtained from standard bulk band-structure calculations for each crystal and displays, by definition, transitivity. This is not the case for the electrostatic potential line-up 1V , which can, in principle, depend on structural and chemical details of the interface. According to the above definition, microscopic quantum effects, such as many-body effects on the quasiparticle spectra [25–27], are all embedded in the band structure term 1Ev (1Ep ). We would like to emphasize that the partition of the VBO (φp ) into a potential line-up and a band term is not unique. 1V must contain the line-up of the longrange electrostatic potential generated by the electronic and ionic charge distributions. All the quantities related to the short-range local components of the potential (exchange correlation, the difference between the local part of the pseudopotential and an ionic point-charge potential) are bulk quantities and can be arbitrarily included in one of the two terms. In the work reported here, they are included in the band structure term [34]. In supercell calculations, the band offset or Schottky barrier can also be evaluated directly from the local density of states (LDOS) N(�, z) defined as X (8) ρ¯¯ k,n (z)δ(� − �k ) N (�, z) = k,n
where the sum runs over the bands n and the wavevectors k of the BZ of the supercell, ρk,n (r) = |ψk,n (r)|2 and ψk,n (r) is the electronic wavefunction. Far from the interface, on each side of the junction, the LDOS N (�, z) converges to the bulk density of states of the corresponding crystal. The band offset or Schottky barrier can be obtained thus from the difference between the band edges of the LDOS on the two sides, far from the junction. The LDOS, however, requires supercell computations with a high number of k points and a large energy cut-off compared with those needed to determine the charge density and the potential line-up. In addition, larger supercells have to be used, since the LDOS has a spatial convergence to the bulk features slower than that of the charge density. As a result, the LDOS approach is less convenient, in general, than the potential-line-up approach to determine the band discontinuities.
Band engineering at interfaces
2.5. Linear-response theory Dealing with inhomogeneous systems with ‘similar’ components, which is the case for lattice-matched semiconductor–semiconductor heterojunctions or alloys, one often recognizes that the ‘inhomogeneities’, which are due to the difference between the two bulks, are minute with respect to the typical bulk variations; indeed, they are one or two orders of magnitude smaller. For instance, figure 3 shows that the difference between the charge distributions of the AlAs and GaAs bulks (of the order of 10−1 electrons per zincblende cell in the profile along the (001) direction), which determines the interface dipole, is very small with respect to the bulk-like oscillations (about five electrons per zincblende cell; see also figure 5 in [11]). This suggests the use of a low-order perturbation theory treating the differences as a small perturbation with respect to an appropriate reference periodic system. The reference system for studying the junction or the alloy between a given pair of lattice-matched semiconductors could be one of the two bulks itself, but in order to minimize errors due to the neglect of higher-order terms, the optimal choice is the virtual crystal. Considering for definiteness an interface or a 50%-compositional alloy between two binary semiconductors A1 C1 and A2 C2 , the virtual crystal is constituted by virtual anions and cations, which are, in terms of pseudopotentials, hvA,C i = 1 (v + vA2 ,C2 ). The perturbation which builds up the 2 A1 ,C1 actual system (interface or alloy) amounts to replacing virtual ions by physical ones, in a given pattern. The bare perturbation is described by X [σR 1vC (r − R)+σR−δ 1vA (r−R−δ)] (9) 1V(r) =
quadrupole moment and its long-wavelength behaviour is simply 1ρ˜A,C (q) = QA,C + AA,C q 2 + O(q 3 ) (11) R where QA,C = R1ρA,C (r) dr is the net displaced charge and AA,C = 16 r 2 1ρA,C (r) dr is its second spherical moment. For more details about the formulation, we address the reader to [11–13]. For the interface potential-line-up problem, the change in the electrostatic potential induced by the perturbation which brings the reference system into the real interface is the relevant quantity, since the reference system itself does not display, by construction, any potential line-up. The Fourier transform of the electrostatic potential generated by the whole perturbation (using equation (10)) is 2� X e(q) = 1 4π e 1ρ˜C (q) 1V σR eiq·R 2 N q R � X iq·(R−δ) +1ρ˜A (q) σR−δ e (12) R
where N is the number of cation (or anion) sites in the crystal and is the volume of the unit cell. Formally, the potential drop across the interface is the difference between the changes induced by the perturbation in the average Coulomb potentials on the two sides of the junction, which e(q) in the is related to the long-wavelength behaviour of 1V two bulk regions. Recognizing that σR = σR−δ = +1 on one side and σR = σR−δ = −1 on the other, the potential line-up reads e(q)|σ =+1 − 1V e(q)|σ =−1 ) 1V = lim (1V q→0
(13)
R
where 1vA,C = 12 (vA1 ,C1 − vA2 ,C2 ), δ is the position of the anion in the unit cell, whereas the cation is set at the origin, and σR is an Ising-like variable indicating whether the lattice site R is occupied by ions of type 1 or 2. This transformation is equivalent to the implantation of substitutional impurities in the virtual crystal. Whenever the single perturbing potential 1vA,C is weak enough to induce a localized electronic response 1nA,C linear in the perturbation, the charge-density response to the whole perturbation 1V may be decomposed into localized responses to the single substitutions. To linear order in the perturbation the total charge density of the real (interface or alloy) system is thus ρ(r) ≈ ρvirt (r) X + [σR 1ρC (r − R) + σR−δ 1ρA (r − R − δ)] (10) R
where ρvirt is the charge distribution of the virtual crystal and the 1ρ terms are the total (bare plus electronic) charges induced by the single substitutions. The electronic—and hence also the total—charge density induced by the isolated substitution has the full point symmetry of the substitutional site, the bare perturbation being spherically symmetrical. In the case of the elemental or binary cubic semiconductors with Td symmetry considered here, 1ρA,C has no dipole or
which is ultimately related to the long-wavelength behaviour of the isolated 1ρ˜A,C (q) in equation (11). The following section describes the application of the LRT approach to various prototypical cases of lattice-matched semiconductor–semiconductor interfaces. 3. Lattice-matched semiconductor interfaces 3.1. Isovalent semiconductor heterojunctions The GaAs/AlAs heterojunction is the simplest and most studied among the lattice-matched common-anion heterojunctions. The appropriate reference crystal in this case is the virtual crystal hGa1/2 Al1/2 iAs. The isolated substitution, being isovalent, is neutral; therefore, the induced potential drop across the interface is only due to the electronic charge and, according to equations (11)–(13), is Z 8π e2 AC 4π e2 1V = r 2 1nC (r) dr = (14) 3 independently of the interface orientation and abruptness. We stress that the latter property derives from the charge neutrality of the perturbation and is therefore valid also for other isovalent interfaces. The response 1nC (r) can be determined through a direct approach, from the difference between two independent supercell calculations of the self-consistent 1279
M Peressi et al
Figure 4. The electron-density response of the hGa1/2 Al1/2 iAs virtual crystal to a single hGa1/2 Al1/2 i : Ga substitution in a 32-atom BCC cell. We present a contour plot of the linear term 1n (1) (r) in the (110) plane (full/broken lines indicate a positive/negative response) (a); thick dotted, broken and full lines are the intersections of the plane respectively with a two-atom FCC, 16-atom FCC, and 32-atom BCC Wigner–Seitz cell centred on the impurity. Radial spherical averages of the linear (full line) and quadratic (broken line) terms of the density response are shown (b). The average radius of the two-atom FCC cell and the nearest and next-nearest neighbour distances are also indicated.
charge density for the perturbed system with an impurity and for the unperturbed host material. The result is shown in figure 4 for the virtual crystal hGa1/2 Al1/2 iAs, in which the central cation is substituted by a pure Ga: the calculations are performed using a 32-atom body-centredcubic (BCC) supercell. Figure 4 suggests that, in the present case, even a smaller supercell would be large enough to describe the isolated substitution. The most significant electronic rearrangement is localized within a bulk face-centred-cubic (FCC) cell and occurs along the directions of the chemical bonds. The comparison of the on-site linear and quadratic terms of the charge response supports the validity of the linear approximation, since the quadratic term is negligible. The validity of the LRT also in the decomposition of the total response into localized responses can be seen from the charge and potential profiles in figure 5. The top panels 1280
show the response of the virtual crystal to the substitution of an entire plane of cations by Ga along the (001), (110) and (111) directions; in the other panels the total response to all the substitutions needed to obtain the GaAs/AlAs interface (namely the difference between the LDA-SCF GaAs/AlAs charge density and that of the virtual crystal) is compared with the corresponding superposition of the linear responses to the single planar substitutions: the two profiles are not distinguishable on this scale, thus indicating that the inter-site higher-order terms due to the interference of the responses are negligible. Within LRT, the potential line-up at the GaAs/AlAs interface can be expressed in terms of the response 1n¯ C (z) of the charge density to the single Ga-plane substitution as Z 4π e2 1V = z2 1n¯ C (z) dz (15) a where a is the distance between consecutive cation planes.
Band engineering at interfaces
Figure 5. Planar averages of the response of the electron density (full line) of the virtual crystal hGa1/2 Al1/2 iAs to a single planar X = hGa1/2 Al1/2 i ⇒Ga substitution and the corresponding electrostatic potential (broken line) (top panels). In the bottom panels we show the response to the whole perturbation leading to the GaAs/AlAs heterojunctions. Results from fully LDA-SCF calculations and from LRT (superposition of linear responses upon single planar substitutions) are not distinguishable on this scale. From the left- to the right-hand side: (001), (110) and (111) orientations.
The bulk-like nature of the electrostatic potential line-up—and consequently of the VBO—in GaAs/AlAs, predicted by LRT, is confirmed by accurate LDA-SCF supercell calculations performed for the three main crystallographic orientations (001), (110) and (111) with a sharp interface [12, 30] and, in the (001) case, also for a non-abrupt interface containing a mixed cationic plane, with equal concentrations of Ga and Al atoms [35]. Although the interface dipoles have a different shape (see figure 6, full lines), the electrostatic potential line-up is the same— within the numerical accuracy of our calculations (see section 2.1)—in the four cases examined and coincides with the LRT prediction to within 0.02 eV. The total LDA-SCF band offset is VBO ≈ 0.45±0.02 eV. This value is obtained neglecting many-body and relativistic effects which can be added a posteriori and which amount to ≈ 0.1 ± 0.02 eV [26, 27] and ≈ 0.03 ± 0.01 eV [36] respectively. The many-body effects have been evaluated using the difference between the corrections to the LDA bulk band-edge energies of GaAs (−0.07 eV) and AlAs (−0.18 eV), determined in [26, 27], where the quasiparticle band structures were obtained by calculating the selfenergy operator within the so-called GW approximation. Incidentally, the calculated values of the many-body correction to the VBO turn out to be within 0.2 eV for a large number of heterojunctions between group IV and/or III–V semiconductors [27]. The relativistic effects have been evaluated by adding to the two bulk LDA-SCF valence band edges the spin–orbit correction ( 13 10 ), using
the experimental value of the spin–orbit splitting 10 . We emphasize here that the many-body and relativistic effects enter only in the bulk band structure term, according to the present scheme, and therefore, whatever their values may be, these effects do not affect, in principle, the conclusions on the independence of the VBO from the interface details. Adding many-body and relativistic corrections, the resulting final estimate for the VBO at the GaAs/AlAs interface is thus ≈0.58 ± 0.06 eV, which compares well with the experimental values which are in the range 0.45–0.55 eV [3]. The LRT approach can be extended to the more general case of no-common-ion heterojunctions A1 C1 /A2 C2 , such as InAs/GaSb [37, 38] and InP/Ga0.47 In0.53 As [29]. We only stress here the new features with respect to the simpler case of GaAs/AlAs and we address the reader to the original works for the details. In the spirit of LRT, the VBO can be obtained by calculating separately the anion and cation contributions to the potential line-up, considering the A1 C/A2 C and AC1 /AC2 interfaces, with the lattice parameter taken equal to the common lattice parameter of the two real constituents. Within the limits of the LRT, anionic and cationic contributions turn out to be additive and both are independent of orientation. Another new feature with respect to the GaAs/AlAs case is the existence of two abrupt inequivalent interfaces in the polar directions, corresponding to the different terminations A1 –C2 and A2 –C1 and characterized by the presence of different interfacial strains. In fact, 1281
M Peressi et al
Figure 6. Macroscopic averages of the electron density (full line) and the corresponding electrostatic potential (broken line) at a GaAs/AlAs heterojunction. From the topmost to the lowest panel: (001) abrupt, (001) non-abrupt with a mixed cationic plane, (110) abrupt and (111) abrupt.
in the general case of no-common-ion lattice-matched heterojunctions, the lattice-matching conditions almost always result from a balance between the differences of the cationic and anionic core radii, which may differ considerably in the two semiconductors. As a consequence, an important microscopic interfacial strain may develop within a few interplanar distances from the interface due to the individually different bond lengths that will be established there. 1282
For instance, in the case of the InAs/GaSb (001) interface, the In–Sb (Ga–As) interface interplanar distance is elongated (contracted) by about 14% with respect to the common value which is present in the bulk InAs and GaSb regions [37, 38]. In the case of InP/Ga0.47 In0.53 As, the interface strain for the two abrupt inequivalent interfaces amounts to about 4% [29]. The strain profile can be found from accurate LDA-SCF supercell calculations by minimizing the total energy
Band engineering at interfaces
with respect to the atomic positions and macroscopic strain. It is, however, particularly convenient and instructive to use a model based on LRT concepts, which allows one to obtain the strain profile along the growth direction for any given composition profile of the junction [37, 38], and to describe in a physically sound and accurate way the effects of such a strain on the VBO in terms of displacements of effective charges [29, 37, 38]. Remarkably, LRT explains why, despite the fact that the interfacial strain can vary with the interface composition, the band offset is almost unchanged. This is in agreement with experimental data and full LDA-SCF supercell calculations for InP/Ga0.47 In0.53 As(100) [39], which show that, although anion intermixing at the junction can reduce the interface strain by 3%, it has virtually no effect on the band offset provided that the minimal-energy structure is used for each interface composition. 3.2. Heterovalent semiconductor heterojunctions The simplest and most studied case among heterovalent semiconductor heterojunctions is Ge/GaAs. In this case, the appropriate virtual crystal is a fictitious hGe1/2 Ga1/2 ihGe1/2 As1/2 i zincblende, whose cation has valence charge 3.5, while the anion has valence charge 4.5 [11, 40, 41]. The localized perturbations leading to the real ions carry a bare charge ±e/2. Therefore within LRT the total charge induced by these perturbations is ±e/2hεi, where hεi is the dielectric constant of the virtual crystal. According to equation (11) the corresponding Fourier transform is 1ρ˜A,C (q) = ±
1 + AA,C q 2 + O(q 3 ). 2hεi
(16)
In the spirit of LRT, the potential line-up can be split into two contributions: 1V = 1Vhetero + 1Viso
(17)
due to the constant and quadratic terms in equation (16). The latter is by construction purely electronic and it is therefore the only term present in the case of isovalent interfaces. According to the previous discussion, 1Viso is independent of interface details. 1Vhetero contains both the ionic and the corresponding electronic contribution and is formally equivalent to the line-up generated by an assembly of point charges of absolute value e/2hεi. This term depends on the atomic structure of the interface (orientation, abruptness, relaxation and so on). However, once the structure is known—either experimentally or by independent theoretical calculations—1Vhetero can be evaluated from simple electrostatics. In the (110) direction, the virtual crystal is made of atomic planes with one cation and one anion per unit surface cell. The perturbation leading from the virtual crystal to an ideal abrupt interface is therefore neutral in each plane parallel to the interface, so that 1Vhetero vanishes and 1V (110)abrupt = 1Viso . The corresponding offset for the Ge/GaAs(110) interface is VBO = +0.60 eV (Ge is higher).
In the (001) direction, the virtual crystal is made of an alternating stack of cationic and anionic planes, carrying surface charge densities of 3.5 and 4.5 electrons per unit surface cell. At variance with the (110) case, ideally abrupt interfaces along this direction would be charged and hence thermodynamically unstable, [42–45]. The simplest neutral interfaces one can envision are terminated by one mixed plane. There are two such inequivalent interfaces where the mixed plane is hAs1/2 Ge1/2 i or hGa1/2 Ge1/2 i (see figures 7(a) and (b)). The point-charge contribution to the potential line-up is 1Vhetero = ±π e2 /(2a0 hεi), where a0 is the lattice parameter of the virtual crystal. 1Vhetero is equal in magnitude and opposite in sign for the two interfaces, so that the average 1V predicted by LRT is simply 1Viso . The supercell LDA-SCF calculations give VBO equal to +0.88 eV and +0.28 eV respectively [40, 41]. We note that indeed the average of these two offsets nearly equals the value for the (110) abrupt interface. Other authors [46] have already observed this fact by comparing the results obtained for the VBO at the (110) and (001) interfaces with different terminations, but without giving any rationale. In general, atomic interdiffusion in the real samples may occur over several atomic planes across the interface, depending on the growth conditions. To predict the actual composition profile is beyond the possibilities of the present theoretical approach, not just because of the heavy computational effort required to study many different configurations, but since it would not be sufficient to compare the final total energies without taking into account thermodynamic and kinetic factors in the formation of the interface. We therefore limit our discussion here to the role of the interface morphology in the possible changes induced in the band discontinuities, by examining a few specific configurations. Supposing that the atomic interdiffusion occurs over two atomic planes, but without formation of antisites, the composition profile would be . . . Ge–Ge–hGex As1−x i–hGey Ga1−y i–As–Ga–As . . .. Charge neutrality requires that y = x − 0.5. Using LRT, 1Vhetero (x) is [2π e2 /(a0 hεi)](x − 0.75) [13, 35, 47] and its maximum possible variation with x is π e2 /(a0 hεi) ≈ 0.8 eV [48]. In the particular cases in which x = 0.5 and x = 1, the simple atomic intermixings over a single plane are recovered. When x = 0.75 the interface, besides being neutral, does not carry any ionic dipole (1Vhetero = 0). Analogous considerations apply for the complementary composition profile . . . Ge–Ge– hGey Ga1−y i–hGex As1−x i–Ga–As–Ga. . .. Therefore, two inequivalent neutral interfaces with no ionic dipole are possible: the first is terminated by one hGe3/4 As1/4 i and one hGe1/4 Ga3/4 i plane in sequence (figure 7(d)); the other has the complementary pattern hGe3/4 Ga1/4 i and hGe1/4 As3/4 i (figure 7(c)). LRT predicts for these interfaces a VBO equal to the one for the (110) abrupt interface (0.60 eV); supercell LDA-SCF calculations indicate deviations from linearity of about ±0.02 eV, giving VBO = 0.62 eV for the first configuration and 0.58 eV for the second [49]. Atomic interdiffusion can be responsible for different values of the VBO even at (110) interfaces (see for instance figures 7(e) and (f)). Such a possibility has been suggested by experiments showing that there is a dependence of 1283
M Peressi et al
a)
b)
c)
d)
(110)
e) (001)
As Ga Ge f)
Figure 7. Atomic configurations for some selected neutral non-abrupt Ge/GaAs interface morphologies in various orientations: (001) with one, (a) and (b), and two, (c) and (d), mixed planes; and (110) with 25% of Ga–Ge (e) and As–Ge (f) swaps. The broken line shows the position of the geometrical interface.
the VBO on the growth sequence (non-commutativity) at Ge/GaAs, GaAs/Ge and ZnSe/Ge, Ge/ZnSe(110) interfaces [3]. In terms of the present LRT scheme, this is explained in terms of non-vanishing ionic dipoles (1Vhetero 6= 0) that are established because of swaps between atoms of different valences, causing the average ionic charge in planes parallel to the interface to deviate from the constant value of the abrupt case. Systems such as Ge/GaAs, ZnSe/Ge and Si/GaP have been studied in detail [13, 35, 50] and the predictions of LRT are found to be in excellent agreement with the full supercell LDA-SCF calculations performed for some selected configurations, not including (for consistence 1284
with the LRT scheme) structural relaxations. In the heterovalent heterojunctions structural relaxations are not negligible in general, as in the case of no-common-ion isovalent heterojunctions that we have already discussed; their effect on the VBO can be typically of the order of 0.1 eV (see for instance [51] for the ZnSe/Ge(110) interface). We do not discuss these effects further here, both because they depend on the atomic-scale configuration of the interface (which is actually unknown) and because the effects of the various interface orientations and terminations are more relevant. We would like to stress here that the theoretically predicted effects of the atomic intermixing are compatible with the observed non-commutativity at heterovalent interfaces, but a more detailed comparison between theory and experiment would be meaningless in the absence of detailed information about the actual atomicscale interface configuration. A transitivity relationship may occur, at least approximately, for isovalent interfaces, due to the bulklike character of 1Viso . We notice, however, that, if linearity holds separately for the systems A/B, B/C and A/C, this does not necessarily imply an exact transitivity relationship, since there is no unique optimal reference system which minimizes higher-order terms. One cannot find three purely isovalent lattice-matched systems to verify transitivity unambiguously: the best case could be (InAs, GaSb, AlSb), but the mismatch between InAs and AlSb is about 1.25%, which is not completely negligible. Conversely, examples of three or even four lattice-matched systems including also heterovalent interfaces do exist, for example (Si, GaP, AlP) and (GaAs, AlAs, Ge, ZnSe), but transitivity must be tested only by comparing interfaces with equal orientations and equivalent composition profiles. In fact, 1Vhetero strongly depends on these details and therefore, by its very nature, does not display transitivity. A comparative study of the interfaces for the system (GaAs, AlAs, Ge) is reported in detail in [12] and we only summarize the results here. The comparison of full LDA-SCF calculations performed for geometrically and stoichiometrically equivalent interfaces has shown that there are violations of the transitivity rule up to 0.09 eV, namely ones that are small but definitely exceed the computational error, which have to be ascribed to higher-order response terms. Conversely, the noticeable lack of transitivity (with deviations of the order of tenths of an electron-volt rather than hundredths) which is experimentally observed also in other cases involving heterovalent interfaces has to be ascribed to the establishment of inequivalent interface configurations at the various heterojunctions. For (GaAs, Ge, AlAs)(001) and (ZnSe, Ge, GaAs)(001) accurate comparative measurements of VBO [47, 49] indicate that there are deviations from the transitivity rule of about 0.25 and 0.4 eV respectively, which are definitely beyond the experimental resolution. Considering the possibility of an atomic intermixing over two atomic planes, variations in 1Vhetero of up to about 1 eV are predicted by LRT for the various interface configurations for GaAs/Ge (as discussed above), AlAs/Ge [49] and ZnSe/GaAs(001) interfaces [47, 52], with small differences
Band engineering at interfaces
because of the different dielectric constants involved [48]. For the ZnSe/Ge(001) interface, the possible maximum variation of 1Vhetero is even larger and amounts to 2π e2 /(a0 hεi) ≈ 1.3 eV, since the difference in the chemical valence between Zn(Se) and Ge atoms is twice that of the other systems. Therefore, the experimentally observed large deviations from transitivity can be explained in terms of the formation of different inequivalent interfaces. Insofar as their microscopic morphology is concerned, some insight can be gained from theoretical predictions, although many different interface configurations may correspond to the same offset. At the end of this subsection, two main features are to be stressed. First, heterovalent interfaces are the ideal candidates as tunable heterojunctions: this point is addressed in section 6. Second, the sensitivity of the band offsets to the microscopic structure of the interface makes it possible to find configurations having very different line-ups, which makes their measurement rather suitable for characterization purposes; however, any comparison between experiments and calculations must be made with a high degree of caution, since it is also possible to find very different configurations having the same line-up. 4. Strained (Lattice-mismatched) semiconductor interfaces Inducing strain in one or both semiconductors is a widely used method for engineering band discontinuities in quantum-well structures. In comparison with the case of the lattice-matched heterojunctions, much less theoretical work has been done on the strained systems. In the lattice-mismatched heterojunctions, the stress state of the two materials can be varied by changing the composition (and, hence, the in-plane lattice parameter) of the substrate, thus affecting the VBO through the different dependences of the band-edge energies on the strain (deformation potentials) [53, 54]. In pseudomorphically grown superlattices, considered here, the lattice mismatch between a cubic substrate and the epilayer is accommodated by an appropriate strain along the growth direction, corresponding to a lattice constant a⊥ which essentially depends on the elastic properties of the epilayer. From the experimental point of view, the thickness of the pseudomorphic epilayer has to be kept small enough to avoid misfit dislocations. The macroscopic theory of elasticity provides a first hint for the determination of the structure. Following [53] and considering here only the (001) growth direction, one has epi ak = aksubs ≡ a subs � � �epi � c12 epi epi a⊥ = a epi 1 − 2 �k (18) c11 epi
ak
epi
a⊥ −1 a epi a epi where � is the strain tensor and cij are the elastic constants of the bulk epilayer; the label subs refers to the cubic substrate and epi refers to the strained epilayer. More epi �k
=
−1
epi
�⊥ =
generally, the possibility of inducing strain in both materials constituting the heterojunction must be considered, when the substrate governing the pseudomorphic growth of the heterostructure has an intermediate lattice parameter. The macroscopic theory of elasticity predicts the interplanar distances accurately enough in the bulk regions, namely, midway between the two interfaces or two to three atomic planes away from them, whereas it fails in the interface region where the interplanar distances sensitively depend both on the substrate composition and on the interface termination [55] and also, to a lesser extent, on the period of the superlattice [28]. The exact determination of the equilibrium structure can be achieved by looking for those atomic positions and values of the tetragonal deformation c/a of the supercell which make the forces acting on the atoms and the macroscopic stress vanish. This can be achieved by total energy minimization or by using a model based on LRT [28]. The latter, which is similar to the one used for studying the interfacial strain profile at isovalent lattice-matched heterojunctions [37], has been applied to Si/Ge superlattices and has given results in excellent agreement with the fully relaxed LDA-SCF calculations. Neglecting relativistic effects, the top of the valence band at the 0 point in a bulk unstrained semiconductor is threefold degenerate. A uniaxial (001)-oriented strain lowers the crystal symmetry from Td to D2d , thus splitting the valence-band edge into a singlet and a doublet. In the case of a tensile (compressive) strain, the singlet is below (above) the doublet. Taking into account the spin degeneracy, the valence-band-edge manifold includes six states, which, in the absence of strain, are split by spin–orbit interaction into a quadruplet and a doublet, the split-off band (so). Moving away from the zone centre, the quadruplet is split into a pair of doublets: the heavy-hole (hh) and the light-hole (lh) bands. The above degeneracy is further lowered by a (001) uniaxial strain, which splits the hh and lh levels at 0. The split states are found a posteriori by adding the spin–orbit effects to the results of non-relativistic LDA-SCF calculations: their positions with respect to the weighted average Evave of the valenceband edge (namely the band edge calculated neglecting both spin–orbit and strain effects) are [53] Evhh = Evave + 13 10 − 12 δE001
(19)
= Evave − 61 10 + 14 δE001 ± 12 [120 + 10 δE001 + 94 (δE001 )2 ]1/2
Evlh,so
where the + (−) sign refers to lh (so). 10 is the spin–orbit term, δE001 is, in absolute value, equal to 23 of the total separation between the two topmost states of the valenceband manifold calculated without the spin–orbit interaction; its sign is negative for an elongation, positive otherwise. This implies that uniaxial tensile strain shifts the hh band above the lh band, whereas uniaxial compressive strain shifts the lh band above the hh band. The average Evave , calculated with respect to the reference electrostatic potential, is subject only to shifts due to the hydrostatic component of the strain, corresponding to a relative volume change 1/ : Evave = Ev0 + Dv(bs)
1
(20) 1285
M Peressi et al
Figure 8. The variations of the GaAs and GaP topmost top (Ev , full line) and average (Evave , broken line) split valence-top edge manifolds with the substrate in the pseudomorphic GaAs/GaP(001) heterojunction; the top differences 1Ev and 1Evave are the corresponding contributions of the band structure to the VBO. (From unpublished work by Di Ventra and Peressi.)
where Dv(bs) is the ‘band-structure’ term [54] in the absolute deformation potential [53, 54] and Ev0 is the degenerate valence-band edge of the cubic unstrained material. Evave can also be calculated as the threefold-degenerate top valence state of the material in a cubic configuration with the same volume as the strained material, that is, with an effective cubic lattice constant a˜ = (ak2 a⊥ )1/3 [56]. We stress that Dv(bs) is not the absolute deformation potential, which, in principle, is well defined in terms of bulk properties only for non-polar lattices and for uniaxial strain [54]. The variation of the VBO with strain includes also the variation of the potential line-up 1V and it is related to the total absolute deformation potential. It is instructive to study the VBO at various prototype lattice-mismatched A/B heterojunctions as a function of the substrate lattice parameter ak in the range aA ≤ ak ≤ aB . For all the systems studied [55–59] the largest contribution to the strain variation of the VBO originates from the band structure term 1Ev rather than from the interface-dependent potential line-up 1V , which varies very little with ak . The variation of the VBO with strain is therefore mainly a bulk effect. Furthermore, its variation is small when it is calculated from the averages of the valence-band manifolds (VBOave ) and relevant when it is calculated between the topmost (VBOtop ) split valence states. In fact, in all cases studied the variation of the band structure term measured from the averages (1Evave ) is one order of magnitude smaller than top that measured from the topmost states (1Ev ). Therefore, in general the variation of the VBO with strain is mostly due to the strain-induced splittings δE001 (equation (19)) of the valence-band manifold rather than from the shifts (equation (20)) related to 1/. In figure 8 the variations top of the band structure terms 1Ev and 1Evave with the substrate are shown for the case of GaAs/GaP. 4.1. Isovalent interfaces The simplest case of lattice-mismatched heterojunctions is Si/Ge [56], which is an example of an isovalent homopolar 1286
interface. The offset VBOave is about 0.44 eV (Ge is higher) for the configuration corresponding to a substrate made of 50%–50% alloy, with a tunability of about 0.06 eV ingoing from a substrate of pure Ge to one of pure Si. For VBOtop , on the contrary, the corresponding tunability over the whole range is one order of magnitude larger, about 0.5 eV. The relationship between the strain variation of the VBO and the absolute deformation potential of the two bulks has been discussed in [56] for the Si/Ge system. Several common-ion lattice-mismatched heterojunctions have been investigated in detail, such as GaAs/InAs [57], GaAs/GaP [58] and ZnS/ZnSe [59]. We address the reader to the original works for details and we summarize here a result of common validity for these systems. Since the potential line-up is the most computationally expensive part in the LDA-SCF calculation of the VBO, it is of fundamental and practical interest to understand and possibly predict without much effort its variations with the substrate, despite the fact that they are small. It has recently been shown that, in the case of pseudomorphic growth conditions and with precise limits of validity which are discussed in detail in [58], once 1V is known for a given substrate (say as0 ), its value 1V 0 for another substrate as0 can be predicted by the simple scaling law 1V 0 ' (1 − 2�k )1V
(21)
where �k = as0 /as0 − 1. For the systems mentioned above, the predictions of equation (21) are in excellent agreement with the full LDA-SCF calculations. 4.2. Heterovalent interfaces With respect to the isovalent case, heterovalent latticemismatched interfaces offer greater flexibility in terms of the tunability of the VBO, thanks to the peculiar nonbulk character of the band alignment between heterovalent materials. The Si/GaAs heterojunction has been studied [55] in a few selected configurations corresponding to pseudomorphic growth along the (001) orientation to discuss the effects on the VBO of strain (that is, of different substrates) and of chemistry (that is, of different interface terminations). Among the several possible stable interface morphologies, the simplest terminations which give rise to neutral interfaces and were considered are those with only one mixed atomic plane X = hSi1/2 As1/2 i or Y = hSi1/2 Ga1/2 i. The mixed planes at the interface were described by the VCA. Particularly noticeable in this system are the relaxations of the bond lengths in the interface region (see figure 9 and the original paper [55] for details) which are predicted by total energy minimization. We also found that the potential line-up is more sensitive to the atomic positions at the interface than it is in isovalent systems, such as InP/Ga0.47 In0.53 As [29], Si/Ge [56] and InAs/GaAs [57]. In summary, both chemistry and microscopic strain have sizeable effects. The final results for the Si/GaAs(001) VBO, with spin–orbit effects included, measured between the topmost valence states for the various morphologies considered in this work are as follows: +0.54,
Band engineering at interfaces
still controversial. It has most often been ascribed either to intrinsic metal-induced gap states (MIGS) [9, 10, 60] or to extrinsic gap states arising from defects near the interface [61–64]. Progress in epitaxial growth has made possible the fabrication of a number of stable epitaxial metal– semiconductor structures. These include selected elemental metals on GaAs and GaAlAs, the well known epitaxial contacts formed by transition metal disilicides on Si [65] and various monocrystalline arsenide-based metal contacts on III–V semiconductors [66]. Such systems, which may be viewed as the metal–semiconductor counterparts of the lattice-matched semiconductor heterostructures, provide an ideally simple starting point to examine from first principles the mechanisms determining band alignment at metal– semiconductor interfaces. Among the most studied systems are the Si–silicide interfaces [67–69] and the Al and Au contacts on GaAs and GaAlAs [64, 70–73]. As an example, we discuss here the case of the Al/Ga1−x Alx As(100) junctions. These junctions, involving a simple metal and the lattice-matched Ga1−x Alx As alloys, have been the focus of many recent experimental studies and are also well suited to investigate theoretically the connection between Schottky barriers and heterojunction band offsets. Experimentally, there is indeed evidence of a correlation between band offsets and Schottky-barrier trends. The transitivity relationship φp (A/C) − φp (A/B) = VBO(B/C) Figure 9. Upper panel: interplanar distances in the Si4 /(GaAs)5 (001) superlattices for different substrates (Si and GaAs) and different interface terminations. X and Y indicate the virtual atoms X = hSi1/2 As1/2 i and Y = hSi1/2 Ga1/2 i respectively. Open triangles refer to the predictions of the macroscopic theory of elasticity; closed symbols to fully relaxed supercell LDA-SCF calculations. Lower panel: a schematic indication of the displacements of the interface plane in the relaxed configurations (from [55]).
−0.15, +0.10 and −0.55 eV for the As-termination– Si-substrate, Ga-termination–Si-substrate, As-termination– GaAs-substrate and Ga-termination–GaAs-substrate cases, respectively, where the positive/negative sign indicates that the topmost GaAs valence state is higher/lower than the topmost Si valence state, with a maximum tunability due to the combined effects of strain and chemistry of the order of 1.1 eV. 5. Epitaxial metal–semiconductor contacts When dealing with metal–semiconductor systems, one is confronted with the tremendous diversity and complexity of their interface morphologies. It had been recognized early on, however, that the Schottky barrier height generally has a much stronger dependence on the semiconductor material than it does on the metal type and the contact fabrication method, for junctions of practical interest [7]. The origin of this Fermi-level pinning, which contributes to determining the value of the Schottky barrier achieved in practice, is
(22)
between a metal A and two semiconductors B and C has been verified typically to within 0.2 eV for a number of metal–semiconductor systems [1]. These include Al, Mo and CoGa contacts on Ga1−x Alx As alloys, for instance, and Au contacts on elemental semiconductors and a number of III–V compounds and alloys [1, 66, 74, 75]. It should be mentioned, however, that significantly larger deviations (of the order of 1 eV) were recently reported for especially engineered interfaces; this aspect will be discussed in section 7. The transitivity property of the Schottky barriers has generally been interpreted either in terms of a MIGS-related pinning of the Fermi level to a canonical charge neutrality level [9, 10] or in terms of pinning to some native defect level of the semiconductor [76]. Several authors suggested that studying the dependence on hydrostatic pressure of the Schottky barrier may help in discriminating between the different models and could identify the defects possibly responsible for the pinning [77, 78]. In the case of the Al/Ga1−x Alx As junctions, the dependence of the Schottky barriers both on the alloy composition and on hydrostatic pressure has been examined experimentally [78, 79]. On the basis of qualitative arguments concerning the pressure dependence of the neutrality level, the measured pressure trends of the Schottky barriers were interpreted as being in conflict with intrinsic pinning mechanisms [78, 79] and as evidence of pinning due to defects with bonding character, thus excluding as candidates native defects such as the As antisites and EL2 centres, which commonly are associated with the pinning [61]. Similar conclusions against MIGS-related mechanisms had been proposed 1287
M Peressi et al
Figure 10. The epitaxial geometry and supercell used for the Al/GaAlAs(100) junction with the anion-terminated (type I) or cation-terminated (type II) GaAlAs(100) interface.
earlier in studies of the alloy-composition dependence of the Al/GaAlAs Schottky barriers [79]. We will illustrate here the results of recent LDA-SCF calculations for defect-free Al/GaAlAs junctions, which show that the experimental alloy composition and pressure trends of the Schottky barriers can be fully accounted for without postulating defect-induced Fermi-level pinning [73, 80]. Specifically, the trends can be explained by applying to ideal (defect-free) interfaces LRT schemes similar to those employed in the study of band offsets. The supercells used to model the Al/Ga1−x Alx As(100) junctions are illustrated in figure 10. The Al and GaAlAs lattice √ parameters satisfy the epitaxial condition aAl ≈ (1/ 2)aGaAlAs , which implies that Al(100) may be grown epitaxially on Ga1−x Alx As(100) with the Al overlayer rotated by 45◦ about the Ga1−x Alx As [100] axis. Since the Al/GaAlAs(100) junction is polar, one can envisage two types of inequivalent abrupt interfaces with anion (type I) and cation (type II) GaAlAs(100) termination, respectively. The corresponding interfacial geometries, which are represented in figure 10, were optimized with respect to various translational configurations of the metal overlayer relative to the semiconductor surface [73]. Figure 11 shows the Schottky barrier heights φp (Al/Ga1−x Alx As) obtained from the LDA-SCF calculations for the two types of interfaces illustrated in figure 10. The VCA was employed in these calculations to take into account the alloying on the cation sublattice. The theoretical values include the effect of the spin–orbit splitting of the semiconductor’s valence-band edge, which was derived from experiment, as well as many-body corrections to the single-particle eigenstates. The many-body corrections of [71] were used for the GaAs valence-band edge and the Al Fermi level, yielding a correction of 0.22 eV to φp (Al/GaAs). For φp (Al/AlAs), the many-body correction was included using the correction to φp (Al/GaAs) and the difference in the quasiparticle band-edge energies of GaAs and AlAs (0.1 eV) evaluated in [26]. A linear 1288
Figure 11. The composition dependence of the Al/Ga1−x Alx As(100) Schottky barrier height for the anion-terminated (type I) and cation-terminated (type II) interfaces (see figure 10). The symbols show the experimental data from [74] (M, I(V); , C(V); and �, IPE) and [79] (♦, I(V)). (From [80]).
◦
interpolation between the GaAs and AlAs corrections was used for 0 < x < 1. The resulting Schottky barrier heights for the Al/GaAs (Al/AlAs) junction are 0.78 eV (1.34 eV) at the anion-terminated interface and 0.67 eV (1.05 eV) at the cation-terminated interface, thus showing that there is a non-negligible dependence on the interface termination. In figure 11, the theoretical values of the Schottky barrier height are compared with the experimental current– voltage (I(V)), capacitance–voltage (C(V)) and internal
Band engineering at interfaces
photoemission (IPE) data from [74, 79]. Taking into account the estimated theoretical uncertainty of about 0.1 eV in φp and the unknown stoichiometry of the experimental interfaces, good general agreement between the calculated and experimental alloy-composition dependences of the Schottky barrier is found. Experimentally, the transitivity rule for the Al/GaAs, Al/AlAs and GaAs/AlAs(100) band discontinuities is verified within experimental uncertainty; that is, the difference φp (AlAs) − φp (GaAs) is typically in the range 0.45–0.6 eV and the band offset VBO(GaAs/AlAs) is in the range 0.45–0.55 eV [3]. In the calculations, the transitivity is verified to within 0.03 eV for the anion–terminated interfaces, whereas a deviation of −0.21 eV is observed for the cation-terminated interfaces [80]. This difference between the two types of junctions can be understood by comparing their charge densities with the charge densities of the bulk semiconductor and metal crystals. This is done in figure 12(a) in the case of the As-terminated Al/GaAs interface. Inspection of figure 12(a) shows that the charge density in the junction differs from that of the bulk constituents only in a very localized region, which mostly includes the semiconductor plane closest to the metal. This is a general feature also observed in the other Al/GaAlAs(100) junctions. The difference in the transitivity properties of the anion- and cation-terminated interfaces can thus be understood from the fact that, in the As-terminated junctions, as opposed to the cation-terminated junctions, the chemical composition of the semiconductor plane closest to the metal is not modified by the alloy composition x. Unlike the charge density, which fully recovers its bulk character within about a monolayer from the metal, the electronic states reproduce the bulk semiconductor density of states only several atomic layers away from the interface. This is illustrated in figure 12(b), which shows the contribution to the charge density of the electronic states with energies above the GaAs valence band edge, namely the MIGS contribution to the charge density. The MIGS decay within the semiconductor with a decay length ˚ Figure 12 shows that these states tend to of about 3 A. re-establish the bulk semiconductor charge density in the vicinity of the interface. This behaviour of the MIGS is related to the local charge neutrality emphasized, in particular, by Tersoff in his model of the charge neutrality level [9]. Tersoff’s model is based on a metallic screening by the MIGS of local interfacial perturbations and predicts Schottky barrier heights which are a bulk property of the semiconductor. In contrast to this model, however, the different Schottky barriers obtained from the ab initio calculations for the cation- and anion-terminated Al/GaAlAs(100) interfaces, in figure 11, demonstrate that the absolute value of the Schottky barrier is not a bulk property. This is also consistent with the results of several first-principles investigations of metal/Si [68, 69, 81] and metal/GaAs [64, 70–72] junctions showing that there is a significant dependence of the Schottky barrier height on the details of the atomic structure at the interface. Further evidence of the incomplete screening by the MIGS of local
interfacial perturbations will be presented also in section 7 in the context of Schottky barrier tuning. The results in figure 11, nevertheless, strongly suggest that the variation of the Schottky barrier with the semiconductor’s alloy composition might be dominated by the same bulk mechanisms as those that control band offsets at isovalent semiconductor heterojunctions. In order to clarify this behaviour and explain the observed transitivity properties of the Schottky barriers, we have used a linearresponse-theory approach similar to that employed in the study of band offsets [73, 80]. To this end, the Al/GaAs and Al/AlAs interfaces are considered as perturbations with respect to a reference junction formed by Al and the hGa1/2 Al1/2 iAs virtual crystal. The charge density of the Al/GaAs (Al/AlAs) junction is then constructed from the linear superposition of the charge-density responses to single-atomic–plane substitutions transforming the virtual hGa1/2 Al1/2 i cations into the real Ga (Al) ions. An ideal linear superposition of the responses 1nGa(Al) bulk of the charge density of bulk hGa1/2 Al1/2 iAs semiconductor (figure 13, upper panels; see also figure 5, central uppermost panel) in the semi-infinite semiconductor region would produce a variation in the potential line-up Z 4π e2 z2 1nGa(Al) 1vbulk = − bulk (z) dz a0 across the interface (see equation (15), a = a0 /2 and the additional factor 12 accounts for the fact that, in the metal/semiconductor system, the substitutions are performed only on one side of the junction), which is a bulk quantity and satisfies the transitivity rule. In the LDA-SCF calculations the additional bulk terms yield 1vbulk (Al/AlAs) − 1vbulk (Al/GaAs) = 0.41 eV = 1V (AlAs/GaAs). (z) of the Al/hGa1/2 Al1/2 i The actual response 1nGa(Al) i As (100) junction to the substitution of the ith cation plane from the interface coincides with the bulk semiconductor’s Ga response 1nGa(Al) bulk (z) for large i. The responses 1n1 (z) Al and 1n1 (z) are represented in figure 13 for the As-terminated junction (lower panels). Figure 13 shows (z) is similar to 1nGa(Al) that even 1nGa(Al) bulk (z), except 1 for the presence of a small dipolar asymmetry due to the proximity of the metal. Assuming thus a linear , the deviation from superposition of the responses 1nGa(Al) i P the bulk trend is given by i diGa(Al) , where Z Ga(Al) 2 = 4π e (z) dz z1nGa(Al) di i are the microscopic dipoles induced by the asymmetrical (z) for substitutions near the junction (see 1nGa(Al) i figure 13, di ≈ 0 for i > 3). The calculated interfacespecific correction to the transitivity rule obtained with this P approach: i (diAl −diGa ) is −0.02 eV for the As-terminated interface and about −0.2 eV for the cation-terminated interface [80], in very good agreement with the LDA-SCF results of figure 11. This atomic-scale study of the electronic response to the substitutions allows one thus to explain, in terms of the microscopic properties of the charge density in the 1289
M Peressi et al
Charge density (electrons/cell)
10
(a)
10
(b)
9
9
8
8
7
7
6
6
0.5
0.5
0.0
0.0 −15
−10
−5
0
z (A)
5
−15
−10
−5
0
5
z (A)
Figure 12. The planar average of the charge density in the Al/GaAs(100) As-terminated junction (full line). Comparison with the planar-averaged charge densities of the two bulk materials (dotted line) forming the junction (a). Contribution of the MIGS to the total charge density (b); the dotted line indicates the contribution of the states with energies below the GaAs valence band edge. The lower panels show the macroscopic average of the difference between the interface and bulk charges (a), which depends on the arbitrary choice of the interface, and the charge density contribution of the MIGS (b). (From [80].)
junctions, the observed correlation between the band-offset and Schottky-barrier trends. The results show that the dependence of the line-up on the alloy composition can be decomposed into two contributions. A first (dominant) bulk contribution depends only on the semiconductor material and is related to the charge-density building blocks emphasized in the LRT description of the band offsets. This contribution is always present and analogous to the bulk term 1Viso (see equation (17)) in the line-up of heterovalent semiconductor heterojunctions. The second contribution is interface related, accounts for the deviation from the transitivity rule and derives from local dipoles produced by changes in the alloy composition within mainly the last semiconductor plane in contact with the metal. For the polar Al/GaAlAs(100) junctions, this contribution is relevant thus only in the case of the cation-terminated junctions. It should be noted in this connection and when comparing with experiment that a Ga–Al exchange reaction is known to occur in the Al/GaAs(100) junctions (driven by the large heat of formation of AlAs), yielding excess Al on the cation sites near the interface [82]. When the LDA-SCF calculations are performed for Al/GaAlAs(100) junctions containing one (or several) AlAs bilayers at the interface, the deviations from the transitivity rule become very small, of the order of 10−3 eV [73], both for the cation- and for the anion-terminated junction, in close agreement with the experimental data in figure 11. The effect of hydrostatic pressure on the Schottky barrier of the defect-free Al/GaAlAs(100) junctions has been investigated using the same ab initio techniques [73]. Consistently with the experimental data, the pressure 1290
dependence of the p-type barrier was found to be negligible and that of the n-type barriers to coincide with that of the semiconductor band gap, both for direct-and for indirectgap Ga1−x Alx As. Similarly to the alloy-composition trend, the pressure dependence of the Schottky barriers could be explained in terms of bulk properties derived from LRT. In the case of the pressure dependence, the relevant bulk quantities are the absolute band-edge deformation potentials and more precisely those of the semiconductor, because the absolute deformation potential of the metal’s Fermi level is a vanishing quantity. The experimental pressure trends of the p-type and n-type barriers, that had previously been interpreted as being inconsistent with an intrinsic pinning mechanism and as evidence of a pinning to defects with bonding character, were shown instead, in [73], simply to derive from the appropriate band-edge deformation potential of bulk GaAlAs. Contrary thus to some recent proposals [74, 78, 79], both the pressure and the alloy-composition dependences of the Al/GaAlAs Schottky barrier could be fully accounted for without invoking a defect-induced Fermi-level pinning. The composition and pressure dependences of the barrier and the transitivity property of the Al/GaAs, Al/AlAs and GaAs/AlAs band discontinuities could be consistently explained by extending to metal–semiconductor interfaces the LRT schemes employed in the study of band offsets. These studies of the epitaxial Al/GaAlAs system show, however, that, although the pressure and composition variations of the barrier are dominated by the same bulk mechanisms as those that determine band offsets at isovalent semiconductor heterojunctions, the absolute value of the Schottky barrier depends on interface-specific
0.30
0.08
0.20 0.04 0.10 0.00
0.00 -0.10
potential (eV)
∆n (electrons per unit cell)
Band engineering at interfaces
-0.04 -0.20 -0.08
-0.30
0.30
0.08
0.20 0.04
d1(Ga)
0.10
d1(Al)
0.00
0.00 -0.10
-0.04
potential (eV)
∆n (electrons per unit cell)
Ga1/2Al1/2As Ga Ga1/2Al1/2As Ga1/2Al1/2As Al Ga1/2Al1/2As
-0.20 -0.08
Ga1/2Al1/2As Ga
-0.30
Al
Ga1/2Al1/2As Al
Al
Figure 13. Charge (full line) and potential (broken line) profiles induced by a single Al or Ga plane substitution in the Al1/2 Ga1/2 As(100) semiconductor homojunction (top panels) and within the semiconductor near the interface in the Al/Al1/2 Ga1/2 As(100) heterojunction (bottom panels). The charges and potentials were macroscopically averaged with a filter having the periodicity of the metal. (From [73].)
features such as the semiconductor termination and is not a bulk property. In this respect, the treatment of the Schottky barrier examined here presents some analogies with that of the band offset at heterovalent polar interfaces. Finally, we also note that we focused on rather ideal epitaxial systems and our conclusion concerning the relative importance of defect-related versus intrinsic mechanisms in determining the barrier trends need not apply to other, more complex (for example, involving more reactive metals or transition metals) metal–semiconductor systems. 6. Band offset tuning 6.1. Tuning with ‘bulk’ strain and composition In section 3, we showed that, for lattice-matched isovalent semiconductor heterojunctions, the VBO is mostly determined by the bulk properties of the constituents. Interface details such as orientation and stoichiometry play a very minor role in determining the VBO, even in the case
of no-common-ion heterojunctions, for which the atomic interdiffusion can considerably change the compositioninduced interfacial strain. Using only isovalent materials, the only way to tune the offset is to act on the bulk rather than on the interface. This can be done with bulk strain (see section 4) or with alloying. The variation of the VBO as a function of the alloy composition has been studied for the Inx Ga1−x As/Iny Al1−y As(001) heterojunction [83]. The small lattice mismatch between GaAs and AlAs can be neglected and the system can be considered lattice matched when x = y, without introducing an appreciable error into the calculations. As we discussed in section 2.1, th (x) exhibit the calculated equilibrium lattice parameters aeq positive deviations from the experimentally observed linear behaviour when the alloys are described using VCA. Such deviations disappear if the alloy is described using true (rather than virtual) atoms. It is therefore reasonable to use Vegard’s law for the lattice parameter and calculate the electronic structure using the VCA. 1291
M Peressi et al
considering a unique reference crystal for all the interfaces, independently of the alloy composition; the perturbations on the two sides of the interfaces are, in general, not equal in magnitude and opposite in sign (in contrast to 1V) and the on-site quadratic terms of the response therefore do not necessarily cancel out in the potential line-up. On the other hand, if one considers instead the optimal reference virtual crystal for each composition, it depends on x (C(x) = h Inx Ga(1−x)/2 Al(1−x)/2 i); the potential line-up is therefore not linear with the composition since, in principle, both the response function and the perturbation recovering the actual interface (1vC = (1−x)(vGa −vAl )/2) depend on x. Similar arguments would predict a possible non-linearity in the VBO even at GaAs/Ga1−x Alx As interfaces; however, due to the similarity of the dielectric properties and lattice parameters of GaAs and AlAs, one should expect a very small effect in this case, which is indeed experimentally observed [3]. 6.2. Tuning with interlayers Figure 14. The VBO at an In1−x Gax As/In1−x Alx As(001) heterojunction as a function of the alloy composition x (inset). The error bars indicate the range of the experimental data. The main panel emphasizes the deviation from the linear interpolation between the two end points. Circles are from supercell LDA-SCF calculations of [83]; the full line is a quadratic fit, given as a guide to the eye; and the diamond is from similar pseudopotential calculations from [84].
The VBO varies with composition from 0 eV for x = 1 to 0.58 eV for x = 0, for the case of the GaAs/AlAs interface. Spin–orbit splitting [36] and many-body corrections to the valence band maximum are included in these values. For the many–body correction an interpolation between the values calculated by Zhu and Louie (table XIV of [27]) for the end-point materials and the 50%–50% alloys was used. The VBO(x) has a significant negative bowing with respect to the linear interpolation between the two end points (see figure 14). For x = 0.53, when the system is lattice matched to InP, the calculated VBO is 0.19 eV, in the range of the experimental measurements [3] and in agreement with other pseudopotential calculations predicting the same deviations from linearity [84]. The effects of a possible ordering in the alloys have been estimated by calculating the offset for the limiting case of maximum ordering, namely for the interface between (InAs)1 (GaAs)1 and (InAs)1 (AlAs)1 (001) superlattices. Taking into account also the internal distortions, the total effect on the VBO is of the order of 50 meV in the direction of partially reducing the bowing. We would like to stress that, even though the VBO is linear in the perturbation 1V (equation (9)) leading from the optimal virtual crystal to the interface, this does not imply a linear behaviour of the VBO with x. In addition to the bulk band structure term, also the potential-line-up term, following the present scheme, can exhibit a bowing with x. For the potential line-up, in particular, this can be understood from two different points of view. First, by 1292
The peculiarity of heterovalent interfaces leads naturally to a practical way of modifying the offset at isovalent heterojunctions such as GaAs/AlAs, or even of creating an offset at a homojunction. Let us examine first the case of homojunctions and consider the following (001) growth sequence: . . . As–Ga–As–hGe1/2 Ga1/2 i–hGe1/2 As1/2 i–Ga– As–Ga. . .. Ideally, this sequence of atomic planes can be obtained from bulk GaAs in two steps: creating first a hGa1/2 Ge1/2 i-terminated GaAs/Ge interface and then transforming back the Ge half space to GaAs with a hGa1/2 Ge1/2 i-terminated GaAs/Ge interface shifted by one interplanar spacing, a0 /4. These are precisely the two inequivalent GaAs/Ge interfaces discussed in section 3.2; therefore, using the difference between the VBOs of these two inequivalent interfaces a net potential drop 1V = π e2 /(a0 hεi) is predicted for the above transformation. This potential drop is the same as that which would result from a microscopic capacitor [85] whose plates are placed at a distance a0 /4, carry a surface charge σ = e/a02 and are filled with a material whose dielectric constant is the same as that of the virtual crystal. The above sequence of atomic planes can also be thought of as due to the transfer of a proton per atomic pair from the As to the Ga planes [44]. Within LRT this viewpoint is easily generalized to arbitrary concentrations of Ge in a pair of consecutive compensated GaAs planes, hGex Ga1−x ihGex As1−x i (this ensures local charge neutrality). In this case, one has 1V (x) = 2π e2 x/(a0 hεi(x)), where hεi(x) is the effective dielectric constant of the reference system whose optimal choice is a bulk alloy having the same composition as the doped region between the two plates of the microscopic capacitor. The corresponding dielectric constant is hεi−1 (x) = (1 − x)εh−1 + xεi−1 [86], where h indicates the host material, GaAs, and i the interlayer, Ge. Following this reasoning, the behaviour of the VBO at small doping (x → 0) depends on the host material, whereas at high doping (x → 1) it is dominated by the electrostatic screening of the dopant. The excellent agreement between the simple predictions of LRT and
Band engineering at interfaces
VBO(x) = VBOI ±
πe2 x[(1 − x)εh−1 + xεi−1 ] a
(23)
εh−1
where is, in this case, the average of the inverse dielectric constants of GaAs and AlAs. In figure 15, the predictions of LRT are compared with full supercell LDA-SCF calculations [86] and experimental data [88] for the GaAs/Si/AlAs VBO, as a function of the Si coverage which is 2x (measured in atomic monolayers, so that x = 1 corresponds to a full Si bilayer). The supercell calculations were performed using the VCA for x < 1 to describe the two consecutive doped atomic layers at the interface. The results compare well with experiment [88] up to a coverage 2x ≈ 0.5, whereas a substantial disagreement appears for higher coverages. Such a disagreement between theory and experiments should be ascribed to the simple picture of dopants confined to two atomic planes, rather than to numerical inaccuracies of the calculations such as the neglect of microscopic relaxation of the atomic positions, which is a very small effect (according to the test performed for the limit x = 1, for which it should be more relevant). The model of the microscopic capacitor is adequate for thin interlayers, but it cannot be extended to the thickcoverage limit. It would predict a dipole monotonically increasing with coverage, which cannot be reconciled with the energetic stability of the junction; furthermore, in the limit of two isolated interfaces, each of them must be individually neutral, as previously discussed. Experimental measurements [49] in AlAs/Ge/GaAs(001) and GaAs/Ge/AlAs(001) single-quantum-well structures with thick Ge interlayers (2–16 monolayers) show that the band offset between GaAs and AlAs across the interlayer is independent of its thickness in the range investigated and that it is different from that directly measured at the GaAs/AlAs interface; this suggests that two neutral and inequivalent interfaces are established even at such thicknesses. This situation is analogous to the lack of transitivity that is observed in the case of isolated III–V/Ge, ZnSe/III–V and ZnSe/Ge interfaces, which we discussed in section 3.2. 7. Schottky barrier tuning 7.1. Bulk composition and strain effects We have seen that Schottky barrier changes as large as 0.5 eV could be induced in the prototypical epitaxial
2.0 supercell, ideal supercell, relax
VBO (eV)
full supercell LDA-SCF calculations [86] confirms the soundness of the physical picture underlying this LRT approach. Analogous considerations hold for other polar orientations, such as (111), and also for compensated heterovalent interlayers embedded within a group IV element bulk. In fact, the existence of a measurable potential drop across a GaAs interlayer embedded in Ge along (111) has been detected experimentally [87]. The above results can be generalized to the heterojunctions, for example by doping a GaAs/AlAs interface with ultra-thin layers of Si or Ge. In this case, the band offset is the sum of an intrinsic term, VBOI , plus a doping contribution. If the Si dopant atoms are assumed to be uniformly distributed over two consecutive atomic layers, the VBO is simply
1.0
AlAs/Si/GaAs
0.0
GaAs/Si/AlAs LRT experiment
-1.0 0.0
0.5
1.0 1.5 Si coverage
2.0
Figure 15. The VBO at GaAs/AlAs heterojunctions as a function of the coverage 2x of a Si interlayer. Circles: LDA-SCF supercell calculations with ideal unrelaxed zincblende atomic positions; squares, experimental results from [88]; and full line, predictions of LRT. Triangles indicate results of calculations performed allowing a full microscopic relaxation of the atomic positions, due to the lattice mismatch between Si and GaAs/AlAs. (From [86].)
Al/Ga1−x Alx As(100) system considered in section 5, by altering the alloy composition of the semiconductor. The barrier modification was shown to be dominated by the same bulk mechanism as that responsible for determining the value of the band offsets at isovalent semiconductor heterojunctions. Similar LDA-SCF calculations have been carried out also for abrupt (110)-oriented Al/Ga1−x Alx As junctions. A comparative study of the Schottky barriers for the (100) and (110) orientations has been reported in [73]. The study shows that although the values of the barriers for the abrupt (110) junctions are 0.1–0.4 eV lower than those in the (100) junctions and depend on the interface geometry, for a given (meta)stable interface geometry, the (110) junctions exhibit the same (bulk) barrier variation with the alloy composition as do the (100) As-terminated junctions. This trend with the alloy composition is not substantially affected by deviations from stoichiometry which may occur in the interface region. We have seen (section 5) that localized isovalent substitutions such as Ga:Al affect the line-up only when they are performed within a few atomic layers far from the interface and their effect on the line-up does not exceed 0.1 eV for a deviation in stoichiometry 1x = 0.5. In addition, as will be shown in the next section, the ‘screening’ describing the response of MIGS to localized dipolar perturbations produced by heterovalent substitutions at the interface is significantly larger than that in a semiconductor heterojunction. In the case of a heterovalent Si bilayer at the Al/GaAs(100) interface, the electronic response reduces the local interface dipole induced by the bilayer by a factor of about 50. For a given metal and a fixed interface geometry one may expect 1293
thus to obtain reasonable estimates for Schottky barrier trends with semiconductor alloying by using band-offset data and the transitivity rule (equation (22)). Experimentally, the transitivity rule works surprisingly well, in general, for junctions (even non-epitaxial ones) involving covalent III–V compounds or alloys, and metals which are neither highly reactive nor transition metals [1]. The bulk trend is observed, most often, in junctions used for transport measurements which have been annealed for fabrication of the contacts. This strong bulk dependence on the semiconductor’s composition can thus be exploited in practice to modify Schottky barriers substantially. For a fixed interface geometry, the variation of the barrier with metal composition is much smaller, in general (for covalent semiconductors, see below), than the change achievable through modification of the semiconductor’s composition. It should be noted that, because the Fermi levels align across any metal–metal junction, for a given semiconductor any change in the barrier with the metal composition leads to a deviation from the transitivity rule and reflects thus the non-bulk nature of the Schottky barrier. Using the epitaxial geometry illustrated in figure 10 (for the type I junction), LDA-SCF calculations similar to those presented for the variation with alloy composition of the Al/GaAlAs(100) Schottky barrier have been performed also to probe the influence of a change in the chemical composition of the metal [89]. Replacing the Al atoms in Al/GaAs(100) junctions by other simple metal atoms, either isovalent such as Ga or heterovalent such as P, modifies the barrier by 0.1 eV or less. These barrier changes are fully established by modifying only the composition of the first 1–2 metallic layers near the interface. This is in strong contrast to the mostly transitive behaviour observed for the semiconductor alloy composition and further illustrates the non-bulk character of the dependence of the barrier on the metal’s composition. Ga and P both have a higher electronegativity than does Al (the difference of electronegativity with respect to Al is 1X = 0.1 and 0.6 for Ga and P, respectively, on Pauling’s scale). For the junctions in which Ga (P) has been used instead of Al the calculated value of the p-type Schottky barrier is 0.05 eV (0.10 eV) lower than that of the reference Al/GaAs(100) system. This trend is in qualitative agreement with the well known empirical rule φn (M, s) = S(s)XM + φ0 (s), where XM is the electronegativity of the metal (M) (which is also related to the metal’s work function, 8M , by the empirical relation 18M = A1XM , A ≈ 2.3 eV), and S(s) and φ0 (s) are constants for a given semiconductor (s) [90]. From a compilation of experimental data, S(s) is found to be about 0.1 (using electron-volt units) for the most covalent semiconductors such GaAs and Si, and increases with the semiconductor’s ionicity to values as large as 0.7 for ZnSe and 1.2 for ZnS [91]. The effect of the semiconductor’s ionicity on the S(s) parameter has been investigated by Louie et al [92]. In pioneering studies of metal–semiconductor systems using the LDA-SCF pseudopotential approach, those authors examined the electronic structure of prototypical group IV, III–V and II–VI semiconductors (Si, GaAs, ZnSe, and 1294
φp (eV)
M Peressi et al
1.2 1.1 1.0 0.9 0.8 0.7 0.6 0.5 0.4 0.3
As-terminated Ga-terminated
0
0.5 1 1.5 Si coverage (ML)
2
Figure 16. The Schottky barrier height of Al/Si/GaAs(100) diodes as a function of the Si coverage. The full circles are the results of the self-consistent calculations; the open triangles correspond to the experimental data of [96] for Si grown under As (M) and Al (O) fluxes. The full lines give the predictions of the capacitor model (see the text, equation (25)); the broken lines indicate the model predictions at low coverage in the linear regime. (From [97].)
ZnS) of increasing ionicity in contact with a jellium. On the basis of their results, they could explain the trend of the phenomenological S parameter in terms of the atomicscale properties of the MIGS. The central quantities are the decay length of the MIGS (δ) and their surface densities of R0 states at the interface defined as Ds = −∞ N (�F , z0 ) dz0 , where N (�F , z) is the LDOS at the Fermi energy (see equation (8)), z = 0 indicates the position of the interface and −∞ a position well inside the semiconductor where the MIGS vanish. Both δ and Ds were shown to decrease significantly with the semiconductor’s ionicity (by a factor of two on going from GaAs or Si to ZnS). The analysis of the S term is based on the following relation: S = A/(1 + 4π e2 Ds δeff )
(24)
where δeff = ts0 + δ/�s is an effective distance for charge transfer between the metal surface and the MIGS; ts0 = ˚ is the typical screening length used for the metal 0.5 A and �s ≈ 2 determines screening in the semiconductor. Equation (24) was obtained by following an approach developed by Cowley and Sze [93] and Heine [60], in which the response 1v to a change in the metal work function, 18M = A1XM , describing the change in the Schottky barrier 1φn = A1XM + 1v, is modelled by a dipolar term 1v = −4π e2 1qδeff with 1q = Ds 1φn . Such a dipole describes charge transfer from the metal surface to the MIGS, which occurs over a distance δeff . The charge 1q = Ds 1φn is that induced (to the first order) by a change in the Fermi level 1φn into a MIGS reservoir characterized by a surface charge per unit energy Ds . The results obtained by Louie et al [92] using this model and the computed values for Ds and δ yield a very good description of the experimental trend and values of the S parameter.
Band engineering at interfaces
IV
III
II
Local density of states (arb. units)
εF
I
0.06
θ = 2 ML
0.05
θ = 0 ML
φp V
0.04
IV
0.03
III II
0.02
I
−2
−1
−10
0 1 ε (eV)
2
−5 z (A)
Ds(z) (A−2 eV−1)
V
0.01 0
0.00
Figure 17. The surface density of states at the Fermi energy without Si and with two monolayers of Si at z = 0 (see the text). The full line (broken line) corresponds to the As (Ga)-terminated interface. The inset shows the local density of states within the semiconductor’s band gap at increasing distances from the interface. The local densities are evaluated at the centre of the regions shown in the upper part of the figure. (From [97].)
The effects of selected perturbations of the atomic structure on the prototypical epitaxial Al/GaAs(100) system have also been investigated using LDA-SCF calculations (for the As-terminated configuration in figure 10) [94]. The influence of microscopic distortions on the metal side of the junction (displacements of atomic planes near the interface) and of macroscopic uniaxial strains on the metal were found to have very little effect on the Schottky barrier. For instance, a 3% uniaxial bulk strain or a 3% displacement of the Al layer at the interface modifies the barrier by only 0.01 eV. This is in contrast to the observed sensitivity of the barrier to the details of the atomic structure on the semiconductor side of the junction. These results could be rationalized in terms of the vanishing absolute deformation potential of the metal’s Fermi level and the properties of the dynamical effective charges in the junctions [94]. 7.2. Tuning with interlayers Considerable changes in the Schottky barrier height of metal contacts to covalent semiconductors, such as Si and GaAs, have been achieved in recent experiments, by controlling the chemical and/or structural properties of the interface [95, 96]. In particular, Schottky barriers with a 1 eV wide tunability in Al/GaAs(100) junctions engineered with ultra-thin (0–2 monolayers) Si interlayers were reported [96]. We will discuss here the effect of
heterovalent interlayers in abrupt Al/GaAs(100) junctions and show that such a tuning can be explained in terms of microscopic mechanisms similar to those illustrated for semiconductor heterojunctions. This discussion is based on the results of recent LDA-SCF calculations for the Al/Si/GaAs(100) system presented in [97]. The epitaxial type-I and type-II geometries, shown in figure 10, were used to model the initial (undoped) Al/GaAs(100) junctions. Si interlayers with coverages θ in the range 0–2 monolayers were then introduced by replacing by Si an equal number of Ga and As atoms in the GaAs bilayer closest to the metal. This doping produces a bare ionic dipole 1Vb = ±π e2 θ/a0 (see section 6.2), where a0 is the GaAs lattice parameter, which tends to increase (decrease) the p-type Schottky barrier at the As-terminated (Ga-terminated) interface. The magnitude of this dipole is about 16 eV for θ = 2. Such a dipole will be significantly reduced by electronic screening at the metal–semiconductor junction. This can be inferred from figure 16, in which the Schottky barriers obtained from the LDA-SCF calculations are displayed as a function of the Si coverage together with the measured [96] Al/Si/GaAs barriers. The theoretical values include spin–orbit and many-body corrections to the LDA band-structure terms, evaluated in [71]. For both terminations, the dipole produced by the Si, which is responsible for the change in the barrier 1φp , has been reduced from 16 to 0.35 eV for θ = 2, which corresponds to 1295
M Peressi et al
35
1.2
30 25
εeff
φp (eV)
1.1 1.0
20
0.9
15
8
ε(GaAs)
0.8
−10
−5 z (A)
0
10
Figure 18. The Schottky barrier (filled squares, left-hand scale) and effective screening (filled diamonds, right-hand scale) as functions of the interlayer position of Si within the semiconductor. The symbols give the results of self-consistent calculations for a Si coverage θ = 0.5. Their size indicates the estimated inaccuracy of the numerical results. The full lines correspond to the predictions of equation (25) in the linear-coverage regime. (From [97].)
an effective screening �eff = 1Vb /1φp of about 50. This yields a difference of about 0.8 eV between the barriers of the As-terminated and Ga-terminated interfaces with two monolayers of Si, in very good agreement with the experimental data in figure 10. The non-linear dependence of φp (θ) in figure 16 shows that �eff depends on the Si coverage: �eff varies from about 30 at small θ to about 50 at θ = 2. We have seen (section 6.2) that the screening of a dipole created by Si interlayers analogously grown at GaAs/GaAs homojunctions could be explained in terms of the dielectric constant of GaAs at low coverages and of the dielectric constant of Si at a coverage of about two monolayers. Here �eff is 3–5 times larger than the dielectric constants of GaAs and Si. There is thus a drastic enhancement of the screening related to the presence of the metal. The screening of such a Si dipole layer in the metal– semiconductor junction at a position z from the metal and for a coverage 0 ≤ θ ≤ 2 can be described by a microscopic capacitor model [97]: (GaAs) + 4πe2 Ds (z)δ �eff (θ, z) = �∞ θ (Si) (GaAs) − �∞ + 4πe2 [Ds0 (z) − Ds (z)]δ} (25) + {�∞ 2 which is a generalization of the model previously introduced (with Ds = Ds0 = 0) to describe the band-offset modifications produced by the Si interlayers (GaAs) (Si) and �∞ the in the GaAs homojunction (with �∞ electronic dielectric constants of GaAs and Si) [98]. The additional susceptibility χM = (�eff |Ds ,Ds0 − �eff |0,0 )/(4π ) is explained, using equation (25), in terms of the MIGS (see section 7.1) and more precisely in terms of their decay length δ and surface density at the Fermi energy without Si,
1296
Ds (z), and with two monolayers of Si, Ds0 (z). The surface density of states is evaluated at the position of the dipole Rz z, namely, Ds (z) = −∞ N (�F , z0 ) dz0 . Figure 17 shows the surface densities of states Ds (z) and Ds0 (z) of the Asand Ga-terminated interfaces, obtained from the LDA-SCF calculations. The surface densities of states for the two terminations are very similar and decay exponentially in the semiconductor with essentially the same decay length ˚ (δ ≈ 3 A). Using equation (25), one finds that at low Si coverage (θ → 0), the contribution of the MIGS to the potential line-up induced by a small change 1v in the Fermi-level position is −4π χM 1v = −4π e2 Ds (z)1vδ, consistently with the result expected from simple electrostatic arguments [93]. At higher Si coverage (0 < θ ≤ 2), the last term on the right-hand side of equation (25) includes the gradual change in the susceptibility due to the modifications of the host semiconductor and MIGS with the Si doping. Using the capacitor model in equation (25) and the values of the parameters obtained from the ab initio calculations, one finds the coverage dependence indicated by the full line in figure 16, which compares well with the self-consistent results. It should be emphasized that most of the nonlinearity in φp (θ ) is due to the large difference between Ds0 (0) and Ds (0) in equation (25); the difference between (GaAs) (Si) �∞ and �∞ plays only a minor role. Furthermover, from equation (25) the symmetry in the barrier variations of the two interfaces, in figure 16, can be understood from the similarity of their Ds (0) (and Ds0 (0)) values (see figure 17). The correlation between the local-dipole screening and the spatial decay of the MIGS, which is explicit in equation (25), has also been probed by moving the Si dipole layer away from the interface into the semiconductor.
Band engineering at interfaces
Given the exponential decay of Ds (z) in the semiconductor, (GaAs) �eff (θ = 0, z) should exponentially converge to �∞ with a similar decay length. The results for �eff (z) obtained from the LDA-SCF calculations for a coverage θ = 0.5 are displayed in figure 18 together with the corresponding Schottky barrier values. The exponential decay length of (GaAs) �eff (z) towards �∞ is similar to that of Ds (z) and the results closely follow the dependence predicted by equation (25) in the linear-coverage regime. The very good agreement, in figure 18, between the predictions of the model and the results of the ab initio calculations further confirm the soundness of the MIGS-based description used to explain the screening of the local interface dipoles at the metal–semiconductor junction. 8. Conclusions Considerable progress in understanding and controlling the band line-up at semiconductor contacts has been achieved in recent years by combined experimental and theoretical efforts. Progress for metal–semiconductor junctions has lagged somewhat behind that for semiconductor heterojunctions due to the higher complexity of the corresponding atomic and electronic structures. New developments in computational physics have made possible accurate ab initio calculations of the electronic structure of semiconductor contacts and the complexity of the systems which can be examined is steadily increasing. These computations can be used to study the effects of various microscopic features in numerical experiments and to derive models which, within clearly defined limits of applicability, retain the same accuracy as the calculations from which they are derived. In the present review we illustrated the basic points of a state-of-the-art theoretical approach which allowed us not only to compute band discontinuities for the various classes of heterojunctions but also to obtain insight into the atomic-scale mechanisms which determine the band line-ups and to interpret and predict their trends. There remains a number of unresolved issues, which still limit the predictive capability of theoretical schemes. The most important concerns the mechanisms responsible for the actual atomic-scale arrangement at the interfaces and their kinetic versus thermodynamic character. A better understanding of these mechanisms and the possibility of predicting the morphology of the epitaxial structures which are actually established would clearly improve our ability to engineer interface parameters. Another important related issue concerns the presence of localized interface states in heterojunctions, their origin and their role in determining the electronic characteristics of the junctions. These issues are being addressed experimentally and should receive more theoretical attention in the near future. Acknowledgments Two of us (M P and A B) would like to express special thanks to their friends and colleagues S Baroni and R Resta: most of the work presented here for semiconductor
heterojunctions and the LRT method comes from the long and fruitful collaboration with them. We would like also to thank all our coworkers over the years, in particular J Bardi, C Berthod, L Colombo, M Di Ventra, but also F Favot, B Montanari, E Molinari, K M¨ader, M Lazzouni, N Tit and A Valente. We also acknowledge valuable discussions with A Franciosi, L Sorba, F Beltram, P Giannozzi, S De Gironcoli and A Dal Corso. The work at the EPFL was supported by the Swiss National Science foundation under grant 20-47065.96. The work in Trieste was funded in part by the Consiglio Nazionale delle Ricerche of Italy under the programme Progetto Coordinato Calcolo Parallelo in Materia Condensata.
References [1] Capasso F and Margaritondo G (eds) 1987 Heterojunction Band Discontinuities: Physics and Device Application (Amsterdam: North-Holland) [2] Margaritondo G (ed) 1988 Electronic Structure of Semiconductor Heterojunctions (Dordrecht: Kluwer) [3] Yu E T, McCaldin J O and McGill T C 1992 Solid State Physics vol 46, ed H Ehrenreich and D Turnbull (Boston, MA: Academic) p 1 [4] Franciosi A and Van de Walle C G 1996 Surf. Sci. Rep. 25 1 [5] Rhoderick E H and Williams R H 1988 Metal–semiconductor Contacts ed P Hammond and R L Grimsdale (Oxford: Clarendon) [6] M¨onch W (ed) 1990 Electronic Structure of Metal–Semiconductor Contacts (Dordrecht: Kluwer) [7] Brillson L J 1992 Handbook on Semiconductors vol 1, ed P T Landsberg (Amsterdam: North-Holland) p 281 [8] Brillson L J (ed) 1993 Contacts to Semiconductors (Park Ridge: Noyes) [9] Tersoff J 1984 Phys. Rev. B 30 4874 Tersoff J 1985 J. Vac. Sci. Technol. B 3 1157 Tersoff J 1986 Surf. Sci. 168 275 Tersoff J 1986 Phys. Rev. Lett. 56 675 [10] Flores F and Tejedor C 1987 J. Phys. C: Solid State Phys. 20 145 Guinea F, S´anchez-Dehesa J and Flores F 1983 J. Phys. C: Solid State Phys. 16 6499 Tejedor C and Flores F 1978 J. Phys. C: Solid State Phys. 11 L19 [11] Baroni S, Resta R, Baldereschi A and Peressi M 1989 Proc. NATO Advanced Research Workshop on Spectroscopy of Semiconductor Microstructures ed G Fasol et al (New York: Plenum) p 251 [12] Baldereschi A, Peressi M, Baroni S and Resta R 1993 Proc. Int. School of Physics ‘Enrico Fermi’ (Course CXVII, Varenna, 1991): Semiconductor Superlattices and Interfaces ed L Miglio and A Stella (New York: Academic) p 59 [13] Baroni S, Peressi M, Resta R and Baldereschi A 1993 Proc. 21th Int. Conf. on the Physics of Semiconductors ed Ping Jiang and Hou-Zhi Zheng (Singapore: World Scientific) p 689 . [14] Hoenberg P and Kohn W 1964 Phys. Rev. 136B 864 [15] Kohn W and Sham L J 1965 Phys. Rev. 140A 1133 [16] Lundqvist S and March N H (eds) 1983 Theory of Inhomogeneus Electron Gas (New York: Plenum) [17] See for instance Martin R M 1985 Electronic Structure, Dynamics and Quantum Structural Properties of Condensed Matter ed J T Devreese and P Van Camp (New York: Plenum) p 175 [18] Jones R O and Gunnarson O 1989 Rev. Mod. Phys. 61 689 1297
M Peressi et al [19] Cohen M L 1985 Int. School of Physics ‘Enrico Fermi’ (Course LXXXIX, Varenna, 1983): Highlights of Condensed–Matter Theory ed F Bassani et al (Amsterdam: North-Holland) p 16 [20] Ceperley D M and Alder B J 1980 Phys. Rev. Lett. 45 566 Perdew J and Zunger A 1981 Phys. Rev. B 23 5048 [21] Pickett W E 1989 Computer Phys. Rep. 9 115 and references therein [22] Nielsen O H and Martin R M 1983 Phys. Rev. Lett. 50 697 Nielsen O H and Martin R M 1985 Phys. Rev. B 32 3780 Nielsen O H and Martin R M 1985 Phys. Rev. B 32 3792 [23] Baldereschi A 1973 Phys. Rev. B 12 5212 Chadi D J and Cohen M L 1973 Phys. Rev. B 8 4547 Monkhorst H J and Pack J P 1976 Phys. Rev. B 13 5188 Froyen S 1989 Phys. Rev. B 39 3168 [24] Fu C L and Ho K M 1983 Phys. Rev. B 28 5480 [25] Hybertsen M S and Louie S G 1986 Phys. Rev. B 34 5390 Hybertsen M S and Louie S G 1987 Phys. Rev. B 34 5602 Hybertsen M S and Louie S G 1987 Phys. Rev. B 35 5585 [26] Zhang S B, Tom´anek D, Louie S G, Cohen M L and Hybertsen M S 1988 Solid State Commun. 66 585 [27] Zhu X and Louie S G 1991 Phys. Rev. B 43 14 142 [28] Peressi M and Baroni S 1994 Phys. Rev. B 49 7490 [29] Peressi M, Baroni S, Baldereschi A and Resta R 1990 Phys. Rev. B 41 12 106 [30] Baldereschi A, Baroni S and Resta R 1988 Phys. Rev. Lett. 61 734 [31] Jackson J D 1975 Classical Electrodynamics (New York: Wiley) [32] The use of a filter function of a generic shape does not eliminate completely, in general, the oscillations of the original function [33] Kleinman L 1981 Phys. Rev. B 24 7412 [34] The total VBO (φp ), which is the quantity that is physically meaningful, turns out to be almost pseudopotential independent. Conversely, for a given choice of the definition of the potential line-up and the band term, different pseudopotentials can give remarkably different results for the two terms separately [12] [35] Baldereschi A, Resta R, Peressi M, Baroni S and M¨ader K 1993 Proc. NATO Advanced Research Workshop on ‘The Physical Properties of Semiconductor Interfaces at the Sub-Nanometer Scale’ ed H W M Salemink and M D Pashley (Dordrecht: Kluwer) p 89 [36] Landolt–B¨ornstein 1982 Numerical Data and Functional Relationships in Science and Technology Group III, 17 a–b (New York: Springer) [37] Peressi M, Montanari B, Baroni S and Molinari E 1996 Proc. 23rd Int. Conf. on the Physics of Semiconductors ed M Scheffler and R Zimmermann (Singapore: World Scientific) p 943 [38] Montanari B, Peressi M, Baroni S and Molinari E 1996 Appl. Phys. Lett. 69 3218 [39] Hybertsen M S 1990 Phys. Rev. Lett. 64 555 [40] Resta R, Baroni S and Baldereschi A 1989 Superlattices Microstruct. 6 31 [41] Baroni S, Resta R and Baldereschi A 1988 Proc. 19th Int. Conf. on the Physics of Semiconductors ed W Zawadzki (Wroclaw: Institute of Physics, Polish Academy of Sciences) p 525 [42] Martin R M 1980 J. Vac. Sci. Technol. 17 978 [43] Kunc K and Martin R M 1981 Phys. Rev. B 24 3445 [44] Harrison W A 1979 J. Vac. Sci. Technol. 16 1492 [45] Bylander D M and Kleinman L 1990 Phys. Rev. B 41 3509 [46] Kunc K and Martin R M 1987 Phys. Rev. B 35 8154 [47] Bratina G, Vanzetti L, Sorba L, Biasiol G, Franciosi A, Peressi M and Baroni S 1994 Phys. Rev. B 50 11 723 1298
[48] The estimate is obtained using the experimental dielectric constants 10.9, 8.2, 15.4, 11.4 and 9.7 for GaAs, AlAs, Ge, Si and ZnSe respectively. In order to compare SCF and LRT results, the corresponding theoretical dielectric constants calculated with the same kinetic energy cut-off and an equivalent number of special points of the supercell SCF calculations must be used instead. [49] Biasiol G, Sorba L, Bratina G, Nicolini R, Franciosi A, Peressi M, Baroni S, Resta R and Baldereschi A 1992 Phys. Rev. Lett. 69 1283 [50] Lazzouni M, Peressi M and Baldereschi A 1996 Appl. Phys. Lett. 68 75 [51] Peressi M, Favot F and Baldereschi A 1997 Advances in Computational Materials Science ed V Fiorentini and F Meloni (Bologna: Societ`a Italiana di Fisica) p 13 [52] Nicolini R, Vanzetti L, Mula G, Bratina G, Sorba L, Franciosi A, Peressi M, Baroni S, Resta R and Baldereschi A 1994 Phys. Rev. Lett. 72 294 [53] Van de Walle C G 1989 Phys. Rev. B 39 1871 Van de Walle C G and Martin R M 1989 Phys. Rev. Lett. 62 2028 [54] Resta R, Colombo L and Baroni S 1990 Phys. Rev. B 41 12 358 [55] Peressi M, Colombo L, Baldereschi A, Resta R and Baroni S 1993 Phys. Rev. B 48 12 047 [56] Colombo L, Resta R and Baroni S 1991 Phys. Rev. B 44 5572 [57] Tit N, Peressi M and Baroni S 1993 Phys. Rev. B 48 17 607 [58] Di Ventra M, Peressi M and Baldereschi A 1996 Phys. Rev. B 54 5691 Di Ventra M, Peressi M and Baldereschi A 1996 J. Vac. Sci. Technol. B 17 2936 [59] Di Ventra M, Peressi M and Baldereschi A 1996 Proc. 23rd Int. Conf. on the Physics of Semiconductors ed M Scheffler and R Zimmermann (Singapore: World Scientific) p 987 [60] Heine V 1965 Phys. Rev. 138A 1689 [61] Spicer W 1993 Semiconductors and Semimetals 38 449 [62] Woodall J M and Freeouf J L 1982 J. Vac. Sci. Technol. 21 574 [63] Zunger A 1981 Phys. Rev. B 24 4372 [64] van Schilfgaarde M, Weber E R and Newman N 1993 Phys. Rev. Lett. 73 581 [65] See, for example, Tung R T in [8] [66] See, for example, Palmstrom C J and Sands T D in [8] [67] Hamann D R 1988 Phys. Rev. Lett. 60 313 [68] Das G P, Bl¨ochl P, Anderson O K, Christensen N E and Gunnarsson O 1989 Phys. Rev. Lett. 63 1168 [69] Fujitani H and Asano S 1994 Phys. Rev. B 50 8681 [70] Zhang S B, Cohen M L and Louie S G 1986 Phys. Rev. B 34 768 [71] Needs R J, Charlesworth J P A and Godby R W 1994 Europhys. Lett. 25 31 [72] Dandrea R G and Duke C B 1993 J. Vac. Sci. Technol. A 11 848 Dandrea R G and Duke C B 1993 J. Vac. Sci. Technol. B 11 1553 [73] Bardi J, Binggeli N and Baldereschi A 1996 Phys. Rev. B 54 R11102 Bardi J, Binggeli N and Baldereschi A 1998 to be published [74] Revva P, Langer J M, Missous M and Peaker A R 1993 J. Appl. Phys. 74 416 [75] Lee J K, Cho Y H, Choe B D, Kim K S, Jeon H I, Lim H and Razeghi M 1997 Appl. Phys. Lett. 71 912 [76] Allen R E and Dow J 1981 J. Vac. Sci. Technol. 19 383 Daw M S and Smith D L 1981 Solid State Commun. 37 205 [77] Shan W, Li M F, Yu P Y, Hansen W L and Walukiewicz W 1988 Appl. Phys. Lett. 53 974 [78] Dobaczewski L, Langer J M and Missous M 1993 Acta Phys. Pol. A 84 741
Band engineering at interfaces
[79] [80] [81] [82] [83] [84] [85]
[86] [87] [88]
Dobaczewski L, Langer J M and Missous M 1995 Proc. 22nd Int. Conf. on the Physics of Semiconductors ed D J Lockwood (Singapore: World Scientific) p 588 Missous M, Truscott W S and Singer K E 1990 J. Appl. Phys. 68 2239 Berthod C, Bardi J, Binggeli N and Baldereschi A 1996 J. Vac. Sci. Technol. B 14 3000 Zhang S B, Cohen M L and Louie S G 1985 Phys. Rev. B 32 3955 Chambers S A 1989 Phys. Rev. B 39 12 664 Valente R, Peressi M and Baldereschi A unpublished Hybertsen M S 1991 Appl. Phys. Lett. 58 1759 Capasso F, Cho A Y, Mohammed K and Foy P W 1985 Appl. Phys. Lett. 46 664 Capasso F, Mohammed K and Cho A Y 1985 J. Vac. Sci. Technol. B 3 1245 Peressi M, Baroni S, Resta R and Baldereschi A 1991 Phys. Rev. B 43 7347 Marsi M, La Rosa S, Hwu Y, Gozzo F, Coluzza G, Baldereschi A, Margaritondo G, McKinley J T, Baroni S and Resta R 1992 J. Appl. Phys. 71 2048 Sorba L, Bratina G, Antonini A, Walker J F, Mikovic M, Ceccone G and Franciosi A 1991 Phys. Rev. B 43 2450
[89] Bardi J, Berthod C, Binggeli N and Baldereschi A unpublished [90] Kurtin S, McGill T C and Mead C A 1969 Phys. Rev. Lett. 22 1433 [91] Schluter M 1978 Phys. Rev. B 17 5044 [92] Louie S G, Chelikowsky J R and Cohen M L 1977 Phys. Rev. B 15 2154 [93] Cowley A M and Sze S M 1965 J. Appl. Phys. 36 3212 [94] Ruini A, Resta R and Baroni S 1997 Phys. Rev. B 56 14 921 [95] Sullivan J P, Tung R T, Eaglesham D J, Schrey F and Graham W R 1993 J. Vac. Sci. Technol. B 11 1564 [96] Cantile M, Sorba L, Yildirim S, Faraci P, Biasiol G, Franciosi A, Miller T J and Nathan M I 1994 Appl. Phys. Lett. 64 988 (1994) Sorba L, Yildirim S, Lazzarino M, Franciosi A, Chiola D and Beltram F 1996 Appl. Phys. Lett. 69 1927 [97] Berthod C, Binggeli N and Baldereschi A 1996 Europhys. Lett. 36 67 [98] For the semiconductor heterojunctions, a weighted average of the inverse dielectric constants was used to interpolate the susceptibility at fractional coverages 0 < θ < 2. The choice of the average, however, has little effect on the present results since the two dielectric constants are close to each other
1299