By constraining the output rate of each host in a cell via DiffServ scheduling and ... Mb/s) sharing the same cell with fast hosts (transmitting at. 11 Mb/s). Here, we ...
Bandwidth Allocation for DiffServ based Quality of Service over 802.11 Martin Heusse, Paul Starzetz, Franck Rousseau, Gilles Berger-Sabbatel, Andrzej Duda LSR-IMAG Laboratory Grenoble, France email: {heusse, starzetz, rousseau, gberger, duda}@imag.fr Abstract— We propose to provide QoS differentiation at the IP level based on the DiffServ model over the standard Distributed Coordination Function (DCF) method of 802.11. By constraining the output rate of each host in a cell via DiffServ scheduling and traffic shaping mechanisms, we can keep the 802.11 network in the state of non-saturation so that the time-sensitive Expedited Forwarding (EF) class benefits from stable short delays. We analyze the performance of 802.11b to find how we should constrain the rate of DiffServ sources and present extensive measurements that show how the QoS differentiation is achieved.
I. I NTRODUCTION Wireless local area networks such as IEEE 802.11 have become popular as access networks to the wireless mobile Internet. Also, an increasing number of applications that may run in such environments require better quality of service than the current Best Effort. Although the IEEE 802.11 standard defines an access method oriented towards time-bounded services (Point Coordination Function - PCF), it is an optional method not implemented in most of current products. So, we are interested in providing quality of service over the mandatory 802.11 access method: the Distributed Coordination Function (DCF) that uses CSMA/CA (Carrier Sense Multiple Access/Collision Avoidance) to allow for contended access to the wireless media. Our approach is based on the idea of constraining traffic sources so that the radio channel of 802.11 stays under saturation and the time-sensitive traffic classes benefit from short delays. We use scheduling and traffic shaping mechanisms based on the DiffServ model to limit the traffic sources. We obtain in this way QoS differentiation between traffic classes at the IP level. As the wireless link is usually the bottleneck of the whole network, applying the DiffServ model to the wireless part can provide consistent IP level quality of service to mobile hosts. However, this approach requires careful configuration of the scheduling and traffic shaping mechanisms, so we need to determine the traffic limits to keep the channel non-saturated. In this paper, we study the behavior of the 802.11 WLAN when various classes of traffic requiring different types of service use the channel at the same time. We show that the time-sensitive DiffServ Expedited Forwarding (EF) class may benefit from short delays as long as the channel is kept non-saturated even if the traffic source competes with flows emanating from other hosts. We can enforce that the channel
remains non-saturated by using the DiffServ scheduling and traffic shaping mechanisms to limit the traffic sources. The mechanisms on different hosts must be coordinated to limit the overall channel load. Surprisingly, we observe that under the non-saturation conditions, the channel load has little influence on the delay of the time-sensitive traffic. In this paper, we explain the reasons of such a particular behavior and derive the limiting rate of traffic sources to keep the radio channel non-saturated. In a companion work, we have shown that a time-sensitive traffic class in the 802.11 WLAN can obtain low delays even in the saturation state provided its packet rate stays below some threshold value [1]. The only situation in which a timesensitive traffic source fails to obtain low delay is when its packet rate is too high with respect to its share of the channel capacity. These results show that the time-sensitive class may even benefit from low delays without any coordinated traffic control mechanisms. The paper is structured as follows. First, we propose a model of the 802.11 DCF access method to determine the limiting traffic rate (Section II) and we present the QoS architecture based on the DiffServ model (Section III). Then, we propose a bandwidth allocation scheme and give results of measurements that show how the QoS differentiation performs (Section IV). Finally, we present some conclusions (Section V). II. A NALYSIS OF THE LIMITING TRAFFIC RATE IN 802.11 In this section, we model the behavior of a 802.11 cell [2] with hosts sending packets of different sizes to derive constraints on DiffServ traffic. Actually, the packet size strongly influences the delay perceived by each class. Usually applications such as VoIP or media streaming that require real-time guarantees send short packets periodically. Data transfer applications interested in obtaining high bandwidth send maximal size packets in bursts (e.g. Web or FTP). In a previous work [3], we have studied the performance of 802.11 when there is one slow host (transmitting for example at 1 Mb/s) sharing the same cell with fast hosts (transmitting at 11 Mb/s). Here, we modify the model to take into account different packet sizes and host rates. The DCF access method of 802.11 is based on the CSMA/CA principle in which a host wishing to transmit
0-7803-7975-6/03/$17.00 (C) 2003
where the constant overhead tov = DIF S + tpr + SIF S + tpr + tack is composed of the PLCP (Physical Layer Convergence Protocol) preamble and header transmission time tpr = 192 µs (short PLCP header), SIF S = 10 µs, tack is the MAC acknowledgment transmission time (10 µs if the rate is 11 Mb/s as the ACK length is 112 bits), and DIF S = 50 µs (we give the parameters for the physical layer of 802.11b, however the analysis stays valid for the parameters of 802.11a or 802.11g). Under high load, to evaluate the impact of contention, we consider that the hosts always sense a busy channel when they attempt to transmit and that the number of transmissions that are subject to multiple successive collisions is negligible. In this case, we find: tcont (N ) � SLOT ×
1 + Pc (N ) CWmin × N 2
where Pc (N ) is the proportion of collisions experienced for each packet successfully acknowledged at the MAC level (0 � Pc (N ) < 1).
A simple expression for Pc (N ) can be derived by considering that a host attempting to transmit a frame will eventually experience a collision if the value of the chosen backoff interval corresponds to the residual backoff interval of at least one other host. Such an approximation holds if multiple successive collisions are negligible. So we have Pc (N ) = 1 − (1 − 1/CWmin )N −1 .
(1)
At this point we have all the elements for computing Ti , the global transmission time of host i. Now we want to find the overall performance—the channel utilization when hosts transmit packets at rate xi while alternating transmissions. The utilization will determine the limiting packet rate beyond which the network enters the saturation state. We can evaluate the channel utilization by considering that host i uses the channel with rate xi during time Ti as: U=
N �
xi Ti + xcoll Tcoll ,
(2)
i=1
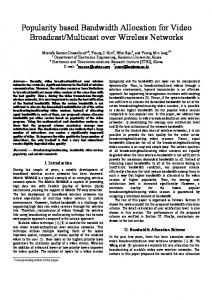
where xcoll , Tcoll are the collision rate and the time spent in collisions, respectively. To illustrate the analysis, Figure 1 compares the measured throughput obtained in a 802.11b cell with the throughput of 10 Mb/s Ethernet for different packet sizes for one host (no channel contention). Knowing Ti , the maximal packet rates can be found from Eq. 2 by setting U = 1. Then, multiplying by the UDP payload size yields the maximal throughput as seen by applications presented in Figure 1. We can see that the performance strongly depends on the packet size. When comparing with Ethernet, we can see that the throughput of 802.11b is much lower because of the overhead and the CSMA/CA access method. We can also note that our approximation only slightly overestimates the measured performance. 9000 8000 7000 Throughput[kbit/s]
senses the channel, waits for a period of time (DIFS – Distributed Inter Frame Space) and then transmits if the medium is still free. If the packet is correctly received, the receiving host sends an ACK frame after another fixed period of time (SIFS – Short Inter Frame Space). If this ACK frame is not received by the sending host, a collision is assumed to have occurred. The sending host attempts to send the packet again when the channel is free for a DIFS period augmented of a random amount of time. If there are multiple hosts attempting to transmit or one host tries to transmit in a continuous way, the channel may be sensed busy and hosts enter a collision avoidance phase: a host waits for a random interval distributed uniformly over {0, 1, 2, ...CW − 1} × SLOT . The congestion window CW varies between CWmin = 32 and CWmax = 1024, the value of SLOT is 20 µs. The host that chooses the smallest interval starts transmitting and the others suspend their count down until the transmission is over. When hosts choose the same value of the random interval, they will try to transmit at the same slot, which results in a collision detected by the missing ACK frame (only the transmitting hosts may detect a collision). Each time a host happens to collide, it doubles CW up to CWmax . We first consider the case of N competing hosts and we assume that there is no difference between traffic classes on hosts, the only difference is the packet size (we generalize to different traffic classes later): each host i sends packets of size si at rate xi packets per second. The frame transmission time depends on the size: ttr = si /R, where R the nominal transmission rate (11 Mb/s in case of 802.11b). The overall frame transmission time experienced by a single host when competing with N − 1 other hosts can be expressed as: si Ti = tov + + tcont . R
6000 5000 4000 3000 2000 Ethernet10M bit 802.11b 802.11b analytic
1000 0 0
256
512
768
1024
1280
1536
Packetsize [bytes]
Fig. 1.
802.11 and Ethernet throughput for different packet sizes
Due to the access method, when all hosts are greedy, their rates in the saturation state will be equal. So the limiting rate
0-7803-7975-6/03/$17.00 (C) 2003
can be found from: xsat
N �
hosts [5]. Here, we find how we should constrain the rate of DiffServ sources and measure the effect of QoS differentiation. Ti + xcoll Tcoll = 1,
(3)
which finally yields: xsat =
1 − xcoll Tcoll . �N i=1 Ti
(4)
A simple approximation consists of not taking into account collisions—our previous work [3] shows that the influence of collisions stays limited and if we neglect collisions the throughput can be predicted within the error of the order of 3%. In this case we obtain the following upper bound for the limiting packet rate: 1 xsat = �N
i=1
Ti
.
(5)
III. D IFF S ERV ARCHITECTURE The DiffServ architecture defines aggregated behavior for a limited number of performance classes for which statistical differentiation is provided [4]. It distinguishes two parts: the core network composed of one or several ISPs in which packet forwarding is done by core routers and the access network connecting end hosts to an edge router. Service agreements between different administrative domains (SLA - Service Level Agreements) allow to statically reserve sufficient resources to support statistical performance guarantees of different traffic classes. Core routers forward packets according to different BA (Behavior Aggregates)—QoS classes that group flows of similar properties. Performance perceived by each class depends on the type of processing at core routers specified in a PHB (Per Hop Behavior). Edge routers perform classification of the incoming traffic and marking according to application types, source and destination addresses or ports or other criteria. Incoming traffic is checked against a TCA (Traffic Conditioning Agreement), a profile of the traffic defined in the SLA. Traffic exceeding a given TCA can be dropped, marked as out of profile, or marked with a lower priority class. DiffServ defines three main classes: • EF (Expedited Forwarding). It provides flows with small delay and jitter as well as low packet drop rate that is suitable for interactive real-time applications. • AF (Assured Forwarding). It defines a QoS class for elastic flows that do not have the strict requirements of EF flows, but need a minimum bandwidth. If the network is not congested, AF flows may obtain more bandwidth. There are four AF classes each one with three spatial priorities (drop probability thresholds). • BE (Best Effort). This class, which exists in the current Internet, does not provide any QoS guarantee. Our approach to providing QoS differentiation in a 802.11b cell is based on the idea that in the absence of the QoS support at the MAC level, we need to manage QoS at the IP level. In a previous work, we have already experimented with this approach by implementing the DiffServ mechanisms in mobile
Behavior Aggregate Classifier
i=1 BE Low priority
Configuration
Tail−drop
AF WF2Q+
Wireless link
PQ
Partial Buffer Sharing
EF
Shape High priority
Tail−drop
Fig. 2.
DiffServ core router functions
To provide QoS differentiation, each host in a wireless cell implements the DiffServ edge and core router functions. First, incoming packets are classified and marked with a DSCP (Differentiated Services Codepoint). Then they pass through the core router functions that provide scheduling and traffic shaping. Figure 2 presents the core router implementation that we used in our experiments. It simplifies the generic DiffServ model by limiting the number of AF classes to one. This simplification appears to us as a right tradeoff between a sufficient choice of different services and user readability— it is difficult to make clear distinction between all 14 classes proposed in the DiffServ model. The EF class has a higher static priority than AF and BE. The AF and BE classes are scheduled according to a variant of WFQ (Weighted Fair Queueing) having good properties such as small Worst-case Fair Indices (WFI) and low asymptotic complexity of O(log N): WF2Q+ (Worst-case Fair Weighted Fair Queueing) [6]. The proportion of the bandwidth allocated to the AF and BE classes is configurable. The output traffic is limited by a token bucket to fit the available rate of the output link. IV. BANDWIDTH ALLOCATION AND D IFF S ERV PERFORMANCE
The DiffServ QoS differentiation relies on sufficient provisioning of network resources with respect to accepted SLAs— for a given aggregate input traffic a core router should be able to schedule different classes on a link having sufficient capacity. In the case of a 802.11b cell, hosts rates need to be limited so that the channel utilization stays bellow 1. Thus to obtain QoS differentiation, we need to enforce a sufficient provisioning by limiting the rate of the traffics generated by each host. If their throughput can be kept sufficiently low so that the channel is not yet saturated, we can guarantee the PHB behavior of DiffServ classes similar to DiffServ performance in wired networks. The rate thresholds depend on the number of hosts, packet sizes, and packet rates as described in Section II. Assume that there are N hosts in a cell and each host i sends packets of size si,class at rate xi,class , where class = EF, AF, BE. We need to consider each traffic class in the definition of the channel utilization (Eq. 2): host i uses the
0-7803-7975-6/03/$17.00 (C) 2003
7000
6000
5000 ThroughputA F+EF [kbit/s]
so for N = 2, and assuming that AF packets are longer or equal to EF packets, we obtain the following formula for the limiting rate:
A F size 64 A F size 128 A F size 256 A F size 512 A F size 1024 A F size 1472
xsat =
4000
1 . TEF + [1 + Pc (2)]TAF
In the general case of N > 2, it is difficult to take into account the influence of collisions. So, we use the approximation consisting of neglecting collisions—in this case we obtain the following upper bound for the limiting packet rate:
3000
2000
xsat i,class = �N
1000
i=1
0 2000
4000
6000
Fig. 3. Analytical: total throughput for increasing AF offered load, constant 64 Kb/s EF traffic 7000 A F size 64 A F size 128 A F size 256 A F size 512 A F size 1024 A F size 1472
6000
ThroughputA F+EF [kbit/s]
5000
4000
3000
2000
1000
0 0
2000
4000
6000
8000
O ffered Load [kbit/s]
Fig. 4. Analytical: total throughput for increasing AF offered load, constant 256 Kb/s EF traffic
channel with rate xi,class for time Ti,class : N �
�
i=1
class=EF,AF,BE
1 Ti,class
.
(10)
A. Experimental results
8000
O ffered Load [kbit/s]
U=
(9)
xi,class Ti,class + xcoll Tcoll . (6)
If we want to keep the network non saturated, rates xi,class should be such that U < 1. In general, it is difficult to use this relation because of the terms corresponding to collisions. However, we can derive a simple formula for N = 2 and give an approximation for N > 2. Consider the case of N = 2 and assume for simplicity that we identify hosts by their type of traffic: host 1 generates time-sensitive EF traffic while host 2 generates AF packets. The unknown values of xcoll , Tcoll in Eq. 4 can be found as: xcoll = xsat Pc (2),
(7)
Tcoll = max(TEF , TAF )
(8)
We present below the analytical results and compare them with measurements. For simplicity, we consider only two traffic classes in the rest of the paper: EF and AF—the results show how the real-time EF class can obtain short delays when competing with AF class which tries to obtain an important part of the available throughput; for EF and BE we obtain similar results. We have set up a platform to measure the delay and the throughput that hosts can obtain when sharing a 11 Mbit/s 802.11b wireless channel. We have used two notebooks running Linux RedHat 8.0 (kernel 2.4.20) with 802.11b cards based on the same chipset (Lucent Orinoco and Compaq WL 110). The wired part of the network is connected by an access point based on a PC box (SuSE 7.3) running software access point hostap. The notebooks use the Wvlan driver for the wireless cards. The cards do not use the RTS/CTS option that may optimize performance in case of the hidden terminal problem. To avoid interferences in the use of the wireless channel, we measure the round trip time (RTT) in a configuration in which a host sends a packet over 802.11b and the reply returns via another interface (100 Mbit/s Ethernet). In this setup the EF host sends time-sensitive traffic of a given packet rate whereas the AF host will try to increase its traffic as much as possible starting from 256 kbit/s to 10 Mbit/s in steps of 256 kbit/s. The measurement results in the rest of the paper are presented in function of the offered load, which is the sum of the EF and AF traffic in kbit/s. The throughput as well as the load are computed at the IP level (including the IP header), while the packet sizes are the UDP payload sizes. Consider the case of two hosts: one host sends EF traffic at constant rate (64 Kb/s or 256 Kb/s, 64 bytes packets) and another one generates AF traffic of increasing rate using various packet sizes. Figures 3 and 4 present the analytical throughput obtained by the two classes and Figures 5 and 6 present the measured throughput for the same parameters. The figures show that the proportion of the available throughput strongly depends on the packet size of the AF class—short packets mean sending frequently short frames which incur high overhead (cf. Figure 1). In this way, the throughput available for other transmissions is reduced. We can also observe that each curve attains some maximum value that
0-7803-7975-6/03/$17.00 (C) 2003
depends on the AF packet size for a given EF traffic. The cut-off point of the curves indicates the saturation of the cell. The cut-off throughput values are different from the saturation values (Eq. 9), because the EF traffic rate is kept constant and lower than the saturation value. In this case, we can find the cut-off throughput value from relation 6, which simply becomes: (11) xEF TEF + xAF TAF = U.
Fig. 6. Measured: total throughput for increasing AF offered load, constant 256 Kb/s EF traffic
300
250
200 RTT EF [m s]
We can find the cut-off throughput from the limiting condition U = 1. For the EF traffic of 64 kb/s, we find xEF = 89 p/s. This is well below xsat , which is 400 p/s for 1472 byte AF frames and more for shorter AF frames. Thus Eq. 6 holds and we can compute xAF : for 1024 byte AF frames, the cut-off value of AF packet rate xAF is 594.5 p/s. So the cutoff value of the throughput is 5068.5 kb/s, which corresponds fairly well to the value in Figure 3. We can notice that the analytical values of the throughput match fairly well the measured throughput especially when the EF traffic is small (cf. Figures 3 and 5). In the case of the higher EF traffic the analytical values are slightly lower than the measured throughput as seen in Figures 4 and 6. This is due to the overestimation of the time spent in contention in relation 6—we account the time spent in contention to each host whereas the time runs in parallel. This means that the throughput perceived by hosts will be better than what we estimate. The difference in throughput is less significant in Figures 3 and 5, because in this case the rate of the EF traffic is much lower and thus the time spent in contention is mostly due to the AF source contending with itself.
150
100 A F size 64 bytes A F size 128 bytes A F size 256 bytes A F size 512 bytes A F size 768 bytes A F size 1024 bytes A F size 1472 bytes
50
0
0
2000
4000
6000
8000
10000
O ffered Load [kbit/s]
Fig. 7. Measured: EF RTT for increasing AF offered load, constant 512 Kb/s EF traffic
Fig. 5. Measured: total throughput for increasing AF offered load, constant 64 Kb/s EF traffic
Consider now the delay of the EF traffic. Figure 7 presents the EF RTT when one host sends EF traffic at a constant rate of 512 Kb/s, 64 bytes packets and another one generates AF traffic of increasing rate and various packet sizes. Clearly we can identify the cut-off values of the total throughput for which the network enters saturation: at the beginning the RTT is small with values of several milliseconds and it sharply
increases to attain the level of a hundred milliseconds due to queues filling up. We can also notice that larger AF packets allow to better support the offered load—the saturation appears for grater values of the load. This figure helps us to realize the existence of two well distinguished states: non-saturation and saturation. Our goal is to keep the generated traffic under the saturation level. If we keep the offered load under the limiting value, the EF class will benefit from small delays less than 10 ms. Figure 8 shows EF RTT histograms when there is no saturation (EF traffic at constant rate of 512 Kb/s, 64 bytes packets, AF packet size of 256 and 1472 bytes). We can notice a counter intuitive result: when the EF class competes with AF, shorter AF packets degrade the EF delay. In general it is the other way round: for example when short and long packets are scheduled according to the non-preemptive priority queueing discipline (priority to short packets), the delay of short packets
0-7803-7975-6/03/$17.00 (C) 2003
Fig. 8. Measured: EF RTT histogram, no saturation, 256 bytes and 1472 bytes AF packet size
decreases when we decrease the length of the longer packets. The counter intuitive effect observed in 802.11b is related to the high overhead of the access method—short AF packets mean sending frequently short frames which incurs higher overhead and lower available throughput. In another experiment, we have tested the effect of DiffServ scheduling mechanisms on quality of service. We measure the EF RTT when two hosts both transmit EF and AF traffic in a 802.11b cell. Each host implements the DiffServ core router functions so that the EF class has priority over the AF class on the same host. The sources of different hosts compete with each other in attempt to use the wireless channel. The EF sources have constant rate of 64 Kb/s, 64 Byte packets and the AF sources are limited to 2 Mb/s, 1472 Byte packets. In this set up, the network is not yet saturated. Figure 9 presents the EF RTT when there is no AF traffic at the beginning (up to 600 sec.). Then, the AF sources start to transmit. We can observe a slight increase of the delay. This effect is captured by the histograms presented in Figure 10. When alone on the network the EF class has a narrow histogram centered at 1.5 ms, when in competition with the AF class, the histogram moves towards 3 ms and becomes more flat. The histogram of the AF RTT is further shifted towards longer delays. V. C ONCLUSIONS The analytical expressions and measurements presented in this paper show that it is possible to provide QoS differentiation at the IP level based on the DiffServ model over the standard DCF method of 802.11. In particular, we have observed that when a 802.11 cell is not saturated, the DCF access method guarantees a low delay for the priority EF traffic and the channel load has little influence on the performance of this traffic. By constraining the output rate of each host in a cell via DiffServ scheduling and traffic shaping mechanisms, we can keep the 802.11 network in the state of non-saturation
Fig. 9.
Fig. 10.
Measured: EF RTT, 64 Kb/s EF rate, 2 Mb/s AF rate
Measured: RTT histogram, 64 Kb/s EF rate, 2 Mb/s AF rate
so that the time critical EF class benefits from stable short delays. Our formulae provide an indication of rate thresholds above which the network becomes saturated. R EFERENCES [1] M. Heusse, P. Starzetz, F. Rousseau, G. Berger-Sabbatel, and A. Duda, “Scheduling Time-sensitive Traffic on 802.11 Wireless LANs,” in Proceedings of the QoFIS Workshop (Quality of Future Internet Services), Springer Lecture Notes in Computer Science, Volume 2811, Kista, Sweden, 2003. [2] ANSI/IEEE, “802.11: Wireless LAN Medium Access Control (MAC) and Physical Layer (PHY) Specifications,” 2000. [3] M. Heusse, F. Rousseau, G. Berger-Sabbatel, and A. Duda, “Performance Anomaly of 802.11b,” in Proceedings of IEEE INFOCOM 2003, San Francisco, USA, 30– 3 2003. [Online]. Available: http://www.ieeeinfocom.org/2003/papers/21 01.PDF [4] S. Blake et al., “An Architecture for Differentiated Services,” 1998, Internet RFC 2475. [5] J. Garc´ıa-Mac´ıas, F. Rousseau, G. Berger-Sabbatel, T. Leyla, and A. Duda, “Quality of Service and Mobility for the Wireless Internet,” Wireless Networks, vol. 9, no. 4, pp. 341–352, 2003. [6] B. Zhang et al., “WF2Q: Worst-case Fair Weighted Fair Queueing,” in INFOCOM 96, 1996.
0-7803-7975-6/03/$17.00 (C) 2003