the linear transform using a basis set and (c) determining optimal operating ..... approximation, we select an appropriate operating point which guarantees that ...
Basis Projection for Linear Transform Approximation in Real-Time Applications Yinpeng Chen Hari Sundaram Arts Media Engineering, Arizona State University, Tempe, AZ 85281, AME-TR-2005-17 Email: {yinpeng.chen, hari.sundaram}@asu.edu
Abstract This paper aims to develop a novel framework to systematically trade-off computational complexity with output distortion, in linear multimedia transforms, in an optimal manner. The problem is important in real-time systems where the computational resources available are time-dependent. We solve the real-time adaptation problem by developing an approximate transform framework. There are three key contributions of this paper – (a) a fast basis approximation framework that allows us to store signal independent partial transform results to be used in real-time, (b) estimating the complexity distortion curve for the linear transform using a basis set and (c) determining optimal operating points and a meta-data embedding algorithm for images that allows for real-time adaptation. We have applied this approach on the FFT transform with excellent results.
1. Introduction Complexity
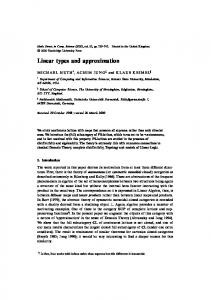
Available computing resource In this paper we present Adaptive transfrom a novel framework for developing linear transforms that adapt to changing computational Fixed transform Impossible resources. The problem interval for fixed is important since in transform t t1 t2 real-time multimedia systems, the Figure 1: complexity for fixed and computational resources adaptive transforms available to content analysis algorithms are not fixed, and a generic computationally scalable framework for content analysis algorithms is needed. The problem is made difficult since the relationship between computational resources and distortion depends on the specific content.
For example in Figure 1, we show an example of a system shows computational resources are changing over time. However, for a fixed analysis transform (e.g. FFT / DCT) there will be a time between t1 and t2 when the transform cannot operate at all. We seek an approximate transform that is able to gracefully adapt to the resources available with variable error. There has been prior work on adaptation in multimedia. There has been work on content adaptive transcoding [7] that focuses on adapting the media stream. Other complexity-scalable work includes [2] that looks at graceful degradation of video decoders under resource constraints. In more theoretical work [4] the authors look at properties of approximate transform formalisms and [5] looks at relationship between Kolmogorov complexity and distortion. However several issues remain – (a) while there has been some success in complexity scalable decoders, there are no formal generic adaptation strategies to guide us for other content analysis applications, (b) given a specific transform (say DCT) approximation and distortion, there is no framework that
enables us to change the approximation in real-time to take advantage of additional computational resources to minimize distortion. There are three key ideas in this paper. First we show that a linear transform can be efficiently approximated with low computational complexity using a basis projection technique. Then we show that for a linear transform, there exists a complexity distortion curve, that is estimated using a basis projection. Finally we show how optimal operating points from the C-D curve can be added as metadata to the images, with about 1.5% increase in the size of the image. We use the FFT as the linear transform, and the Haar wavelet basis as the approximating projection. We show excellent results on the standard Lena image.
2. Linear Transform Approximation We now formally define the technical problem, and present our basis projection solution. Let T be the linear transform that we wish to approximate, and let x and y be the input and output vectors respectively (i.e. y = Tx). For definiteness, assume that T is a NxN matrix, and x and y are Nx1 dimensional vectors. Let C(T) represent the computational complexity of the transform T. Let the computational resources available to compute the transform be Co. Then the desired approximate transform Ta is defined as follows:
Ta � arg min y − ya
Ta :C (Ta ) ≤ Co
Where ya is the approximated output (ya = Tax). The equation indicates that the approximate transform Ta minimizes output distortion while satisfying computational complexity constraints. We represent the approximation Ta as a composition of operators: Ta = TP, where P is a (NxN) linear projection operator. In order to see how this can be used, let P = BkBkT where the column vectors of Bk are orthonormal. Bk is an Nxk matrix with only k column vectors. Then the output and the distortion are calculated as follows:
ya = TBk BkT x, y − ya = T ( I − Bk BkT ) x ,
This decomposition allows us to compute ya into two steps – (a) project x onto Bk, then (b) project the result onto TBk. The significant advantage is that TBk is independent of the input, and can be computed and stored offline. We only need compute BTkx during real-time computation and combine with the stored TBk matrix. A good choice of basis set Bk, can ensure that computational complexity of Bk (C(Bk)) is significantly less than C(T). Note that if Bk were an NxN matrix (i.e. k = N), then there is no error. The general factorization of P, when Bk is only independent, but not orthonomal is considered in [1].
3. FFT Approximation In this section, we apply the basis set projection technique on the FFT, using a Haar basis projection. We chose the FFT as it is a widely used linear transform in multimedia applications. Our approach is complementary to already existing efficient FFT implementations. We analyze the complexity of 2D FFT for an 8*8 image block in which the components are real numbers. Note the exact 2D FFT has a fixed computational complexity, over all inputs. In this paper we shall assume that a single real addition, subtraction, or multiplication use equivalent resources. When the computing costs are different, they can be accounted for using a weighted sum. We can show that the 2D FFT for an 8*8 real block requires 764 operations. It can be easily shown that the traditional DFT takes 1524 operations. Compared with DFT, FFT significantly reduces the amount of computation.
3.1 Approximation using Haar Wavelet Basis In this section, we shall discuss FFT approximation based on Haar wavelet basis [6]. The 2D nonstandard Haar wavelet basis decomposition for an 8*8 block (x) can be represented as: 0 0 + x′J = c0,0 φφ0,0
J −1 2 j −1 2 j −1
∑ ∑ ∑ (d kj,lφψ kj,l + ekj,lψφkj,l + f k j,lψψ kj,l ) j =0 k =0 l =0
Where x′J is the Haar wavelet approximation of image block x at the Jth resolution, c00,0 and φφ00,0 are the scaling coefficient and scaling function respectively, djk,l and φψjk,l are the (k,l)th horizontal wavelet coefficient and function at the (j+1)th resolution, ejk,l and ψφ jk,l are the (k,l)th vertical wavelet coefficient and function Figure 2: 2D nonstandard Haar at the (j+1)th resolution, wavelet basis. j j f k,l and ψψ k,l are the th (k,l) diagonal wavelet coefficient and function at the (j+1)th resolution. The nonstandard Haar wavelet basis is shown in Figure 2. Each wavelet function is an 8*8 matrix.
3.1.1 Basis Parameter Estimation The 2D Haar wavelet parameters can be obtained easily by the inner product of image block x and the corresponding Haar wavelet function. For example, the (k,l)th horizontal wavelet coefficient at the (j+1)th resolution djk,l can be obtained by:
d kj,l
=
x | φψ kj,l
,
j
where is the inner product operator and φψ k,l is the (k,l)th horizontal wavelet function at the (j+1)th resolution. In order to speed up computation, we use unnormalized Haar wavelet basis to approximate image block and incorporate the normalized factor into FFT of Haar wavelet basis functions by multiplying the FFT of Haar wavelet basis functions and their corresponding normalized factor offline. In Figure 2, the plus signs and minus signs are +1 and -1and the blank region is 0.
At resolution J=0, computing c00,0 for an 8*8 image block requires 63 additions. At resolution J=1, we can use the intermediate results of c00,0 computation to speed up. For example, when we compute c00,0, we first divide the image block into 4 non-overlapping sub-blocks and compute the sum of each sub-blocks [s1, s2, s3, s4]T. Second, we compute the sum of top two sub-blocks and bottom two sub-blocks [b1=s1+s2, b2=s3+s4]T. Finally, we compute the addition of b1 and b2 and obtain c00,0. Thus, computing d00,0=b2-b1, e00,0=(s1-s2)+(s3-s4) and f00,0=(s3 –s4)-(s1-s2) requires additional 1, 3 and 1 operations respectively. Hence, at resolution J=1, parameter estimation needs 68 operations. Similarly, the parameter estimation at resolution J=2 requires 88 operations.
3.1.2 FFT of Haar wavelet Basis Functions We compute the FFT of all 2D Haar wavelet basis functions with size 8*8 offline and combine them together to obtain FFT approximation: J −1 2 j −1 2 j −1
0 0 + ∑ ∑ ∑ (d kj,lφψ kj,l + ekj,lψφkj,l + f k j,lψψ kj,l )] F ( x′J ) = F [c0,0 φφ0,0 j = 0 k =0 l = 0
=
0 c0,0 F(
0 0,0 ) +
φφ
J −1 2 j −1 2 j −1
∑ ∑ ∑ [dkj,l F (φψ kj,l ) + ekj,l F (ψφkj,l ) + fkj,l F (ψψ kj,l )] j =0 k =0 l = 0
where F(⋅) is an 8*8 FFT operator.
Figure 3 FFT matrix form for Haar wavelet basis at resolution J=0,1,2. Shaded regions are the non-zero components.
The forms of FFT matrices of Haar wavelet basis functions are shown in Figure 3. The complexities of FFT of Haar wavelet basis functions at resolution J=0,1,2 are 0, 12 and 98 operations respectively.
3.1.3 Overall Complexity The computational complexity of FFT approximation using Haar wavelet basis includes two parts: (a) Complexity of basis parameter estimation, (b) FFT computation for basis functions. Combining these two parts, we obtained the complexity of FFT approximation based on Haar wavelet basis. Table 1 Complexity (number of operations) of FFT approximation using Haar wavelet basis J=0
J=1
J=2
Exact FFT
63
80
186
764
In [1], we show how the projection technique can be used with a polynomial basis.
4. Complexity-Distortion Curve In this section, we will do two things (a) establish a theoretical framework for the complexity-distortion (C-D) curve for linear operators, and (b) obtaining a useful estimate of the C-D curve using basis set approximations.
4.1 C-D Curve Definition We use the well established definitions from rate distortion theory [3], to define the relationship between complexity and
distortion. For the sake of definiteness, let us assume that the linear operator is the FFT. It is easy to see that these results generalize to arbitrary linear transforms. Let X be a size M*N image which is divided into K1*K2 blocks. The complexity C of the FFT approximation of X is defined as the average number of operations per block. We then define the distortion D due to the transform approximation as follows: D=
1 K1 ⋅ K 2
K1
K2
∑ ∑ d (Y (k1, k2 ),Ya (k1, k2 ))
k1 =1 k2 =1
where Y(k1,k2) and Ya(k1,k2) are exact FFT matrix and approximation FFT matrix of block(k1,k2) respectively, d is a distortion measure. The complexity distortion region R(C,D) for an image for the FFT transform is defined as the closure of the set of achievable complexity distortion pairs (C,D). The complexity distortion function C(D) for each image, for the FFT is defined as the infimum of complexities C such that (C,D) is in the achievable complexity distortion region of the image for a given distortion D. Since C(D) is the minimum complexity over increasingly larger sets as D increases, C(D) is nonincreasing in D. In [1], we prove that C(D) is convex.
4.2 Basis set approximations The C(D) lower bound needs to be estimated and we propose the use of a basis-set approximation (e.g. polynomial / Haar) to estimate the bound. A basis set approximation leads to a Basis Set Complexity Distortion Function (BSCDF). The complexity distortion function of an Image X for basis set b is defined as: (C Xb ) C Xb ( D) = inf b DX ≤ D
where CbX and DbX are achievable average complexity and distortion of FFT approximation for the image X using basis set b respectively. If the image size is large, the computation of BSCDF is very expensive even if we only use three resolutions of Haar wavelet basis. Hence, we present a fast step-wise algorithm to estimate BSCDF of Haar basis with resolution 0, 1, 2. This procedure also holds true for other basis projections such as the polynomial basis. We begin by noting the highest computational complexity (and minimum distortion) is when we use the highest Haar resolution for all image blocks. Conversely, the lowest computational complexity (and highest distortion) is when all blocks are projected on lowest (J=0) Haar basis. The step-wise algorithm starts from the (C,D) pair such that FFT approximation based on Haar basis resolution 2 is used for all image blocks and ends with (C,D) pair where FFT approximation for all image blocks are based on lowest (J=0) approximation. At each step, we first select the image block with FFT approximation based on Haar resolution 1 or 2 such that decreasing the resolution by 1 introduces the maximum ratio between complexity decrement and distortion increment (|∆C/∆D|). i.e. we look for blocks that maximize the rate of change, thereby intuitively being close to the tangent to the C-D lower bound. Then we reduce the resolution of the Haar basis approximation by 1 for the selected block and get a new (C,D) pair. Hence, we will obtain a C-D curve estimation by repeating this procedure. The estimation results are shown in Figure 4. We can see that the exact BSCDF and estimation are very close for both polynomial basis approximation and Haar wavelet basis approximation.
5. Determining C-D Metadata in Images In this section, we shall discuss how to do resource adaptive FFT approximation in real applications. The idea is we select several operating points or (C,D) pairs along the estimation of basic set complexity distortion curve and save the corresponding (C,D) values and approximation degree / resolution matrices in the image metadata during the encoding. In the real FFT approximation, we select an appropriate operating point which guarantees that complexity constraint is satisfied and use the corresponding approximation degree matrix to do FFT approximation.
5.1 Operating point selection We now show to approximate the C-D curve, using K operating points on the curve. We use our step-wise algorithm (see section 4.2), to estimate the C-D curve. We shall assume that the operating point (Ci,Di) is used when the available complexity C is in interval [Ci,Ci-1). This will introduce distortion: C
∆Di = ∫C i−1 p (C )[ Di − D(C )]dC ,
i
where p(C) is the pdf of complexity constraint and D(C) is the inverse function of C(D). Thus, the overall introduced distortion is: ∆D =
K +1
K +1 C i −1
i =1
i =1
∑ ∆Di = ∑ ∫C
i
p (C )[ Di − D(C )]dC
Therefore, the optimal selection is choosing the K operating points with the minimum introduced distortion. In [1] we proved that when K=1, the optimal single operating point for a C-D curve starting from (Cs,Ds) to (Ce,De) (Cs>Ce) is: (C * , D* ) = arg max[( De − d ) ⋅ ( f (Cs ) − f (c))] ( c , d )∈ξ
c
f (c) = ∫−∞ p (C ) dC where ξ is the set of all (C,D) pairs on the C(D) curve. We show in [1] that if {(Ci,Di), i=1,…,K} are optimal K operating points of C-D curve starting from (C0,D0) to (CK+1,DK+1) and C0≥…≥CK+1, D0≤…≤DK+1, (Ci,Di) is the optimal single operating point of the sub-curve of C(D) which starts from (Ci-1,Di-1) to (Ci+1,Di+1). Thus, we can use an iterative algorithm to obtain the K operating points. In the algorithm, we initially select K operating points randomly and order them in complexity value. At each iteration, we update (Ci,Di) i=1,..K with the optimal single operating point (ref. eq. ) of the sub-curve between (Ci-1,Di-1) to (Ci+1,Di+1) (assuming that p(C) is uniform). Finally, {(Ci,Di)} will converge to the optimal operating points.
5.2 Encoding and using metadata We show how to compute metadata for the Haar basis using K operating points. An identical approach yields the metadata for the polynomial basis [1]. In the image encoding phrase, compute the estimation of basis set complexity distortion curve for Haar and polynomial basis set with resolution / degree 0, 1, 2 for the image and select the optimal one. Second, we select the K operating points along the C-D curve of selected basis set. Thus, with the two ending points of the C-D curve, we have K+2 operating points denoted as (Ci,Di), i=0,…,K+1, C0≥…≥CK+1, D0≤…≤DK+1. Obviously, (C0,D0) and (CK+1,DK+1) are the two ending points of the C-D curve. Finally, we save three things in
the image metadata: (a) basis bit: (0: polynomial basis and 1: Haar wavelet basis), (b) K+2 (C,D) values: (each is a 16 bit float) and (c) K approximation degree matrices Mi, i=1,…K: Mi is corresponding with the (Ci,Di) with size K1*K2 where K1 and K2 are number of 8*8 image blocks along the vertical and horizontal dimensions respectively. Mi(k,l) is the degree / resolution number of polynomial / Haar wavelet basis approximation for the block (k,l) and needs 2 bits. Since the approximation degree matrices corresponding with (C0,D0) and (CK+1,DK+1) are matrices whose components are all two and zero respectively. We need not save them in the metadata. Therefore, the size of metadata is 2KK1K2+32(K+2)+1 bits. When we set K=4, metadata size is about 1/64 of the gray level image. In the FFT approximation phrase, the image and computational complexity constraint C are given. We first read the basis bit and select corresponding basis set. Then we select Ci such that Ci-1>C≥Ci from the list of complexity values saved in the image metadata. Finally, we use Mi which is corresponding to Ci to do FFT approximation. The complexity of this approximation is guaranteed to be less than the complexity constraint.
6. Experimental Results We used a well known image – Lena at resolution 256*256 to test our algorithm. Our experimental results include two parts: (a) estimation of polynomial and Haar wavelet basis set complexity distortion curves and (b) optimal operating point selection.
∆C/C
Complexity
6.1 Estimation of BSCDF
better than polynomial basis FFT approximation. This is because we use a separable, non-orthogonal polynomial basis [1].
6.2 Operating point selection Figure 5 shows the optimal operating point selection (K=4) Original results on the Lena Image estimation of Haar wavelet basis set complexity distortion curve by using iterative algorithm. For Figure 5: Operating point selection each operating point, we also show the corresponding recovered image by using exact inverse FFT (IFFT). The triangles in the figure are the two end points and the stars are the 4 optimal operating points.
7. Conclusion In this paper, we have attempted to create a systematic framework for trading off computational complexity with distortion. There were three key ideas – (a) orthonormal basis functions to approximate the input, (b) we showed the existence of a convex complexity-distortion curve, and show how to approximate the curve given a specific basis. Finally we showed how to compute operating points on the C-D curve, and embed metadata in the image.
8. References [1] Y. CHEN and H. SUNDARAM (2005). Approximate Linear Transforms for Real Time Applications. Arts Media and Engineering Program, Arizona State University, AME-TR2005-17, Oct. 2005.
Figure 4. BSCDF estimation. (a) BSCDF estimation results for polynomial basis set and Haar wavelet basis set. (b) Complexity difference between exact BSCDF and estimation.
For an image divided into K1*K2 blocks, 8*8 pixels each, we use average operation number per block as the complexity C of FFT approximation of the image. The distortion is mean squared difference. Figure 4 (a) shows the exact basis set complexity distortion curve and the estimation using step-wise algorithm for polynomial basis set with degree 0, 1, 2 and Haar wavelet basis set with resolution 0, 1, 2. We can see that two BSCDFs are non-increasing convex curves and the estimation results are very close to the exact BSCDFs. In Figure 4 (b), we plot the normalized complexity difference. Given a C-D pair (C,D) on the exact BSCDF, we can obtain the corresponding C-D pairs on the estimation curve (C′,D) with the same distortion and compute normalized complexity difference (C′-C)/C. The average normalized complexity differences for polynomial basis and Haar wavelet basis are 0.19% and 0.045% respectively which shows that our BSCDF estimation algorithm is excellent. We also observe that Haar wavelet basis FFT approximation is
[2] Y. CHEN, Z. ZHONG, T.-H. LAN, S. PENG and K. VAN ZON (2002). Regulated complexity scalable MPEG-2 video decoding for media processors. Circuits and Systems for Video Technology, IEEE Transactions on 12(8): 678-687. [3] T. M. COVER and J. A. THOMAS (1991). Elements of information theory. Wiley New York. [4] S. H. NAWAB, A. V. OPPENHEIM, A. P. CHANDRAKASAN, J. M.WINOGRAD and J. T.LUDWIG (1997). Approximate Signal Processing. The Journal of VLSI Signal Processing-Systems for Signal, Image, and Video Technology 15(1-2): 177-200. [5] D. M. SOW and A. ELEFTHERIADIS (2003). Complexity distortion theory. Information Theory, IEEE Transactions on 49(3): 604-608. [6] E. J. STOLLNITZ, T. D. DEROSE and D. H. SALESIN (1995). Wavelets for computer graphics: A primer, part 1. IEEE Computer Graphics and Applications 15(3): 76-84. [7] Y. WANG, J.-G. KIM and S.-F. CHANG (2003). ContentBased Utility Function Prediction For Real-Time MPEG-4 Video Transcoding, Proc. IEEE Conference on Image Processing 2003, Sep. 2003, Barcelona, Spain.