1378
IEEE TRANSACTIONS ON MEDICAL IMAGING, VOL. 34, NO. 6, JUNE 2015
Bayesian Framework Based Direct Reconstruction of Fluorescence Parametric Images Guanglei Zhang, Huangsheng Pu, Wei He, Fei Liu, Jianwen Luo*, and Jing Bai, Fellow, IEEE
Abstract—Fluorescence imaging has been successfully used in the study of pharmacokinetic analysis, while dynamic fluorescence molecular tomography (FMT) is an attractive imaging technique for three-dimensionally resolving the metabolic process of fluorescent biomarkers in small animals in vivo. Parametric images obtained by combining dynamic FMT with compartmental modeling can provide quantitative physiological information for biological studies and drug development. However, images obtained with conventional indirect methods suffer from poor image quality because of failure in utilizing the temporal correlations of boundary measurements. Besides, FMT suffers from low spatial resolution due to its ill-posed nature, which further reduces the image quality. In this paper, we propose a novel method to directly reconstruct parametric images from boundary measurements based on maximum a posteriori (MAP) estimation with structural priors in a Bayesian framework. The proposed method can utilize structural priors obtained from an X-ray computed tomography system to mitigate the ill-posedness of dynamic FMT inverse problem, and use direct reconstruction strategy to make full use of temporal correlations of boundary measurements. The results of numerical simulations and in vivo mouse experiments demonstrate that the proposed method leads to significant improvements in the reconstruction quality of parametric images as compared with the conventional indirect method and a previously developed direct method. Index Terms—Bayesian framework, fluorescence tomography, parametric images, reconstruction method, structural priors. Manuscript received November 19, 2014; accepted January 15, 2015. Date of publication January 22, 2015; date of current version May 29, 2015. This work is supported by the National Basic Research Program of China (973) under Grant 2011CB707701; the National Natural Science Foundation of China under Grant 81227901, 81271617, 61322101, 61361160418, 61401246; the National Major Scientific Instrument and Equipment Development Project under Grant 2011YQ030114; the Fundamental Research Funds for the Central Universities under Grant 2015JBM026; the China Postdoctoral Science Foundation under Grant 2014M550073; F. Liu is supported in part by the Postdoctoral Fellowship of Tsinghua-Peking Center for Life Sciences . Asterisk indicates corresponding author. G. Zhang was with the Department of Biomedical Engineering, School of Medicine, Tsinghua University, Beijing 100084, China. He is now with the Department of Biomedical Engineering, School of Computer and Information Technology, Beijing Jiaotong University, Beijing 100044, China (e-mail:
[email protected]). H. Pu and J. Bai are with the Department of Biomedical Engineering, School of Medicine, Tsinghua University, Beijing 100084, China (e-mail: ethanpu@qq. com;
[email protected]). W. He is with the China Institute of Sport Science, Beijing 100061, China (e-mail:
[email protected]). F. Liu is with the Tsinghua-Peking Center for Life Sciences and Department of Biomedical Engineering, School of Medicine, Tsinghua University, Beijing 100084, China (e-mail:
[email protected]). *J. Luo is with the Center for Biomedical Imaging Research and Department of Biomedical Engineering, School of Medicine, Tsinghua University, Beijing 100084, China (e-mail:
[email protected]). Color versions of one or more of the figures in this paper are available online at http://ieeexplore.ieee.org. Digital Object Identifier 10.1109/TMI.2015.2394476
I. INTRODUCTION
D
YNAMIC optical imaging techniques aim to image the spatial-temporal distributions of optical contrast agents and have gained rapid development in recent years [1]–[13]. In these techniques, dynamic fluorescence molecular tomography (FMT) is a powerful imaging technique that allows dynamically and three-dimensionally resolving the metabolic process of fluorophores within small animals in vivo [14]–[21]. Compared with static FMT imaging technique, dynamic FMT has the ability to tomographically capture the uptake and release of fluorescent biomarkers in organs and tissues, and thus can provide richer information for physiological and pathological studies [19]–[21]. Pharmacokinetics is the study of the absorption, distribution, metabolism and excretion of substances such as drugs, radiotracers and fluorophores in the body [19]. Compartmental modeling is a well-known method for pharmacokinetic analysis, and the exchange rates of substances between different compartments in the compartmental model are defined as pharmacokinetic parameters, which have a close relationship with physiological parameters such as permeability, perfusion and so on [3], [9]. As in positron emission tomography (PET) [22]–[24] and magnetic resonance imaging (MRI) [25]–[27], the dynamic FMT measurements can be transformed into images of pharmacokinetic parameters through the application of compartmental models. Images of pharmacokinetic parameters are also known as parametric images which can provide valuable physiological information for tumor detection [2]–[4], therapy assessment [9], and organ function evaluation [8], [20]. Generally, there are two kinds of methods for obtaining parametric images in dynamic FMT: indirect methods and direct methods [18]–[21]. Compared with conventional indirect methods which reconstruct a sequence of static FMT images first and then estimate pharmacokinetic parameters from the time curve of each voxel in a separate step, direct methods can reconstruct parametric images directly from the raw boundary measurements by combining dynamic FMT reconstruction and compartmental modeling into one step [18]. Therefore, direct methods can utilize temporal correlations of boundary measurements and accurately model the statistics of measurement noise in the parameter estimation process, and thus ultimately improve the quality of parametric images [19], [21]. Although direct methods have special advantages, it is still a challenge for dynamic FMT to image the pharmacokinetic parameters of organs in small animals. This is because FMT suffers from a low spatial resolution and noisy results due to
0278-0062 © 2015 IEEE. Personal use is permitted, but republication/redistribution requires IEEE permission. See http://www.ieee.org/publications_standards/publications/rights/index.html for more information.
ZHANG et al.: BAYESIAN FRAMEWORK BASED DIRECT RECONSTRUCTION OF FLUORESCENCE PARAMETRIC IMAGES
its inherent ill-posedness and ill-condition nature [28]–[30]. Additionally, because organs have different optical properties, an inaccurate FMT forward model is constructed when different organs are assigned with the same average optical parameters, which further reduces the reconstruction quality of parametric images [20]. Structural priors provided by a secondary anatomical imaging system such as X-ray computed tomography (XCT) can help to solve these problems. Structural priors have the following advantages: 1) it can help to construct a more accurate FMT forward model with organs assigned with appropriate optical properties; 2) it can be used to construct a regularization term to constrain the FMT inverse problem and improve the reconstruction quality. In our previous work, structural priors obtained from a hybrid FMT/XCT system [29] have been proven to be able to improve the parametric image quality [20]. But it was based on an indirect method. By combining the advantages of direct methods and structural priors, we have further proposed a direct method using structural priors based on Laplace regularization in previous work [21]. The proposed direct method has shown significant improvements in the quality of parametric images compared with the indirect methods. Nevertheless, the regularization term of the direct method is applied on the dynamic FMT images. Although this constraint can simplify the reconstruction algorithm, the time-varying fluorophores have been assumed to be constant in each circle of the full-angle FMT system, which makes it difficult to take full advantage of the temporal correlations of adjacent projections in every circle. Challenge still remains in how to fully utilize the temporal correlations to further improve the reconstruction quality. In this work, we present a method for direct reconstruction of parametric images based on a Bayesian framework. The proposed method uses maximum a posteriori (MAP) estimation to incorporate structural priors, and includes two main parts: data likelihood model and prior information model. The structural priors are used to constrain the hyperparameters of the prior information model, which is equivalent to directly applying a soft constraint on the pharmacokinetic parameters. Compared with our previously proposed direct method which applies regularization on dynamic FMT images [20], this constraint can not only make the parametric images less noisy, but also make the temporal correlations of boundary measurements be fully utilized in the data likelihood model. Numerical simulations and mouse experiments are carried out to test the performance of the proposed method. Results show that the proposed direct method obtains better reconstruction results than our previously proposed direct method as well as the conventional indirect method. This paper is organized as follows. Section II describes the forward problem of the dynamic FMT, and gives the definitions of parametric images. Section III details the proposed direct method based on MAP estimation in the Bayesian framework. Section IV introduces the indirect and direct methods used for comparison. Section V shows the results of numerical simulations and mouse experiments. Finally, Section VI discusses the results and draws the conclusion.
1379
II. FORWARD PROBLEM A. Diffusion Model For FMT forward problem in continuous wave domain, the light propagation at the excitation and emission wavelengths can be modeled by the following coupled diffusion equations [28]
(1) where the subscripts and denote the excitation and emission wavelengths, respectively; represents the spatially varying optical field in the medium ; stands for the spatially varying absorption coefficient of the medium; is the spatially varying diffusion coefficient given by , where is the reduced scattering coefficient; denotes the spatially varying fluorophore concentration, and is a constant accounting for the absorption and quantum yield of the fluorophores. A collimated point source can be modeled as an isotropic source , where is the point located one transport mean free path into the medium from the illumination spot [31], [32]. Similarly, a uniform line-shaped excitation source is modeled as [32] (2) denotes the line located one transport mean free path where into the medium. In this work, the line-shaped excitation source is employed for whole-body imaging. Using the Green's function, the fluorescence measurements detected at a point due to a line-shaped excitation source can be obtained based on the first order Born approximation [32] (3) where the Green function describes the light propagation from the line-shaped excitation source at a project angle to an arbitrary position inside the medium at the excitation wavelength; the Green function describes the light propagation from the position inside the medium to the detector position at the emission wavelength; is a calibration factor which accounts for the unknown gain and attenuation factors of the system. B. Time-Varying Fluorophore Concentration In this work, we focus on studying the dynamic FMT problems in which the concentration of fluorophores varies with time continuously. The time variation of fluorophore concentration is usually caused by the metabolism of fluorophores in the body, and it may provide valuable physiological information for biological studies, disease diagnosis and drug development [5]–[9]. Here, we assume that the time-varying concentration can
1380
be expressed as a function of do not vary with time
IEEE TRANSACTIONS ON MEDICAL IMAGING, VOL. 34, NO. 6, JUNE 2015
pharmacokinetic parameters that (4)
are the time-inwhere is a predefined function; variant pharmacokinetic parameters which can be used to quantitatively describe the spatiotemporal features of the metabolism of fluorophores. One important theory that follows this framework is the compartmental model. In this model, the region of interest consists of a number of compartments, and each compartment represents a volume of tissue in which the fluorophore distribution is similar. The concentration change in a specific compartment is modeled as a result of the exchange of fluorophores between connected compartments. A system of differential equations is used to describe the exchange of fluorophores among different compartments. Recently, indocyanine green (ICG) has been widely used in the field of optical imaging because of its low toxicity and approval for human use [2], [3], [18], [20], [21], [34]. Based on compartmental modeling, the metabolic processes of ICG in the organs and tissues can be described by a biexponential model
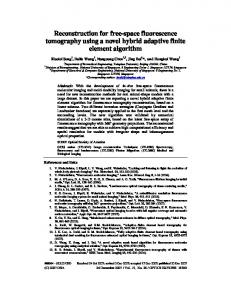
Fig. 1. Schematic diagram of the hybrid FMT/XCT imaging system. The FMT system is a free-space, full-angle system. In the FMT system, a special optical fiber is used to form a line-shaped excitation source, which can provide much better whole-body imaging quality than conventional FMT systems with point illumination [31], [32]. The XCT system is used to get the anatomical information of the small animals, which is used as the structural priors in the reconstruction algorithm.
(5) where parameters , , , are the pharmacokinetic parameters describing the metabolic process of ICG [2], and they corin (4). respond to the pharmacokinetic parameters When the gain of the FMT system is unknown, the pharmacokinetic parameters and have arbitrary unit (a.u.) [20]. and ( ) are the uptake and excretion rates of fluorophores, which have physiological significance for quantitative evaluation of organ function [34]. In this work, we use ICG to investigate the metabolic features of organs in the mouse. Each organ in the body plays a different role in the metabolism of fluorophores, and thus has a distinctive temporal pattern of fluorophores uptake and release when fluorophores are injected into the body [5], [33]. Therefore, parameters , , , can be used to quantitatively evaluate the functions of organs and tissues, such as liver function [8], [34]. The images of pharmacokinetic parameters are also called parametric images. C. Discrete Problem Consider a domain of interest which is discretized into voxels. Let ( ) denote the discrete points representing the spatial locations of voxels. Then the parametric images in the discrete domain can be defined as (6) (7) (8) (9) By assembling the vectors of parametric images defined above, a matrix of size 4 is obtained
(10)
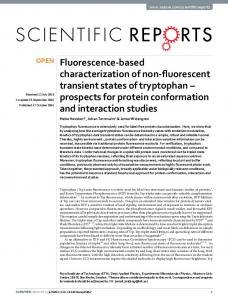
Fig. 2. Schematic diagram of the measurement approach. (a) The side view of the phantom. The blue geometry in the phantom is a target, in which the fluorophore concentration varies with time continuously. (b) The concentration curve of the target. (c) The top view of the phantom. The phantom is rotated anticlockwise, and boundary measurements are acquired at different projections. It is assumed that projections are acquired in each circle, and the phantom is continuously rotated for circles.
The boundary measurements of the dynamic FMT problem are obtained based on a hybrid FMT/XCT imaging system as shown in Fig. 1 [29]. The imaged object is placed on a rotation stage. Around the rotation stage, a line-shaped source and a charge-coupled device (CCD) camera are positioned to generate and acquire the fluorescence datasets respectively, while the XCT system is used to acquire the anatomical information of the imaged object. For dynamic FMT problems, the imaged object is rotated continuously for multiple circles in order to monitor the metabolic process of the fluorophores. Suppose that projections are acquired by the CCD in each circle and the imaged object is rotated for circles continuously (see Fig. 2). For projection ( ), measurement points are acquired. And for each circle, measurement points are collected. Let ( ) denote the discrete times at which all projections of the circles are acquired. Thus, we have (see Fig. 2).
ZHANG et al.: BAYESIAN FRAMEWORK BASED DIRECT RECONSTRUCTION OF FLUORESCENCE PARAMETRIC IMAGES
By combining (3) and (5), a mapping from the pharmacokinetic parameters to the boundary measurements is obtained in the discrete domain
(11) is the weight matrix in projection , and its entries where are defined as (12) where is the volume of each individual voxel and arises from the discretization of the volume integral in (3). Then the weight matrix for all projections in each circle can be written as .. .
(13)
denote the forward model which maps the paraLet metric image matrix to the boundary measurements. Then the boundary measurements predicted by the forward model can be obtained by assembling the values calculated in (11), as follows (14) (15) Similarly, the boundary measurements obtained from CCD can be defined as (16) (17)
1381
where is the posterior density of the unknown parametric images given the boundary measurement vector ; is the data likelihood and is the prior density for the parametric image. With the Bayesian framework, all available information about the inverse problem can be easily incorporated. It can ultimately improve the reconstruction quality because more information is used. In our proposed method, in addition to the boundary measurements, structural priors of the imaged object are also acquired from an anatomical imaging system. Therefore, MAP estimation of the unknown parametric images can be modified as [28]
(20) where is the data likelihood; is the conditional probability density function of given the structural priors , and it denotes the prior information about the unknown parametric images. It can be seen from (20) that the data likelihood model and the prior information model are two main parts of the Bayesian framework. The following sections will describe the formulations of the two models. B. The Data Likelihood Model The data likelihood model in the Bayesian framework can be constructed based on a shot-noise model described previously [35]. The shot-noise model assumes independent measurement noise that obeys the Gaussian distribution with variance proportional to the signal amplitude. The data likelihood can be given by [36]
Considering the noise of the measurement system, we can get (18) represents the additive noise vector where arising from the measurement system; is the length of vector and represents the total number of boundary measurements in the circles. III. INVERSE PROBLEM In this section, we describe our method for directly reconstructing the parametric images from the boundary measurements based on a Bayesian framework. In order to mitigate the ill-conditioned nature of the FMT inverse problem and improve the reconstruction quality, structural priors derived from a secondary anatomical imaging system are incorporated into the direct reconstruction method through the Bayesian framework. A. Bayesian Framework MAP estimation of the unknown parametric images from the boundary measurement vector based on Bayesian theorem can be written as [35]
(19)
(21) where is the total number of measurements; is an unknown hyperparameter related to the noise variance; is the covariance matrix; and for an arbitrary vector , . For dynamic FMT problem, the boundary measurements are assumed to be statistically independent. Thus becomes a diagonal matrix and is given by (22) According to the structural priors , the imaged small animal can be segmented into different organs and tissues. When the corresponding optical parameters are assigned to the segmented regions, a heterogeneous forward model is constructed, which is more accurate than the homogeneous forward model constructed without structural priors [20]. C. The Prior Information Model The available structural priors offer the opportunity to formulate a specific prior information model for the unknown image. With the structural priors, the unknown image can be segmented into non-overlapping regions, each of which is assumed to represent a specific kind of organ or tissue. For instance, the small animal can be segmented to liver, lungs,
1382
IEEE TRANSACTIONS ON MEDICAL IMAGING, VOL. 34, NO. 6, JUNE 2015
kidneys and other tissues. Because voxels in the same organ have the same or similar metabolic curves, this feature can be used to construct the prior information model. For the prior information model, we assume that the pharmacokinetic parameters ( , , and ) in each region obey Gaussian distribution, with the same mean and variance. Thus the probability density function of parametric image in the th region can be given by [28]
(23) where ,2,3,4 represents the four pharmacokinetic parameters; represents the segmented regions; is the number of the voxels in the th region; is the uniform mean value vector of size 1; is the variance of each voxel in the th region for the th pharmacokinetic parameter. It is assumed in (23) that voxels of each region have the same second-order statistical property. We assume that the pharmacokinetic parameters in different segmented regions are statistically independent. Then, given the structural priors , the probability density function of the unknown parametric image can be written as
(24) where is the total number of the voxels; is the mean value vector of the unknown parametric image ; and is the covariance matrix. They can be regarded as hyperparameters of the prior information model and are given by
(25)
(26) Furthermore, we assume that the four parametric images ( , , and ) are statistically independent. Then the prior information model defined in (20) is a joint probability density function of the four parametric images and can be given by
D. Low Dimensional Problem In order to determine the unknown hyperparameters of the prior information model, a low dimensional problem is employed. In the low dimensional problem, the indirect method is used to obtain the average pharmacokinetic parameters of the segmented regions. There are two steps in the indirect method: image reconstruction and model fitting. In the first step, the fluorophore concentration is assumed to be invariant in each circle and reconstructed circle by circle (see Fig. 2). In the second step, the reconstructed concentrations in all circles are fitted to the biexponential model defined in (5) to get the average pharmacokinetic parameters of each segmented region. In the first step, we assume that the fluorophore concentration is constant in each circle, and a single value is used to denote the average concentration of the th region in the th circle. Let denote the concentration vector of the regions in the th circle. Then a low dimensional inverse problem can be established with the following form [28]
(28) where is the boundary measurements in the th circle; is the weight matrix defined in (13) and is the same for all circles; can be seen as a matrix transformation of ; can be seen as the a priori matrix of size and is given by
.. .
..
.
.. .
(29) The low dimensional inverse problem is an overdetermined and well-conditioned problem because , thus regularization is not required in solving (28). Then the estimate of vector is simply given by [28] (30) with a size of , then each row of Let the matrix can be seen as an average metabolic curve of the corresponding segmented region. In the second step, the four average pharmacokinetic parameters of each region are estimated by fitting each row of the matrix to the biexponential model defined in (5). Let denote the estimated mean value in the th region for the th pharmacokinetic parameter in the low dimensional problem. Then an estimate of the unknown mean value vector defined in (25) can be given by
(31)
(27)
Similarly to the data likelihood model, the unknown variance of the prior information model is assumed to be proportional to
ZHANG et al.: BAYESIAN FRAMEWORK BASED DIRECT RECONSTRUCTION OF FLUORESCENCE PARAMETRIC IMAGES
the mean value. Thus with the estimated mean value, the corresponding estimate of the variance in the th region for the th pharmacokinetic parameter is given by (32) is the scale hyperparameter; represents where the segmented regions. Then (26) can be modified as
1383
In this work, an iterative algorithm based on empirical Bayesian approach is proposed to estimate the parametric images and the hyperparameter . In each iteration step of the iterative algorithm, an alternating optimization scheme is employed to solve the above joint estimation problem [18], [28], [36]. In the alternating optimization scheme, the hyperparameter estimation step is followed by the parametric image update step in which the current estimate of hyperparameter is used. The nonlinear conjugate gradient (NCG) method is chosen to find a direction that minimizes the objective function for parametric image estimation. More specifically, in each iteration, , , , and are updated sequentially according to the following relations (37)
(33)
(38)
By solving the low dimensional problem given the structural priors, estimates of the mean value vector and covariance matrix of the prior information model are obtained and will be used in the following optimization process.
where the NCG_update operation denotes one iteration of NCG algorithm. In (38), for instance, when is being updated, denotes the current estimates of other three parametric image vectors (i.e., and ) Given the current estimated parametric images , the MAP estimate of in (37) can be given in a closed form by using maximum likelihood estimation [28], as follows
E. Parametric Image Reconstruction In this section, the data likelihood and prior information models established in previous sections are used to formulate the objective function to be optimized. Then an iterative algorithm is proposed to perform the optimization progress and obtain the MAP estimates of the parametric images. The data likelihood and prior information models defined in (20) have been modeled in (21) and (27), respectively. The estimates of the hyperparameters used in the prior information model have also been given in the low dimensional problem. Thus, by substituting (21), (27), (31) and (33) into (20), and removing the constant terms, the objective function for parametric image reconstruction can be obtained as
(34) ( ,2,3,4) can be seen The unknown hyperparameters as the regularization parameters which balance the contribution between the data term and the prior term. Because are empirically chosen as fixed values based on measurement noise levels in the optimization process, the objective function can be simplified as
(35) Then, the parametric image reconstruction becomes a joint estimation given by (36)
(39) This closed form will reduce the computation complexity of hyperparameter estimation to the minimum. The calculation of gradient vectors of the objective function has been given in Appendix. IV. METHODS FOR COMPARISON For the purpose of comparison, two methods using structural priors to obtain parametric images have also been considered: an indirect method and a direct method. The direct method has been detailed in our previous work [21]. The indirect method, similar to the low dimensional problem, also includes two steps: image reconstruction and model fitting. In the first step of the indirect method, the fluorophore concentration is assumed to be invariant in each circle and reconstructed circle by circle. Let denote the fluorescence image of the voxels in the th circle. Then the fluorescence image can be reconstructed based on Tikhonov regularization (40) where is the boundary measurements in the th circle; is the weight matrix and is the same for all circles; is the regularization parameter; is a Laplacian-type matrix which can be constructed based on the structural priors [37]. The minimization is performed using the least-squares algorithm (LSQR) [38]. In the second step, after the fluorescence images of circles are all reconstructed and the corresponding image matrix with a size of is assembled, the four pharmacokinetic parameters of each voxel can be estimated by
1384
IEEE TRANSACTIONS ON MEDICAL IMAGING, VOL. 34, NO. 6, JUNE 2015
TABLE I PHARMACOKINETIC PARAMETERS USED IN THE NUMERICAL SIMULATIONS
Fig. 3. Numerical simulation settings. (a) The 3-D Digimouse model used for simulations. The mouse torso from the neck to the bottom of kidneys was selected as the investigated region, totally 3.1 cm in length. Three organs were included in the model: liver, lungs and kidneys. In the liver, an IRI region was simulated. (b) ICG concentration curves simulating the metabolic processes of ICG in different metabolic regions. The corresponding pharmacokinetic parameters of the curves are shown in Table I.
fitting each row of the matrix to the biexponential model defined in (5). Then, the parametric images are estimated with the indirect method. V. RESULTS Numerical simulations and in vivo mouse experiments were carried out to evaluate the performance of the proposed direct method (MAP-Direct), the direct method proposed in [21] (Lap-Direct), and the indirect method described in Section IV. In the MAP-Direct method, the NCG_update operation was implemented with 200 iterations. In the Lap-Direct method, the minimization was solved by the coordinate decent algorithm with 200 iterations [21]. In the indirect method, the minimization in the first step was solved by the LSQR algorithm with 200 iterations [21]. Model fitting in both the Lap-Direct and indirect methods was implemented with the nonlinear least squares fitting function (lsqnonlin) in Matlab R2008a (MathWorks, Natick, MA, USA). The programs were performed on a personal computer with Intel(R) Core (TM) i3–3240 CPU (3.4 GHz) and 4 GB memory. All reconstruction results were three-dimensional (3-D) parametric images with a voxel size of 1 mm 1 mm 1 mm. Based on the structural priors, by assigning the corresponding optical properties to the segmented organs [20], a heterogeneous FMT forward model was constructed and used in both the numerical simulations and mouse experiments. A. Numerical Simulations Numerical simulations were first implemented to test the performance of the proposed method. In the numerical simulations, the Digimouse atlas [39] was employed to construct a 3-D simulation model. The simulation model shown in Fig. 3(a) includes three different organs: liver, lungs and kidneys. In the liver, an ischemia-reperfusion injury (IRI) region (3 mm 3 mm 3 mm) which had different metabolic features was simulated according to [34]. Fig. 3(b) shows the ICG concentration curves which mimic different metabolic processes of ICG in different organs and other tissues. The ICG curves are obtained according to (5), and the corresponding pharmacokinetic parameters are shown in Table I [5], [33].
Fig. 4. Segmented XCT results of the numerical simulations. (a)–(c) Segmented XCT slices indicated by the red, cyan and blue lines in Fig. 3(a), respectively. The model was segmented into liver, lungs, kidneys and other tissues. The IRI region in the liver cannot be seen in XCT images. The segmentation results were used as the structural priors in the three methods.
Fig. 4 shows the segmented XCT results of the numerical simulations. Fig. 4(a) shows the segmented XCT slice across the center of the IRI region. This representative slice of liver is indicated by the red line in Fig. 3(a). It was segmented into liver and other tissues, and the IRI region cannot be seen in the XCT images. Fig. 4(b) shows the segmented XCT slice indicated by the cyan line in Fig. 3(a), and it is the representative slice of lungs. Fig. 4(c) shows the segmented XCT slice indicated by the blue line shown in Fig. 3(a), and it is the representative slice of kidneys. The whole simulation model was segmented to liver, lungs, kidneys and other tissues. The segmentation results were the structural priors used in the three methods. The dynamic FMT boundary measurements of the simulation model were generated based on the approach shown in Fig. 2. In detail, a line-shaped excitation source with the same length as the simulation model was used. The simulation model was rotated continousely for 60 circles ( ) at a rotational speed of one circle per minute. For each circle, 24 projections ( ) were acquired with an angular increment of 15 . The ICG concentrations in different organs and tissues varied in each projection following the curves shown in Fig. 3(b). The coupled diffusion equations defined in (1) were used to generate the optical fields at the excitation and emission wavelengths due to the use of the line-shaped excitation source. Then, in total were acquired. The simulation model was discretized into 8743 voxels ( ) with a voxel size of 1 mm 1 mm 1 mm. For each circle, 9443 measurement points ( ) were collected from the 24 projections. Thus, measurement points in total were acquired for the 60 circles (i.e., the boundary measurements). The indirect, Lap-Direct and MAP-Direct methods were implemented to process the boundary measurements and obtain the parametric images. The reconstruction results are shown in Figs. 5–7. The unknown hyperparameters of the MAP-Direct
ZHANG et al.: BAYESIAN FRAMEWORK BASED DIRECT RECONSTRUCTION OF FLUORESCENCE PARAMETRIC IMAGES
Fig. 5. Parametric images (a.u.), (a.u.), ( ) and ( ) of the numerical simulations. This is the representative slice of liver shown in Fig. 4(a). The true parametric images were obtained according to Table I. The parametric images obtained with the three methods were reconstructed from the noise-free boundary measurements.
Fig. 6. Parametric images (a.u.), (a.u.), ( ) and ( ) of the numerical simulations. This is the representative slice of lungs shown in Fig. 4(b). The true parametric images were obtained according to Table I. The parametric images obtained with the three methods were reconstructed from the noise-free boundary measurements.
method were set as , , , . The regularization parameters of the indirect and Lap-Direct methods were both set as .
1385
Fig. 7. Parametric images (a.u.), (a.u.), ( ) and ( ) of the numerical simulations. This is the representative slice of kidneys shown in Fig. 4(c). The true parametric images were obtained according to Table I. The parametric images obtained with the three methods were reconstructed from the noise-free boundary measurements.
Fig. 5 shows the parametric images corresponding to the slice shown in Fig. 4(a). Fig. 5(a)–(d) are the true parametric images obtained according to Table I. The IRI region in the liver has different pharmacokinetic parameters and thus can be distinguished from the liver in the parametric images. Fig. 5(e)–(p) show the parametric images reconstructed by the indirect, Lap-Direct and MAP-Direct methods, respectively. It can be seen that the indirect method obtains noisy results, especially for parametric images and (see Fig. 5(e)–(h)). Although the Lap-Direct method obtains better results by taking advantage of direct reconstruction strategy, it also suffers from noisy results (see Fig. 5(i)–(l)). In contrast, the MAP-Direct method obtains the least noisy results among the three methods. Besides, it can also be seen that the IRI region in the liver has the best contrast in the parametric images obtained with the MAP-Direct method. Figs. 6 and 7 are the parametric images corresponding to the slices shown in Fig. 4(b) and (c), respectively. Similarly to Fig. 5, it can be seen that the MAP-Direct method also obtains the best image quality in the representative slices of lungs and kidneys among the three methods. In order to quantitatively evaluate the reconstruction quality, the normalized root-mean-square error (NRMSE) was used [35]. The NRMSE is defined as
(41) where and are the true and reconstructed 3-D images, respectively. Besides, the contrast-to-noise ratio (CNR) was used
1386
IEEE TRANSACTIONS ON MEDICAL IMAGING, VOL. 34, NO. 6, JUNE 2015
TABLE II NRMSES OF THE PARAMETRIC IMAGES OBTAINED WITH THE INDIRECT, LAP-DIRECT AND MAP-DIRECT METHODS
CNRS
TABLE III PARAMETRIC IMAGES OBTAINED WITH THE INDIRECT, LAP-DIRECT AND MAP-DIRECT METHODS
OF THE
to evaluate the contrast of the IRI region to the liver [28]. The CNR is defined as
Fig. 8. NRMSEs and CNRs of the parametric images reconstructed with difwas set to be 1/10, 1/5, 1, 5 and 10 times of the ferent hyperparameter . , while the other three hyperparameters (i.e., , baseline value and ) kept constant. (a)–(d) NRMSEs and CNRs of parametric images , , and , respectively.
(42) where the subscript ROI and BCK denote the IRI region and liver in the 3-D simulation model, respectively. and are the mean value and variance, respectively. and are weighting factors determined by the relative volumes of ROI and background. Smaller NRMSE and higher CNR indicate better reconstruction quality. Tables II and III show the NRMSEs and CNRs of the parametric images obtained with the three methods, respectively. The MAP-Direct method obtains the smallest NRMSEs, which demonstrate that the results obtained with the MAP-Direct method are the closest to the true parametric images. Besides, the MAP-Direct method obtains the highest CNRs, which demonstrate that the IRI region has the highest contrast to the liver using the MAP-Direct method. The NRMSEs and CNRs also confirm the observations made in Figs. 5–7. In the MAP-Direct method, the hyperparameters ( ,2,3,4) were manually determined and used as the regularization parameters to balance the contribution between the data term and the prior term. In order to investigate the influence of the choice of hyperparameters on the reconstruction performance, further simulations were carried out. Since the four hyperparameters correspond to the four parametric images ( , , and ) respectively and are independent of each other, we have chosen as the representative hyperparameter to discuss and kept the other three hyperparameters constant. In detail, with the other three hyperparameters (i.e., and ) being constant, the hyperparameter was set to be 1/10, 1/5, 5 and 10 times of the baseline value , respectively. Then, the MAP-Direct method was implemented with different values. Fig. 8 shows the NRMSEs and CNRs of the corresponding reconstruction results. It can be seen that the variation of has very little influence on the reconstruction quality of parametric images , and (see Fig. 8(a), (b) and (d)). Nevertheless, the variation of has relatively obvious influence on the reconstruction quality of parametric image (see Fig. 8(c)). This is because is the regularization parameter for parametric
Fig. 9. NRMSEs at different noise levels ( (a)–(d) NRMSEs of parametric images , ,
, 35, 30, 25 and 20 dB). and , respectively.
image . It can be seen from Fig. 8(c) that a smaller tends to result in a smaller NRMSE, while equal to baseline value results in the highest CNR. Thus, the baseline value is an optimal choice of which can balance the reconstruction error and image contrast. Besides, it can be seen that the MAP-Direct method still obtains the best reconstruction quality among the three methods, even when the value of deviates far from the optimal value (see Fig. 8, Tables II and III). In order to test the performance of the proposed method in the case with measurement noise, different intensities of zero-mean white Gaussian noise were added into the boundary measurements with SNR set as 40, 35, 30, 25 and 20 dB, respectively. The three methods were implemented to process these noisy measurements and obtain the parametric images. Fig. 9 shows the NRMSEs at the five different noise levels for parametric images , , and . It can be seen that the parametric images obtained with the MAP-Direct method have the smallest NRMSEs at all the five noise levels. Fig. 10 shows the CNRs at different noise levels. It can be seen that the MAP-Direct method also
ZHANG et al.: BAYESIAN FRAMEWORK BASED DIRECT RECONSTRUCTION OF FLUORESCENCE PARAMETRIC IMAGES
Fig. 10. CNRs at different noise levels ( , 35, 30, 25 and 20 dB). The CNR represents the contrast of the IRI region to the liver. (a)–(d) CNRs of parametric images , , and , respectively.
TABLE IV TIME COSTS (MIN) OF THE INDIRECT, LAP-DIRECT AND MAP-DIRECT METHODS IN THE NUMERICAL SIMULATIONS
obtains the highest contrast of the IRI region to the liver among the three methods. Finally, in order to quantitatively evaluate the computational burden of the three methods, the time costs of the three methods are shown in Table IV. It can be seen that the time cost of the MAP-Direct method is higher than the other two methods. The computational burden of the MAP-Direct method mainly comes from the calculation of its unique forward model, which can enable full utilization of the temporal correlations of boundary measurements to improve the reconstruction quality of parametric images. B. Mouse Experiments Mouse experiments were conducted under the protocol approved by the Institutional Animal Care and Use Committee of Tsinghua University. Briefly, a healthy BALB/c nude mouse (about eight weeks old) was fixed on the rotation stage of the hybrid FMT/XCT system [29] and anesthetized during the experiments, as shown in Fig. 1. A bolus of ICG (0.1 mL, 50 ) was injected through the tail vein. For dynamic FMT imaging, the mouse was rotated continuously for 70 circles ( ) to monitor the metabolic process of ICG in the body. For each circle, 24 projections ( ) were acquired with an angular increment of 15 . Then, projections in total were acquired. All projections were recorded by a 512 512 pixel, cooled CCD camera (Andor, Belfast, Northern Ireland, U.K.). The exposure time of CCD was set to 1 s, and the CCD binning was set to 2 2. The rotational speed of the mouse was 8 , and the total rotation time of full 360 was 45 s. As a result, the FMT imaging time for each circle was about 69
1387
Fig. 11. XCT results of the mouse experiments. The mouse torso from the neck to the bottom of kidneys was selected as the investigated region, totally 3.2 cm in length. (a) Representative coronal XCT slice. (b)–(d) Transversal XCT slices indicated by the green, cyan and blue dashed lines in (a), respectively. (e)–(g) Segmentation results for (b)–(d). All transversal XCT slices getting from the mouse torso in (a) were manually segmented into liver, lungs, kidneys and other tissues. The segmentation results were used as the structural priors in the three methods.
s( ), and the total FMT imaging time for all circles was about 80 min ( ). A line-shaped excitation source with a length of 4 cm provided by a Xenon lamp was used as the excitation source. Fluorescence images were acquired with a excitation filter and an emission filter. After collecting the fluoresence datesets, a hepatobiliary contrast agent for XCT imaging, Fenestra LC (Advanced Research Technologies, Montreal, CA) was injected at a dose of 15 mL/kg body weight through the tail vein. One hour after the injection, the XCT datasets were collected to get the anatomical information of the mouse. For XCT imaging, the X-ray source voltage and current were set to 45 kV and 1 mA, respectively. The rotational speed of the mouse was 3.6 , and the total rotation time of full 360 was 100 s. Full-agle X-ray projections were obtianed with an angular increment of 1 , and the imaging time of each projection was 1.25 s. As a result, the total XCT imaging time was about 9.2 min ( ). Fig. 11 shows the XCT results of the mouse. Fig. 11(a) is a representative coronal XCT slice, and shows the region selected for 3-D reconstruction. Fig. 11(b)–(d) are the transversal XCT slices indicated by the green, cyan and blue dashed lines in Fig. 11(a), respectively. All transversal XCT slices were manually segmented to liver, lungs, kidneys and other tissues. Fig. 11(e)–(g) are the segmentation results for Fig. 11(b)–(d), respectively. A heterogeneous FMT forward model was constructed by assigning the corresponding optical parameters to the segmented organs according to [20]. The segmentation results were used as the structural priors in the three methods. For dynamic FMT reconstruction, the investigated region of the mouse was discretized into 5662 voxels ( ) with a voxel size of 1 mm 1 mm 1 mm. For each circle, 5058 measurement points ( ) were collected from the 24 projections. Thus, measurement points in total were acquired for the 70 circles (i.e., the boundary measurements). Figs. 12–14 show the parametric images of the mouse experiments obtained with the indirect, Lap-Direct and MAP-Direct methods, respectively. The unknown hyperparameters of
1388
Fig. 12. Parametric images (a.u.), (a.u.), ( ) and ( ) corresponding to the representative slice of the mouse liver shown in Fig. 11(e).
IEEE TRANSACTIONS ON MEDICAL IMAGING, VOL. 34, NO. 6, JUNE 2015
Fig. 14. Parametric images (a.u.), (a.u.), ( ) and ( ) corresponding to the representative slice of the mouse kidneys shown in Fig. 11(g).
TABLE V ) OF PHARMACOKINETIC STATISTICAL RESULTS ( PARAMETERS IN THE MOUSE LIVER
Fig. 13. Parametric images (a.u.), (a.u.), ( ) and ( ) corresponding to the representative slice of the mouse lungs shown in Fig. 11(f).
the MAP-Direct method were set as , , , . The regularization parameters of the indirect and Lap-Direct methods were both set as . Since the pharmacokinetic parameters and only have arbitrary unit without knowing the gain of the FMT system, the two parameters are normalized by the mean value of in the liver [21]. Fig. 12 shows the parametric images corresponding to the representative slice of liver shown in Fig. 11(e). Similarly to the numerical simulations, it can be observed in Fig. 12 that the MAP-Direct method obtains the best image quality among the three methods. Since and ( ) are the rate constants for ICG influx to and outflux from the liver, they can be used to quantitatively evaluate liver function. Image reflects the microcirculatory conditions of the liver, while image reflects the cytoplasmic transport and biliary excretion conditions of the liver [34]. Fig. 13 shows the parametric images corresponding to the representative slice of lungs shown in Fig. 11(f), and Fig. 14 shows the parametric images corresponding to the representative slice of kidneys shown in Fig. 11(g). Similarly to Fig. 12, it can be seen that the MAP-Direct method also obtains the best image quality among the three methods.
For validation purpose in the mouse experiments, the pharmacokinetic parameters obtained with an invasive method are used as the reference values. A fiber-based fluorescence measurement system was previously used to invasively acquire the ICG metabolic curves of mouse livers under the same experimental conditions [20]. Briefly, four mice were measured with this system. During the experiment, each mouse was anesthetized and a laparotomy was performed to expose the liver. A fiber was then inserted to have a direct contact with the surface of the mouse liver. The mice were injected with the same dose of ICG through the tail vein as described previously. The pharmacokinetic parameters of mouse livers obtained with the fiber-based system are shown in Table V. These values are expressed as (SD). Besides, Table V also shows the pharmacokinetic parameters of the mouse liver obtained with the indirect, Lap-Direct and MAP-Direct methods. These values are calculated according to the reconstructed 3-D parametric images in the whole liver region, and they are also expressed as . The mean values reflect the average pharmacokinetic parameters of the mouse liver, and the SD values reflect the spatial variation in the reconstructed parametric images. It can be seen in Table V that the mean values of pharmacokinetic parameters obtained with the three methods are similar to those obtained with the fiber-based system, which can quantitatively validate the accuracy of the three methods. Nevertheless, it can also
ZHANG et al.: BAYESIAN FRAMEWORK BASED DIRECT RECONSTRUCTION OF FLUORESCENCE PARAMETRIC IMAGES
TABLE VI TIME COSTS (MIN) OF THE INDIRECT, LAP-DIRECT AND MAP-DIRECT METHODS IN THE MOUSE EXPERIMENTS
be seen that the MAP-Direct method obtains the lowest SD values among the three methods, which is in accord with the observations in Fig. 12. This can quantitatively confirm that the MAP-Direct method obtains the best image quality, since the tissues in the same organ have similar metabolic features [5], [6]. The reconstruction results of the mouse experiments further validate the performance of the proposed MAP-Direct method. Finally, the time costs of the three methods for the mouse experiments are shown in Table VI. Similarly to the numerical simulations, the time cost of the MAP-Direct method is higher than the other two methods. VI. DISCUSSION AND CONCLUSION Parametric images obtained by combining dynamic fluorescence molecular tomography and compartmental modeling can provide quantitative information about the metabolic process of fluorescent biomarkers, and thus have significant values in tumor detection, drug development and metabolic research. However, the low spatial resolution of FMT and the high temporal variation of fluorescent biomarkers together make it difficult to get accurate parametric images in small animals in vivo. The main goal of this paper is to make full use of structural priors and temporal correlations of boundary measurements to improve the reconstruction quality of parametric images. In our previous work [20], [21], it has been proven that structural priors obtained from XCT system can be used to improve the quality of parametric images. In this work, it can be seen that the parametric images obtained with the Lap-Direct method are less noisy than those obtained with the indirect method (see Figs. 5–7 and 12–14). This is because the Lap-Direct method can utilize both structural priors and temporal correlations of boundary measurements to improve image quality, while the indirect method has only utilized structural priors. However, the Lap-Direct method has not obtained satisfactory results, especially for parametric images (see Figs. 5(i), 6(i) and 7(i)) and (see Figs. 5(k), 6(k) and 7(k)). The reason is that the Lap-Direct method cannot make full use of temporal correlations due to the regularization on dynamic FMT images, because this regularization implicitly assumes that the fluorophore concentration is invariant in each frame. In contrast, the MAP-Direct method can fully utilize both structural priors and temporal correlations by directly applying regularization on parametric images based on the Bayesian framework, and thus obtains the best image quality. These observations have been quantitatively confirmed by NRMSEs and CNRs in the numerical simulations (see Tables II and III, Figs. 9 and 10). Besides, it can be seen that
1389
the indirect method obtains distorted organ shapes in the reconstructed parametric images (see Figs. 5–7 and 12–14). This is mainly caused by the assumption that the fluorophore concentrations of the organs are invariant in each circle/frame, while it is untrue for the dynamic FMT problem (see Fig. 2). The untrue assumption ultimately causes the distortion of the reconstructed organ shapes, which has also been reported in our previous work [40]. In contrast, the MAP-Direct method allows the fluorophore concentrations varying in each circle (see Fig. 2), and thus can fully utilize the temporal correlations of different projections in the same circle to improve the reconstruction quality of parametric images. In this work, the pharmacokinetic parameters in each organ are assumed to obey the Gaussian distribution. This is because the tissues in the same organ have similar metabolic features [5], [6], and this similarity can be excellently described by the Gaussian distribution. The mean of the Gaussian distribution can be used to describe the same metabolic features of the whole organ, while the variance of the Gaussian distribution can allow the pharmacokinetic parameter of each voxel in the same organ to have a reasonable fluctuation. Besides, compared with other probability distributions, the Gaussian distribution typically leads to objective functions with quadratic forms, which can ultimately make the optimization processes easy to implement [28], [36]. Although the proposed MAP-Direct method is based on a free-space, full-angle FMT imaging system, it can also be extended to a planar geometry system [14] or fiber coupled system [41]. Besides, the formulas and algorithms described in this work can be utilized to address the reconstruction of parametric images for PET or single photon emission computed tomography (SPECT) contrast agents by replacing the dynamic FMT forward model with the appropriate forward models for dynamic PET and SPECT imaging. ICG is utilized as the fluorescent agent in this work to investigate the functions of organs in small animals in vivo. A further application is to label substances of interest such as drugs and nutrients with fluorophores and use dynamic FMT imaging to explore the 3-D biodistribution and pharmacokinetics of these substances. Nevertheless, there are several concerns for the MAP-Direct method. First, the hyperparameters which serve as the regularization parameters are manually determined. Although it makes it flexible to obtain good reconstruction results, the selection process of hyperparameters is inconvenient, and it is an open question for the direct methods [18], [22], [23]. Methods for automatically estimating the hyperparameters may be used to solve this problem [36]. Second, although the MAP-Direct method can obtain better reconstruction quality of parametric images, its time cost is higher than the other two methods. Compression methods may be used to reduce the computational burden and accelerate the reconstruction process [42], [43]. Finally, it is still challenging to validate the performance of the direct methods in the in vivo experiments [19], [44]. Although the reconstruction results of the mouse experiments have been validated with an invasive fiber-based system in this work, dual-labeled fluorescence probes (e.g., dual-labeled PET and
1390
IEEE TRANSACTIONS ON MEDICAL IMAGING, VOL. 34, NO. 6, JUNE 2015
fluorescence probes [45], [46]) may be used to further validate the performance of the proposed method noninvasively. In conclusion, we have presented a novel approach for direct reconstruction of parametric images in dynamic FMT based on the Bayesian framework. By taking advantage of structural priors and temporal correlations of boundary measurements, the proposed method shows significant improvements in the reconstruction quality of parametric images, and provides an attractive reconstruction approach for dynamic optical imaging technique. Future works will focus on applying the proposed method in small animals bearing tumors or having organ diseases. APPENDIX GRADIENT VECTORS OF THE OBJECTIVE FUNCTION Substituting (39) into (35), the objective function defined in (35) can be modified as
(43) In order to calculate the gradient vectors conveniently, the objective function is divided into two parts (44) (45) The gradient vectors of with respect to parametric images (i.e., , , and ) are given by
(46)
(47)
(48)
(49) The gradient vectors of ages are given by
with respect to parametric im-
(50)
REFERENCES [1] V. Ntziachristos, A. G. Yodh, M. Schnall, and B. Chance, “Concurrent MRI and diffuse optical tomography of breast after indocyanine Green enhancement,” Proc. Nat. Acad. Sci. USA, vol. 97, pp. 2767–2772, 2000.
[2] M. Gurfinkel et al., “Pharmacokinetics of ICG and HPPH-car for the detection of normal and tumor tissue using fluorescence, near-infrared reflectance imaging: A case study,” Photochem. Photobiol., vol. 72, pp. 94–102, 2000. [3] D. J. Cuccia et al., “In vivo quantification of optical contrast agent dynamics in rat tumors by use of diffuse optical spectroscopy with magnetic resonance imaging coregistration,” Appl. Opt., vol. 42, no. 1, pp. 2940–2950, Jun. 2003. [4] X. Intes et al., “In vivo continuous-wave optical breast imaging enhanced with indocyanine green,” Med. Phys., vol. 30, no. 6, pp. 1039–1047, 2003. [5] E. M. C. Hillman and A. Moore, “All-optical anatomical co-registration for molecular imaging of small animals using dynamic contrast,” Nat. Photon., vol. 1, pp. 526–530, 2007. [6] K. Welsher, S. P. Sherlock, and H. Dai, “Deep-tissue anatomical imaging of mice using carbon nanotube fluorophores in the second near-infrared window,” Proc. Nat. Acad. Sci. USA, vol. 108, no. 22, pp. 8943–8948, May 2011. [7] E. M. C. Hillman et al., “In vivo optical imaging and dynamic contrast methods for biomedical research,” Phil. Trans. R. Soc. A, vol. 369, no. 1955, pp. 4620–4643, Nov. 2011. [8] C. B. Amoozegar et al., “Dynamic contrast enhanced optical imaging of in-vivo organ function,” J. Biomed. Opt., vol. 17, no. 9, pp. 0960031–096003-6, Sep. 2012. [9] M. Choi, K. Choi, S. W. Ryu, J. Lee, and C. Choi, “Dynamic fluorescence imaging for multiparametric measurement of tumor vasculature,” J. Biomed. Opt., vol. 16, no. 4, pp. 046008-1–046008-7, Apr. 2011. [10] M. B. Unlu, B. Ozlem, and G. Gulsen, “A simulation study of the variability of indocyanine green kinetics and using structural a priori information in dynamic contrast enhanced diffuse optical tomography (DCE-DOT),” Phys. Med. Biol., vol. 53, no. 12, pp. 3189–3200, 2008. [11] K. O. Vasquez, C. Casavant, and J. D. Peterson, “Quantitative whole body biodistribution of fluorescent-labeled agents by non-invasive tomographic imaging,” PLoS One, vol. 6, no. 6, pp. e20594-1–e20594-12, Jun. 2011. [12] B. Alacam, B. Yazici, X. Intes, S. Nioka, and B. Chance, “Pharmacokinetic-rate images of indocyanine green for breast tumors using near-infrared optical methods,” Phys. Med. Biol., vol. 53, no. 4, pp. 837–859, Feb. 2008. [13] A. Taruttis, S. Morscher, N. C. Burton, D. Razansky, and V. Ntziachristos, “Fast multispectral optoacoustic tomography (MSOT) for dynamic imaging of pharmacokinetics and biodistribution in multiple organs,” PLoS One, vol. 7, no. 1, pp. e30491-1–e30491-6, Jan. 2012. [14] S. V. Patwardhan, S. R. Bloch, S. A. Achilefu, and J. P. Culver, “Time dependent whole-body fluorescence tomography of probe bio-distributions in mice,” Opt. Exp., vol. 13, no. 7, pp. 2564–2577, Apr. 2005. [15] X. Liu et al., “Imaging of indocyanine green perfusion in mouse liver with fluorescence diffuse optical tomography,” IEEE Trans. Biomed. Eng., vol. 58, no. 8, pp. 2139–2143, Aug. 2011. [16] X. Liu, F. Liu, Y. Zhang, and J. Bai, “Unmixing dynamic fluorescence diffuse optical tomography images with independent component analysis,” IEEE Trans. Med. Imag., vol. 30, no. 9, pp. 1591–1604, Sep. 2011. [17] M. Hsing, Y. Lin, and G. Gulsen, “Pharmacokinetic analysis for tumor characterization using MR-guided dynamic contrast enhanced diffuse optical tomography,” Biomed. Opt. 3D Imag., vol. BTu2A.3, 2012. [18] A. B. Milstein, K. J. Webb, and C. A. Bouman, “Estimation of kinetic model parameters in fluorescence optical diffusion tomography,” J. Opt. Soc. Am. A, vol. 22, no. 7, pp. 1357–1368, 2005. [19] B. Alacam and B. Yazici, “Direct reconstruction of pharmacokineticrate images of optical fluorophores from NIR measurements,” IEEE Trans. Med. Imag., vol. 28, no. 9, pp. 1337–1353, Sep. 2009. [20] G. Zhang et al., “Imaging of pharmacokinetic rates of indocyanine green in mouse liver with a hybrid fluorescence molecular tomography/ x-ray computed tomography system,” J. Biomed. Opt., vol. 18, no. 4, pp. 040505-1–040505-3, Apr. 2013. [21] G. Zhang et al., “A direct method with structural priors for imaging pharmacokinetic parameters in dynamic fluorescence molecular tomography,” IEEE Trans. Biomed. Eng., vol. 61, no. 3, pp. 986–990, Mar. 2014. [22] M. Kamasak, C. A. Bouman, E. D. Morris, and K. Sauer, “Direct reconstruction of kinetic parameter images from dynamic PET data,” IEEE Trans. Med. Imag., vol. 24, no. 5, pp. 636–650, May 2005. [23] G. Wang and J. Qi, “Generalized algorithms for direct reconstruction of parametric images from dynamic PET data,” IEEE Trans. Med. Imag., vol. 28, no. 11, pp. 1717–1726, Nov. 2009.
ZHANG et al.: BAYESIAN FRAMEWORK BASED DIRECT RECONSTRUCTION OF FLUORESCENCE PARAMETRIC IMAGES
[24] J. Tang, H. Kuwabara, D. F. Wong, and A. Rahmim, “Direct 4D reconstruction of parametric images incorporating anato-functional joint entropy,” Phys. Med. Biol., vol. 55, no. 15, pp. 4261–4272, 2010. [25] C. C. Martin et al., “The pharmacokinetics of hyperpolarized xenon: Implications for cerebral MRI,” J. Magn. Reson. Imag., vol. 7, no. 5, pp. 848–854, 1997. [26] B. M. Kelm, B. H. Menze, O. Nix, C. M. Zechmann, and F. A. Hamprecht, “Estimating kinetic parameter maps from dynamic contrast-enhanced MRI using spatial prior knowledge,” IEEE Trans. Med. Imag., vol. 28, no. 10, pp. 1534–1547, Oct. 2009. [27] L. Chen et al., “Tissue-specific compartmental analysis for dynamic contrast-enhanced MR imaging of complex tumors,” IEEE Trans. Med. Imag., vol. 30, no. 12, pp. 2044–2058, Dec. 2011. [28] G. Zhang et al., “MAP estimation with structural priors for fluorescence molecular tomography,” Phys. Med. Biol., vol. 58, no. 2, pp. 351–372, 2013. [29] X. Guo et al., “A combined fluorescence and micro-computed tomography system for small animal imaging,” IEEE Trans. Biomed. Eng., vol. 57, no. 12, pp. 2876–2883, Dec. 2010. [30] R. B. Schulz et al., “Hybrid system for simultaneous fluorescence and x-ray computed tomography,” IEEE Trans. Med. Imag., vol. 29, no. 2, pp. 465–473, Feb. 2010. [31] D. Wang, X. Liu, and J. Bai, “Analysis of fast full angle fluorescence diffuse optical tomography with beam-forming illumination,” Opt. Exp., vol. 17, no. 24, pp. 21376–21395, Nov. 2009. [32] F. Liu, X. Liu, D. Wang, and J. Bai, “A parallel excitation based fluorescence molecular tomography system for whole-body simultaneous imaging of small animals,” Ann. Biomed. Eng., vol. 38, no. 11, pp. 3440–3448, Nov. 2010. [33] L. Chen et al., “CAM-CM: A signal deconvolution tool for in vivo dynamic contrast-enhanced imaging of complex tissues,” Bioinformatics, vol. 27, no. 18, pp. 2607–2609, Jul. 2011. [34] H. Shinohara et al., “Direct measurement of hepatic indocyanine green clearance with near-infrared spectroscopy: Separate evaluation of uptake and removal,” Hepatology, vol. 23, no. 1, pp. 137–144, 1996.
1391
[35] J. C. Ye, K. J. Webb, C. A. Bouman, and R. P. Millane, “Optical diffusion tomography using iterative coordinate descent optimization in a Bayesian framework,” J. Opt. Soc. Am. A, vol. 16, no. 10, pp. 2400–2412, Oct. 1999. [36] M. Guven, B. Yazici, X. Intes, and B. Chance, “Diffuse optical tomography with a priori anatomical information,” Phys. Med. Biol., vol. 50, pp. 2837–2858, 2005. [37] S. C. Davis et al., “Image-guided diffuse optical fluorescence tomography implemented with Laplacian-type regularization,” Opt. Exp., vol. 15, no. 7, pp. 4066–4082, 2007. [38] C. C. Paige and M. A. Saunders, “LSQR: An algorithm for sparse linear equations and sparse least squares,” ACM Trans. Math. Softw., vol. 8, no. 1, pp. 43–71, 1982. [39] B. Dogdas, D. Stout, A. F. Chatziioannou, and R. M. Leahy, “Digimouse: A 3D whole body mouse atlas from CT and cryosection data,” Phys. Med. Biol., vol. 52, pp. 577–587, 2007. [40] W. He et al., “Modified forward model for eliminating the time-varying impact in fluorescence molecular tomography,” J. Biomed. Opt., vol. 19, no. 5, pp. 056012-1–056012-8, May 2014. [41] V. Ntziachristos and R. Weissleder, “Charge-coupled-device based scanner for tomography of fluorescent near-infrared probes in turbid media,” Med. Phys., vol. 29, no. 5, pp. 803–809, May 2002. [42] P. Mohajerani and V. Ntziachristos, “Compression of Born ratio for fluorescence molecular tomography/x-ray computed tomography hybrid imaging: Methodology and in vivo validation,” Opt. Lett., vol. 38, no. 13, pp. 2324–2326, 2011. [43] X. Cao et al., “Accelerated image reconstruction in fluorescence molecular tomography using dimension reduction,” Biomed. Opt. Exp., vol. 4, no. 1, pp. 1–14, 2013. [44] G. Wang and J. Qi, “An optimization transfer algorithm for nonlinear parametric image reconstruction from dynamic PET data,” IEEE Trans. Med. Imag., vol. 31, no. 10, pp. 1977–1988, Oct. 2012. [45] M. Nahrendorf et al., “Hybrid PET-optical imaging using targeted probes,” Proc. Nat. Acad. Sci. USA, vol. 107, no. 17, pp. 7910–7915, 2010. [46] L. Zhu et al., “Dynamic PET and optical imaging and compartment modeling using a dual-labeled cyclic RGD peptide probe,” Theranostics, vol. 2, no. 8, pp. 746–756, 2012.