DOI: 10.1111/j.1541-0420.2009.01267.x
Biometrics
Bayesian Methods for Examining Hardy–Weinberg Equilibrium Jon Wakefield∗ Departments of Statistics and Biostatistics, University of Washington, Box 357232, Seattle, Washington 98195-7232, U.S.A. ∗ email:
[email protected] Summary. Testing for Hardy–Weinberg equilibrium is ubiquitous and has traditionally been carried out via frequentist approaches. However, the discreteness of the sample space means that uniformity of p-values under the null cannot be assumed, with enumeration of all possible counts, conditional on the minor allele count, offering a computationally expensive way of p-value calibration. In addition, the interpretation of the subsequent p-values, and choice of significance threshold depends critically on sample size, because equilibrium will always be rejected at conventional levels with large sample sizes. We argue for a Bayesian approach using both Bayes factors, and the examination of posterior distributions. We describe simple conjugate approaches, and methods based on importance sampling Monte Carlo. The former are convenient because they yield closed-form expressions for Bayes factors, which allow their application to a large number of single nucleotide polymorphisms (SNPs), in particular in genome-wide contexts. We also describe straightforward direct sampling methods for examining posterior distributions of parameters of interest. For large numbers of alleles at a locus we resort to Markov chain Monte Carlo. We discuss a number of possibilities for prior specification, and apply the suggested methods to a number of real datasets. Key words: level.
Bayes factors; Exact test; Genome-wide association studies; Importance sampling; Prior choice; Significance
1. Introduction The testing of Hardy–Weinberg equilibrium (HWE) is an important step in many analyses of genetic data. Frequentist methods are popular for testing HWE, with χ2 and exact tests providing the usual implementations. There are a number of important complications that require consideration when such approaches are used. A first problem is that the discreteness of the sample space leads to nonuniformity of p-values under the null (Rohlfs and Weir, 2008). An additional major problem with frequentist tests is how to decide upon a threshold for significance, in particular as a function of the sample size. When the exact test is used, computation is an issue when the number of alleles at the locus is not small (Guo and Thompson, 1992; Huber et al., 2006). Recently, there has been great interest in testing for HWE in genome-wide association studies (GWAS) in which departure from HWE may indicate problems with quality control for the SNP in question (Wigginton, Cutler, and Abecasis, 2005). We describe Bayesian approaches to examination of HWE based on Bayes factors for testing, and scrutiny of posterior distributions for interpretation. The discreteness of the sample space causes no complications for the Bayesian approach because all inference is conditional on the configuration of observed counts so there is no need to consider hypothetical data realizations. The structure of this article is as follows. In Section 2, we state the Hardy–Weinberg law, and describe frequentist approaches to its testing. Section 3 describes the Bayesian approach to testing and estimation based on conjugate analysis and Monte Carlo methods, and Section 4 applies the approaches to a number of previously considered datasets. We $ C
2009, The International Biometric Society
provide a discussion in Section 5, while an appendix contains mathematical details. 2. Background 2.1 Diallelic Markers We first consider a diallelic marker with alleles A 1 and A 2 and population frequencies of p 1 and 1 − p 1 . For genotypes A 1 A 1 , A 1 A 2 , A 2 A 2 the population frequencies are denoted p 11 , p 12 , p 22 . Let n 11 , n 12 , n 22 denote the observed genotype frequencies which, under independent sampling, follow the multinomial distribution: Pr(n | p) =
n! pn 11 pn 12 pn 22 , n11 !n12 !n22 ! 11 12 22
(1)
where n = (n11 , n12 , n22 ), p = (p11 , p12 , p22 ), and n = !k n . In a large random-mating population, in the abi , j =1≥i i j sence of migration, mutation, natural selection, and assortative mating, HWE corresponds to the frequencies of A 1 homozygotes, heterozygotes, and A 2 homozygotes being p21 , 2p 1 (1 − p 1 ), and (1 − p 1 )2 . Hence the HWE model and the saturated model have one and two parameters, respectively. There are various ways in which the saturated model space can be parameterized (Weir, 1996). We will consider the fixation index parameter (also called the inbreeding coefficient), f, whose use gives p11 = p21 + p1 (1 − p1 )f,
p22 = (1 − p1 )2 + p1 (1 − p1 )f,
p12 = 2p1 (1 − p1 )(1 − f ),
so that f = 0 recovers the HWE model. Examining point and interval estimates for f yields insight into departures from HWE: positive values are manifested in an excess of
1
Biometrics
2
homozygotes (and may indicate inbreeding) while negative values correspond to an excess of heterozygotes. Defining −p min , 1), and so p min = min(p 1 , 1 − p 1 ), the range of f is ( 1−p min depends on the allele frequencies, which complicates inference. In a GWAS, f > 0 may indicate population stratification, while f < 0 may occur if there are regions of low-copy repeats, leading to an increase in the number of apparent heterozygotes (Wigginton et al., 2005). 2.2 Multiallelic Markers The generalization to k alleles, A 1 , . . . , Ak , is relatively straightforward. In an obvious notation let pij be the frequency of genotype Ai Aj , and nij be the observed count, i, j = 1 , . . . , k, j ≥ i. The likelihood is again multinomial: n!
Pr(n | p) =
k "
ni j !
k "
n
(2)
pi ji j ,
i , j =1, j ≥i
i , j =1, j ≥i
where n = (n11 , n12 , . . . , nk k ), and p = (p11 , p12 , . . . , pk k ) are !k k(k + 1)/2-dimensional vectors and n = i , j =1, j ≥i ni j . Under HWE pii = p2i , i = 1 , . . . , k, and pij = 2pi pj , i, j = 1 , . . . , k, j ≥! i. We can parameterize the saturated model as pi i = p2i + pi j %=i pj fi j , pi j = 2pi pj (1 − fi j ) so that we have introduced a set of fixation indices fij (Weir, 1996; Ayres and Balding, 1998); fij = 0 for all i %=j recovers the HWE model. Again we may examine estimates of fij to discover the reasons for departure from HWE; a positive/negative fij indicates a deficiency/excess of heterozygotes of type Ai Aj . A disadvantage of this model is that the fixation indices are on awkward ranges: 1 − 2p i1p j ≤ fi j ≤ 1 (so that the lower bound can extend below −1, which is not true for the model with a single f ), which can produce difficulties for inference. An interesting submodel corresponds to fij = f , and is known as the inbreeding model because all pairs of allele frequencies are assumed to be equally perturbed. Under this −p min ≤ model: pii = p2i + pi (1 − pi )f , pij = 2pi pj (1 − f ), and 1−p min f ≤ 1, where p min is the minimum of the allele frequencies. Under HWE the multinomial likelihood (2) takes the form Pr(n | p) =
2
!k
i =1, j > i
" k
nij
k n! "
ni j !
i =1
2n i i +
pi
!
j>i
nij
.
(3)
i , j =1, j ≥i
2.3 Frequentist Approaches Frequentist asymptotic χ2 and exact tests provide the most common approaches to the testing of HWE (Weir, 1996). The exact test is recommended (Balding, 2006) because it does not depend on large sample sizes, and the χ2 test can have inaccurate type I errors as documented by Wigginton et al. (2005). We concentrate on the exact test. For two alleles, one proceeds by considering the distribution of the counts conditional on the observed numbers of A 1 alleles, n 1 = 2n 11 + n 12 , to give, under the null Pr(n12 | n1 ) =
n! [(n1 − n12 )/2]!n12 ![(n − n1 − n12 )/2]! 2n 12 n1 !(n − n1 )! . × (2n)!
The null of HWE is rejected if the observed data fall into the tails of this distribution, with the tail defined by the specified significance level. In the multiallelic case the enumeration of the counts in the tails may be computationally expensive and a number of Monte Carlo algorithms have been proposed (Guo and Thompson, 1992; Huber et al., 2006). In general the distribution of the p-value under the null is not uniform due to the discreteness of n 12 and so enumeration of all possible tables consistent with n 1 is advised to obtain the empirical p-value distribution (Rohlfs and Weir, 2008). Maximum likelihood estimates (MLEs) of the allele frequencies and parameters of interest are readily available from the multinomial likelihood, though inference requires asymptotic arguments, and the awkward constraints on the inbreeding coefficient/fixation indices make the construction of intervals that obey the constraints difficult. 3. Bayesian Approaches Bayesian approaches have been described by a number of authors. Altham (1971) showed the close link between the exact test and a posterior tail area under a Dirichlet prior, while Pereira and Rogatko (1984) considered the two allele case with estimation and testing via Bayes factors being carried out with Dirichlet priors. Lindley (1988) also considered this case and parameterized in terms of α = 12 log 4pp112p 22 and 12
β = 12 log pp 11 . HWE corresponds to 4p 11 p 22 = p212 , or equiva22 p1 , where p 1 is the frelently α = 0. When α = 0, β = log 1−p 1 quency of allele A 1 . An advantage of this parameterization is that α and β are defined over the whole real line, which simplifies inference. A disadvantage is the lack of interpretability of the parameters, which makes prior specification difficult. Shoemaker, Painter, and Weir (1998) considered estimation for the two allele case and placed prior distributions on either the allele frequencies or on the disequilibrium parameter D = p 11 − p21 , which (as with f ) is subject to awkward constraints; these authors used numerical integration to obtain the posterior distribution. Ayres and Balding (1998) considered estimation for the fixation indices model, with inference carried out using Markov chain Monte Carlo (MCMC). Montoya-Delgado et al. (2001) use the Bayes factor as a test statistic. Consonni, Gutierrez-Pena, and Veronese (2008) discuss various methods for choosing “compatible” priors for nested models, with particular reference to the HWE model. 3.1 Bayes Factors The Bayesian approach to hypothesis testing requires consideration of the Bayes factor (Kass and Raftery, 1995), which is the probability of the data under the null divided by the probability of the data under the alternative. In the HWE context the Bayes factor (BF) is given by
BF =
Pr(n | H0 ) = # # Pr(n | H1 )
#
Pr(n | θ)π(θ) dθ
, (4)
Pr(n | θ, λ)π(θ, λ) dθ dλ
where θ represent a vector of parameters under the null and λ an additional set of parameters under the alternative hypothesis, with prior distribution π(θ) under the null and joint prior π(θ, λ) under the alternative. A conjugate choice for the parameters under both the null and saturated hypotheses is the Dirichlet distribution. In the k allele case, for the
Bayesian Methods for Examining Hardy–Weinberg Equilibrium saturated model, let Dir(v) with v = (v11 , v12 , . . . , vk k ) denote the Dirichlet distribution with parameters v and density: Γ
$
k %
&
vi j
i , j =1, j ≥i
π(p) =
k "
Γ(vi j )
k "
v
pi ji j
−1
,
i , j =1, j ≥i
p(n | H0 ) =
where pij > 0 and p = 1. Combining this prior on i , j =1, j ≥i i j genotype frequencies with the multinomial likelihood gives the Dirichlet posterior Dir(v + n), in an obvious notation. The conjugate prior under the null, Dir(w) with w = (w1 , . . . wk ) follows in an analogous fashion (and is a prior on allele frequencies) to give the posterior ! Dir(w + m), where m = (m1 , . . . , mk ) and mi = 2ni i + j > i ni j . In the diallelic case the conjugate priors Dir(w 1 , w 2 ) and Dir(v 11 , v 12 , v 22 ) under the null and alternative lead to the Bayes factor: BF =
!k
i , j =1, j > i
k "
nij
k "
Γ
i =1 $
ni j !
×
!k
wi + 2ni i +
%
ni j
j>i
k %
2ni i +
i =1
ni j !
i , j =1, j ≥i
"
Γ(wi )
i =1
$
w+
"n!
p(n | H1 ) =
Γ
Γ(w) k "
i , j =1, j ≥i
×
4p1 4(1 − p1 )
0 < p1 ≤ 0.5
(8)
0.5 < p1 < 1.
n!2n 12 +2 [IBe(0.5, 2n11 + n12 + 2, n12 + 2n22 + 1) n11 !n12 !n22 ! + Be(2n11 + n12 + 1, n12 + 2n22 + 2) − IBe(0.5, 2n11 + n12 + 1, n12 + 2n22 + 2)],
(x
where Be(a, b) = Γ(a)Γ(b)/Γ(a + b) and IBe(x, a, b) = 0 z a −1 (1 − z)b −1 dz is the incomplete beta function (which is straightforward to calculate). Under the Dir(1,1,1) prior the probability that the inbreeding coefficient f is greater than 0
2n 12 Γ(w)Γ(2n11 + n12 + w1 )Γ(v11 )Γ(v12 )Γ(v22 )Γ(n12 + 2n22 + w2 )Γ(n + v) , Γ(w1 )Γ(w2 )Γ(2n + w)Γ(v)Γ(n11 + v11 )Γ(n12 + v12 )Γ(n22 + v22 )
where w = w 1 + w 2 and v = v 11 + v 12 + v 22 (Consonni et al., 2008). For k alleles and under conjugate priors the normalizing constants for the HWE and saturated models are available in closed form and are given by: p(n | H0 ) = n!2
'
For these priors the Bayes factor is again available in easily computable form with the denominator as in the conjugate case, i.e., equation (7) with k = 2 and v = (1, 1, 1), and
i , j =1, j ≥i
!k
π0 (p1 ) =
3
k % % i =1 j > i
&
ni j
&,
"Γ(v)
Γ(vi j )
i , j =1, j ≥i
Γ(vi j + ni j )
i , j =1, j ≥i
Γ(v + n)
!k
,
is 0.67, showing that the implications of innocuous looking priors should be carefully examined. Often we will wish to specify nonconjugate priors, for increased flexibility. For example, in the inbreeding single f model, prior information may exist on the coefficient f for −p min . We require a which, recall, f min ≤ f ≤ 1, where fmin = 1−p min joint prior for p, f and we assume π(p, f ) = π(p) × π(f | p), min with an N (µ λ , σ 2λ ) prior for λ = log( f −f ), which gives 1−f πf (f | p) =
(6)
(7)
where w = i =1 wi and v = i , j =1, j ≥i vi j . The ratio of equation (6) to equation (7) gives the Bayes’ factor, of which (2) is the special case when k = 2. With nested models, as in the HWE context, an appealing specification is one under which π(θ | H0 ) = π(θ | H1 ), so that when comparing the data under the null and alternative models we are examining whether the addition of the extra set of parameters that define the alternative leads to a better explanation of the data. This relationship does not hold under conjugate specifications for the null and alternative, but does hold for the following specification for k = 2. Under the alternative suppose we assume π 1 (p 11 , p 12 , p 22 ) is Dir(1,1,1). To obtain a consistent prior under the null we reparameterize from (p 11 , p 12 , 1 − p 11 − p 12 ) to (p 1 , p 12 , 1 − p 1 − p 12 /2) and then integrate over p 12 to give:
(5)
)
2πσλ2
×
*−1/ 2
+
1 exp − 2 2σλ
'
log
,
f − fmin 1−f
-
− µλ
1 − fmin , (f − fmin )(1 − f )
.2 / (9)
as a prior for f, where the final term corresponds to the Jacobian | dλ/df | (see Appendix). For prior specification we choose two probabilities, along with their corresponding quantiles, for f, and then solve for µ λ , σ λ . Much data are available on the possible sizes of f. For example, Table 7.3 of CavalliSforza and Bodmer (1971) gives estimates of f for a range of human populations. It is possible that f < 0, for example, due to avoidance of mating relatives, and through selection for heterozygozity. For the single f model, and with the prior p = (p1 , . . . , pk ) ∼ Dir(w) under the null, we may use importance sampling to evaluate the denominator of the Bayes factor (4). To obtain an efficient proposal we parameterize in terms of the set (θ, λ), where θ = (θ1 , . . . , θk −1 ) with θ i = log(pi /pk ), i = 1 , . . . , k − 1. Under this parameterization the restrictions on p and the awkward constraints on f | p are automatically satisfied, and (θ, λ) are defined on Rk , which is desirable for finding an efficient importance sampling proposal. Under the alternative we have p ∼ Dir(w) multiplied by equation (9) and so require p(n | H1 ) =
#
p(n | p, f )πp (p)πf | p (f | p) dp df
= Eπ p π f | p [p(n | p, λ)]
(10)
Biometrics
4
=
#
Dempster, 1987; Guo and Thompson, 1992). The data are given by
p(n | θ, λ)πp (s(θ))πf | p (t(θ, λ) | p) | J | gθ , λ (θ, λ)
(A1 A1 , A2 A1 , A2 A2 , A3 A1 , A3 A2 , A3 A3 , A4 A1 , A4 A2 ,
× gθ , λ (θ, λ) dθ dλ
= Eg θ , λ
0
1
p(n | θ, λ)πp (h(θ))|J |πλ (λ | p) , gθ , λ (θ, λ)
(11)
where p = s(θ) and f = t(θ, λ) are the reverse transformations and J is the Jacobian for the transformation from (p, f ) → (θ, λ). Details are contained in the Appendix. For small numbers of alleles, we sample directly from the prior as in (10), which is a computationally simple approach (because the estimator is simply the likelihood averaged with respect to the prior). This strategy is computationally expensive if either the number of alleles or the sample size is large, however, because the likelihood will be relatively peaked and so the majority of the points will provide essentially zero contribution. As an alternative we may take g(·, ·) in equation (11) as a k-dimensional normal distribution. We run an MCMC sampler (coded in the WinBUGS software, Spiegelhalter, Thomas, and Best, 1998) and take the posterior mean vector and the posterior variance–covariance matrix of (θ, λ) as the moments of g(·, ·). Once the Bayes factor is evaluated a decision theory approach to testing requires the specification of the prior odds (PO) on H 0 , PO = π 0 /(1 − π 0 ), where π 0 = Pr(H 0 ), and the ratio of costs of type II to type I errors, R = CII /CI . The decision theory solution is to accept H 1 if BF × PO < R. In contrast, frequentist hypothesis testing must specify the significance threshold α. The choice of PO and R is not straightforward, but at least it is clear what is being specified rather than having the implicit choices in a p-value threshold (Wakefield, 2009). To inform the choices, one may carry out simulations to examine the type I and type II errors associated with particular values of PO and R. If only the ranking of discrepancies from HWE is required (for example in a GWAS in which HWE is examined in controls for a large number of SNPs) then if PO and R are constant across SNPs the ranking can be based on the Bayes factors alone, and there is no need to specify PO and R. 3.2 Estimation Exploitation of conjugate prior distributions allows closed form inference for allele frequencies under HWE, and under the saturated alternative model for the genotype frequencies, but such closed form inference is not available for the fixation indices. However, it is straightforward to obtain samples for these indices, by simple transformation of the samples for p. Specifically, if p(s ) , s = 1 , . . . , S represent samples from the posterior for the collection of geno(s ) (s ) (s ) (s ) type frequencies, pij , then f i j = 1 − pi j /2pi pj with (s )
(s )
!k
(s )
(s )
(s )
!k
(s )
= 2pi i + i , j =1, i %=j pi j , pj = 2pj j + i , j =1, i %=j pj i . For the single f model we cannot exploit conjugacy but may use a rejection algorithm with sampling from the prior if the number of alleles is small, with MCMC being used otherwise. pi
4. Examples 4.1 Four Group Data We first analyze the four class genotype data that have been previously analyzed by a number of authors (Louis and
A4 A3 , A4 A4 ) = (0, 3, 1, 5, 18, 1, 3, 7, 5, 2). The exact p-value for these data is 0.01744, which under conventional levels would be deemed as showing mild evidence of departure from HWE. These data are described in Thomson et al. (1986) and concern the antigen class of 45 French type 1 diabetes patients, with the classes being DR1, DR3, DR4, and Y, a fourth class corresponding to all other antigens. In our notation these classes correspond to (A 1 , A 2 , A 3 , A 4 ). The interest here is in the mode of inheritance of type 1 diabetes, with a hypothesized recessive model being equivalent to the HWE model (Thomson, 1983). The translation into the HWE framework is as follows. Assume a hypothetical twolocus model with k = 4 alleles at one (antigen) locus along with a second disease locus. Under a recessive model of inheritance we require two disease alleles, D, and among cases we may consider the probabilities of obtaining the different antigen combinations under the recessive model: Pr(Ai D/Aj D | Disease) =
Pr(Disease | Ai D/Aj D)Pr(Ai D/Aj D) , Pr(Disease)
where Ai D/Aj D are the possible genotypes of diseased individuals, for i, j = 1 , . . . , k. Thomson (1983) parameterized the model in terms of ki = Pr (Ai | D), and let f 2 be the probability of disease given two copies of the disease allele, and pD the frequency of the disease allele. Under the recessive model two disease alleles are required and so Pr(Disease) =
%
i , j, i%=j
= f2 p2D
Pr(Disease | Ai D/Aj D)Pr(Ai D/Aj D)
+
k % i =1
ki2 +
k %
ki kj
i , j =1, i %=j
/
= f2 p2D ,
where the summations within the square brackets equal 1 because we have added over the set of conditional allele probabilities. Hence Pr(Ai D/Aj D | Disease) =
'
ki2
i=j
2ki kj
i %= j
,
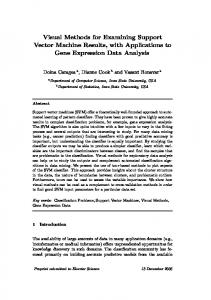
which is equivalent to HWE. Deviations from this model suggest that the recessive model does not hold. In particular we may interpret, for example, negative f 34 as an excess of A 3 A 4 genotypes among diseased individuals. The single f model is more difficult to interpret in this context but corresponds to a general excess (negative f ) or deficit (positive f ) of heterozygotes. For these data we fit the HWE (recessive) model, along with the single f and saturated models. For the HWE and saturated models we assume conjugate Dirichlet priors with all parameters set to 1. This prior is flat over the simplex of probabilities, but is far from uninformative on each of the fixation indices. Figure 1a gives the marginal prior density for a generic fixation index; the prior probability that this fixation index is greater than 0 is 0.64. For the single f model
Bayesian Methods for Examining Hardy–Weinberg Equilibrium
to the prior, see Figure 1a. We see that the fixation index associated with the A 1 A 4 combination is furthest from zero and negative, and most responsible for the negative estimate of f in the single inbreeding coefficient model. The heterogeneity of the fixation indices explains why the data are slightly more consistent with the saturated model than the single f model. It is interesting to observe that the A 1 A 4 combination was not noteworthy in these data using the method implemented in Thomson et al. (1986). However, they comment that in the German population that they also examined (and in a Caucasian population investigated in Winnearls et al., 1984) there was an excess of A 1 A 4 individuals, which is consistent with the posterior interval observed in Figure 3.
(b)
0.0
0.0
0.1
0.2
0.4
Density
0.4 0.3 0.2
Density
0.5
0.6
0.6
0.7
0.8
(a)
1 Fixation index k=4
5
1 Fixation index k=9
Figure 1. Prior distribution for a generic fixation index with (a) k = 4 alleles, (b) k = 9 alleles, given a Dirichlet prior with parameters 1, on the 10 (k = 4) and 45 (k = 9) allele frequencies. we assume the transformed normal prior model described in Section 3.1, and fix prior probabilities Pr(f < 0) = 0.5 and Pr(f < 0.26) = 0.95 to give µ λ = −2.95, σ λ = 1.07. The normalizing constants for the recessive and saturated models are given by equations (6) and (7) and are 1.39 × 10⁻¹¹ and 1.88 × 10⁻¹⁰ , respectively, to give a Bayes factor of 0.074. Hence the data are 14 times more likely under the saturated model. The probability of the data under the single f model is 1.36 × 10⁻¹⁰ so that the data are 10 times more likely under this model when compared to the recessive (HWE) model, but slightly less likely than under the saturated model. The normalizing constant under the single f model was evaluated using importance sampling Monte Carlo, with sampling from both the prior, and from a four-dimensional normal (as described in Section 3.1), both being computationally feasible for these data. Figure 2 gives prior (top row) and posterior (bottom row) distributions from the single f model. We provide the prior/posterior for f and the single allele frequency p 1 (for illustration). Under the single f model Pr(f < 0 | n) = 0.994. The MLE is indicated as the cross on the scatterplot in panel (f). The MLE f2 for the single f model lies on the lower boundary of its range, which led to instability in attempting to derive a standard error. Figure 2f illustrates this problem with the posterior density concentrated near the boundary. When a parameter lies close to its boundary, it is often indicative of model inadequacy and here we interpret f close to its boundary as reflecting an inadequacy of the single f model. Examination of posterior interval estimates under the general fixation model is revealing in this respect. In Figure 3, we give posterior intervals along with posterior medians and MLEs for each of the fixation indices. The posterior medians are all pulled toward 1, relative to the MLEs, due
4.2 Nine Group Data Our second example was also analyzed by Guo and Thompson (1992) and consists of rhesus data on 8297 individuals with nine groups. The (exact) p-value for these data is 0.71. Under the HWE null we assume the Dirichlet prior with w = (1, 1, 1, 1, 1, 1, 1, 1, 1) so that this prior is uniform on the simplex of allele frequencies. Under the single f alternative we use the information in Table 7.3 of Cavalli-Sforza and Bodmer (1971), which contains estimates of f that are predominantly less than 0.03. Consequently, under the single f model we assume a prior on f that has 50% and 95% points of 0 and 0.03. We obtain normalizing constants for the HWE and the single f model 1.3 × 10−53 and 5.1 × 10−54 so that the data are 2.5 times more likely under the HWE model, as compared to the single f model. For these data, sampling from the prior was not feasible, so instead importance sampling Monte Carlo was implemented using a nine-dimensional normal distributed with moments estimated from an MCMC run. For illustration, the probability of the data under the saturated model with conjugate Dirichlet prior with a vector of 45 1’s is 8.7 × 10−119 , emphatically ruling out this model. The “model” being summarized by the normalizing constant consists of the likelihood and the prior, and the conjugate prior assumed here is very unappealing for these data because it gives priors on the fixation indices that are not realistic. Figure 1b gives the induced marginal prior on a generic fixation index and shows that the distribution is not concentrated close to zero as is reasonable in this context. Under the single f model the (2.5%, 50%, 97.5%) posterior quantiles are (−0.0001, 0.0002, 0.0106) so that the 95% credible interval contains zero (the MLE is 0.01). For these data we would conclude that there is not a genetically significant departure from HWE. 4.3 Genome-Wide Data We illustrate the use of Bayes factors for examination of HWE in GWAS. In this context, testing for HWE is used as a method for carrying out quality control, and in particular to detect SNP specific genotyping errors. Fisher’s exact test is the recommended frequentist procedure (Wigginton et al., 2005; Balding, 2006), but there are a number of difficulties in implementation. In a multiple testing situation one must select a criterion to control in order to specify a significance threshold, and by far the most common approach is a Bonferroni correction. However, the rationale for control of the family-wise error rate (FWER) is not obvious in a genomewide quality context when one would not expect all nulls to
6
Biometrics
Figure 2. Prior (top row) and posterior (bottom row) distributions based on 5000 samples, for the four group data and the single inbreeding coefficient f model. The MLE is indicated as the cross in (f). We examine p 1 for illustration, and could just as easily have picked p 2 , p 3 , or p 4 . be true. Even if one accepts that this is the correct quantity to control, the choice of a specific threshold is difficult. There is no agreed threshold in the literature, as Wittke-Thompson, Pluzhnikov, and Cox (2005, p. 967) state, “ . . . there is little consensus on the correct thresholds for identifying DHW (departure from HWE) in the context of large-scale studies” (I have added the expression in italics). In practice a range of thresholds have been used: Easton et al. (2007) use a threshold of 10−5 for breast cancer (227,876 SNPs, with 400 controls); Libioulle et al. (2007) use 10−3 for Crohn’s disease (317,5497 SNPs, with 928 controls); Zeggini et al. (2007) use 10−4 for type 2 diabetes (459,448 SNPs, with 2938 controls); Stacey et al. (2007) use 10−10 (317,503 SNPs, with 11,563 controls). It would seem desirable to have a pvalue threshold that decreases with increasing sample size (because in the limit we would not want to make any type I errors), but this does not seem to be exercised in practice, because power is not considered when a threshold is determined. Extending this idea suggests that the threshold should be minor allele frequency (MAF) specific also, as power is a function of the MAF. The Bayes factor approach explicitly considers power (i.e., sample size and MAF) in its calculation because the denominator is the probability of the data under the alternative. The threshold is a function of the prior odds and the costs of the two types of error. Using
the Bayes factor as a test statistic gives a procedure by which the type I and type II errors decrease to zero with increasing sample size (Wakefield, 2009). A common practice in GWAS is to plot the observed −log 10 p-value versus that expected under the null, where the latter are derived assuming uniformity of the p-value. Due to the discreteness of the test statistic p-values derived from an exact test are not uniform under the null, however. The correct MAF-specific distribution can be derived by enumerating all counts under the null for that MAF in the sample. In this context it is also difficult to use the q-value methodology (Storey, 2003) due to the nonuniformity of the null distribution. We examine data from Klein et al. (2005), who reported a GWAS for age-related macular degeneration; being one of the first GWAS there were just 96 cases and 50 controls. We examine HWE for 116,212 SNPs in controls. We first carried out a number of quality control measures, and for comparison purposes use the same criteria as Klein et al. (2005). Specifically, SNPs were removed if they were called in less than 85% of individuals or if the MAF was less than 1%; this left 102,640 SNPs. In Klein et al. (2005), a Bonferroni correction was applied to control the FWER at 5%, to give a p-value threshold of 4.9 × 10⁻⁷ . Figure 4 displays various summaries for these data. In panel (a) we plot −log 10 p-values from the χ2 test versus their exact test counterparts and we see a large degree
34
Bayesian Methods for Examining Hardy–Weinberg Equilibrium
●
23
●
14
●
●
13
Fixation Coefficients
24
●
MLEs Post Medians
12
●
●
–1.0
–0.5
0.0
0.5
95% Credible Interval
Figure 3. Posterior summaries and MLEs for the fixation coefficients, in the four group example.
7
of dissimilarity, which is not surprising given the small sample sizes here. The discreteness of the p-values from the exact test is apparent also, and the distribution away from zero (which corresponds principally to null SNPs) is far from uniform. To reinforce this point we plot the histogram of exact p-values in panel (b), the most probable configuration of genotypes has probability 1 and for these data more than a third (consisting of 37,253 SNPs) have a p-value of 1. This plot shows a great similarity to Figure 2 of Rohlfs and Weir (2008) (except that we have truncated the vertical axis so that more detail in the bulk of the distribution can be revealed). In panel (c), we plot the observed −log 10 p-values versus those expected under a uniform null. A plot containing this information is almost universally presented in GWAS, but it is not strictly valid because it assumes uniformity under the null. The Bonferroni threshold is indicated on this plot and leads to HWE being rejected for 191 SNPs. Turning now to a Bayesian approach we assume Dir(1,1,1) priors under the alternative and compare results based on two priors under the null, namely Dir(1,1) and the triangular distribution, equation (8). In terms of computation time, the Bayes factor calculations tookapproximately half the time of the exact p-values (which were calculated using the hwexact function in R). In Figure 4d, we plot −log 10 Bayes factors
Figure 4. Bayes factor and p-value summaries for the GWAS for age-related macular degeneration data: (a) −log 10 p-values from a χ2 test versus those from the exact test; (b) histogram of exact p-values (vertical axis truncated, the count at a p-value of 1 is indicated); (c) QQ-plot of observed versus expected −log 10 p-values, assuming uniformity of p-values under the null; and (d) −log 10 p-values against −log 10 Bayes factors. The dashed lines corresponds to the Bonferroni threshold (p-value axes) and Bayes factor thresholds (Bayes factor axes).
Biometrics
8
(under the conjugate prior) versus −log 10 p-values (from the exact test), and we see a very close correspondence, particularly for the SNPs that deviate from HWE. To pick a threshold for rejection of HWE using Bayes factors we need to specify the PO of H 0 , and the ratio of costs of type II to type I errors. In this context we would expect π 1 = 1 − π 0 to be very close to 0 (though not as close as the prior on a SNP being associated with disease), while we would not want to unnecessarily exclude a SNP from an association analysis, which suggests R * 1 (if in the association stage a signal is found, then clearly one would closely examine the control data from such a SNP). We choose π 0 = 0.999 and R = 1/1000, which leads to a Bayes factor threshold of 10−7 , so that the data have to be 107 times more likely under the alternative than under the null before HWE is rejected. This leads to 112 rejections under the conjugate prior Bayes factor and 100 under the triangular prior Bayes factor (we do not plot the latter as they are in close agreement with those under the conjugate prior). In a GWAS context, another approach to prior specification is to recognize that under the alternative there may be an excess of heterozygotes, which could be reflected in the Dir(v 11 , v 12 , v 22 ) prior under the alternative by taking v 11 = v 22 < v 12 . 5. Discussion In this article, we have described a Bayesian approach to examination of HWE, using a variety of approaches to implementation. Depending on one’s perspective the Bayesian need for prior specification may be judged a blessing or a curse. Certainly, great care is required in the specification of a prior distribution, as illustrated in the nine-allele example in which the “uniform over the simplex” prior under the saturated alternative was seen to be grossly inappropriate. However, under a particular prior, Bayes factors may be produced with the same ordering as asymptotic p-values, as we now briefly discuss. For illustration, consider the two allele case and suppose we have a p-value based on the Wald statistic for f with MLE f2 =
4n11 n22 − n212 (2n11 + n12 )(2n22 + n12 )
and asymptotic variance V (f ) = var(f2) 1 (1 − f )[2p1 p2 (1 − f )(1 − 2f ) + f (2 − f )]. (12) = 2np1 p2 The χ2 statistic is given by f22 /V (0) = nf22 . As shown elsewhere (Wakefield, 2007, 2009) an asymptotic Bayes factor (ABF) may be obtained by combining the “likelihood” f2| f ∼ N {f, V (0)} with prior f ∼ N (0, W ) to give ABF =
4
3
,
V (0) + W W z2 exp − V (0) 2 V (0) + W
-
,
(13)
where z = f2/ V (0) and W is the prior variance for f. If we take W independent of n then ABF tends to ∞ and 0 under the null and alternative respectively, as n → ∞, as desired. The ABF (13) is dependent on z only, and hence the Wald
p-value (or equivalently the χ2 statistic), when we take the prior variance W = K × V (0) = K/n, where K is a constant that does not depend on the data. This p-value prior gives ABFp = (1 + K)1/ 2 exp
,
−
nf22 K 2 1+K
-
and under this prior identical rankings of significance will be achieved between ABF p and the χ2 statistic. The dependence of the prior on n is troubling and leads to the p-value Bayes factor being inconsistent under the null because ABF p tends to (1 + K)1/ 2 as n → ∞, and not ∞ as required. This indicates why p-value thresholds should decrease with increasing sample size, see Wakefield (2009) for further discussion. R and WinBUGS codes to implement the methods presented here are available from http://faculty.washington.edu/ jonno/cv.html. The supplementary material contains the WinBUGS code for the single f model.
Acknowledgements This work was partially supported by grant 1 U01-HG00444601 from the National Institutes of Health. The author thanks Bruce Weir for numerous informative discussions, Josephine Hoh for allowing the use of the AMD genome-wide data, and the editor, associate editor, and referee for comments that greatly helped clarify the scope of the article.
References Altham, P. (1971). Exact Bayesian analysis of an intraclass 2 × 2 table. Biometrika 58, 679–680. Ayres, K. and Balding, D. (1998). Measuring departures from HardyWeinberg: A Markov chain Monte Carlo method for estimating the inbreeding coefficient. Heredity 80, 769–777. Balding, D. (2006). A tutorial on statistical methods for population association studies. Nature Reviews Genetics 7, 781–791. Cavalli-Sforza, L. and Bodmer, W. (1971). The Genetics of Human Populations. San Francisco: W.H. Freeman and Company. Consonni, G., Gutierrez-Pena, E., and Veronese, P. (2008). Compatible priors for Bayesian model comparison with an application to the Hardy-Weinberg equilibrium model. Test 17, 585–605. Easton, D., Pooley, K., Dunning, A., Pharoah, P., Thompson, D., Ballinger, D., Struewing, J., Morrison, J., Field, H., and Luben, R. (2007). Genome-wide association study identifies novel breast cancer susceptibility loci. Nature 447, 1–9. Guo, S. and Thompson, E. (1992). Performing the exact test of HardyWeinberg proportion for multiple alleles. Biometrics 48, 361– 372. Huber, M., Chen, Y., Dinwoodie, I., Dobra, A., and Nicholas, M. (2006). Monte Carlo algorithms for Hardy-Weinberg proportions. Biometrics 62, 49–53. Kass, R. and Raftery, A. (1995). Bayes factors. Journal of the American Statistical Association 90, 773–795. Klein, R., Zeiss, C., Chew, E., Tsai, J.-Y., Sackler, R., Haynes, C., Henning, A., SanGiovanni, J., Mane, S., Mayne, S., Bracken, M., Ferris, F., Ott, J., Barnstable, C., and Hoh, J. (2005). Complement factor H polymorphism in age-related macular degeneration. Science 308, 385–389. Libioulle, C., Louis, E., Hansoul, S., Sandor, C., Farnir, F., Franchimont, D., Vermeire, S., Dewit, O., de Vos, M., Dixon, A., Demarche, B., Gut, I., Heath, S., Foglio, M., Liang, L., Laukens, D., Mni, M., Zelenika, D., Gossum, A. V., Rutgeerts, P., Belaiche, J., Lathrop, M., and Georges, M. (2007). Novel Crohn disease locus identified by genome-wide association maps to a gene desert
Bayesian Methods for Examining Hardy–Weinberg Equilibrium on 5p13.1 and modulates expression of PTGER4. PLoS Genetics 3, e58. Lindley, D. (1988). Statistical inference concerning Hardy-Weinberg equilibrium. In J. Bernardo, M. DeGroot, D. Lindley, and A. Smith (eds), Bayesian Statistics 3, 307–326. Oxford, U.K: Oxford University Press. Louis, E. and Dempster, E. (1987). An exact test for Hardy-Weinberg and multiple alleles. Biometrics 43, 805–811. Montoya-Delgado, L., Irony, T., de B. Pereira, C., and Whittle, M. (2001). An unconditional exact test for the Hardy-Weinberg equilibrium law: Sample-space ordering using the Bayes factor. Genetics 158, 875–883. Pereira, C. and Rogatko, A. (1984). The Hardy-Weinberg equilibrium under a Bayesian perspective. Revista Brasieira de Genetica 4, 689–707. Rohlfs, R. and Weir, B. (2008). Distributions of Hardy-Weinberg equilibrium test statistics. Genetics 180, 1609–1616. Shoemaker, J., Painter, I., and Weir, B. (1998). A Bayesian characterization of Hardy-Weinberg disequilibrium. Genetics 149, 2079– 2088. Spiegelhalter, D., Thomas, A., and Best, N. (1998). WinBUGS User Manual, Version 1.1.1. Cambridge, U.K: MRC Biostatistics Unit. Stacey, S., Manolescu, A., Sulem, P., Rafnar, T., Gudmundsson, J., Gudjonsson, S., Masson, G., Jakobsdottir, M., Thorlacius, S., Helgason, A., Aben, K., Strobbe, L., Albers-Akkers, M., Swinkels, D. W., Henderson, B.E., Kolonel, L.N., Le Marchand, L., Millastre, E., Andres, R., Godino, J., Garcia-Prats, M.D., Polo, E., Tres, A., Mouy, M., Saemundsdottir, J., Backman, V.M., Gudmundsson, L., Kristjansson, K., Bergthorsson, J.T., Kostic, J., Frigge. M.L., Geller F, Gudbjartsson, D., Sigurdsson, H., Jonsdottir, T., Hrafnkelsson, J., Johannsson, J., Sveinsson, T., Myrdal, G., Grimsson, H.N., Jonsson, T., von Holst, S., Werelius, B., Margolin, S., Lindblom, A., Mayordomo, J.I., Haiman, C.A., Kiemeney, L.A., Johannsson OT, Gulcher, J.R., Thorsteinsdottir, U., Kong, A., and Stefansson K. (2007). Common variants on chromosomes 2q35 and 16q12 confer susceptibility to estrogen receptor-positive breast cancer. Nature Genetics 39, 865–869. Storey, J. (2003). The positive false discovery rate: A Bayesian interpretation and the q-value. The Annals of Statistics 31, 2013–2035. Thomson, G. (1983). Investigation of the mode of inheritance of the HLA associated diseases by the method of antigen genotype frequencies among diseased individuals. Tissue Antigens 21, 81–104. Thomson, G., Klitz, W., Louis, E., Lo, S., Bertrams, L., Baur, M., and Neugebauer, M. (1986). HLA and IDDM predisposition: New aspects. Genetic Epidemiology 1, 363–368. Wakefield, J. (2007). A Bayesian measure of the probability of false discovery in genetic epidemiology studies. American Journal of Human Genetics 81, 208–227. Wakefield, J. (2009). Bayes factors for genome-wide association studies: Comparison with p-values. Genetic Epidemiology 33, 79–86. Weir, B. (1996). Genetic Data Analysis II. Sunderland, Massachusetts: Sinauer. Wigginton, J., Cutler, D., and Abecasis, G. (2005). A note on exact tests of Hardy-Weinberg equilibrium. American Journal of Human Genetics 76, 887–893. Winnearls, B., Bodmer, J., Bodmer, W., Bottazo, G., Mann, J., Thoroughgood, M., Smith, A., Bottazzo, F., Baum, D., and McNally, T. (1984). A family study of the associations between insulin dependent diabetes mellitus, autoantibodies and the HLA system. Tissue Antigens 24, 234–246. Wittke-Thompson, J., Pluzhnikov, A., and Cox, N. (2005). Rational inferences about departures from Hardy-Weinberg equilibrium. American Journal of Human Genetics 76, 967–986.
9
Zeggini, E., Weedon, M., Lindgren, C., Frayling, T., Elliott, K., Lango, H., Timpson, N., Perry, J., Rayner, N., Freathy, R., Barrett, J., Shields, B., Morris, A., Ellard, S., Groves, C., Harries, L., Marchini, J., Owen, K., Knight, B., Cardon, L., Walker, M., Hitman, G., and Morris, A. (2007). Replication of genome-wide association signals in UK samples reveals risk loci for type 2 diabetes. Science 316, 1336–1341.
Received August 2008. Revised January 2009. Accepted February 2009.
Appendix For simplicity we consider the case of two alleles. We have πp , f (p, f ) = πp (p) × πf (f | p),
− min(p , 1−p ) where p ∼ Beta(1, 1) and 1−min(p = fmin ≤ f ≤ 1. Now , 1−p ) consider the transformation (p, f ) → (θ, λ), where θ = log{p/(1 − p)} and λ = log{(f − f min )/(1 − f )}. We wish to find the prior for θ, λ. We have p = s(θ) = eθ /(1 + eθ ) and
λ e − eθ λ
e +1 λ −θ e −e eλ + 1
f = t(λ, θ) =
if
p < 1−p
if
1 − p < p.
The prior for θ, λ is given by
where
πθ (θ) × πλ (λ | θ) = πp (s(θ)) × πf (t(λ, θ)|θ)|J |,
9 9 ∂p 9 9 ∂θ |J | = 9 9 ∂f 9
∂θ
and
9 9 ∂p 9 9 ∂θ 9 9 ∂λ 9 9 ∂p 9=9 ∂f 9 9 ∂λ 9 9 ∂λ ∂p
1 1 ∂θ = + ∂p p 1−p
∂θ 99−1 ∂f 99
9
∂λ 9 9 ∂f
(A.1)
∂θ =0 ∂f
1 (1 − p)[f (1 − p) + p]
∂λ = ∂p
1 p[f p + (1 − p)]
(A.2)
if
p < 1−p
if
1−p < p
∂λ 1 1 = + ∂f f − fmin 1−f
so that we can ignore |J | =
∂λ ∂p
(A.3)
(A.4)
. Hence
eλ (1 − fmin ) eθ × , (1 + eθ )2 (1 + eλ )2
where f min is a function of θ. This is the form that appears (in the general k allele case) in equations (10) and (11).