Apr 21, 2011 - In the Guess Dates dialog box select last in the drop down ... For this exercise, first, select Empirical under the Base frequencies menu. Second,.
Bayesian Skyline Plot Alexei J Drummond, Andrew Rambaut and Walter Xie April 21, 2011
Introduction This practical will introduce the BEAST software for Bayesian evolutionary analysis, with a focus on virus evolution. In this exercise we will investigate the population history of the the H5N1 influenza epidemic, by using the Bayesian Skyline Plot (BSP), which estimates changes in effective population size through time. The data are 21 H5N1 strain Influenza A sequences sampled between 1997 and 2005 from Southeast Asia; including viruses from birds, pigs and humans. To undertake the exercises in this practical, you will need to have access to the following software packages in a format that is compatible with your computer system (all three are available for Mac OS X, Windows and Linux/UNIX operating systems): • BEAST - this package contains the BEAST program, BEAUti, TreeAnnotator and other utility programs. At the time of writing, the current version is v1.6.1. It is available for download from http://beast.bio.ed.ac.uk/ and http://code.google.com/p/beast-mcmc/downloads/list. • Tracer - this program is used to explore the output of BEAST (and other Bayesian MCMC programs). It graphically and quantitively summarizes the distributions of continuous parameters and provides diagnostic information. At the time of writing, the current version is v1.5. It is available for download from http://beast.bio.ed.ac.uk/. • FigTree - this is an application for displaying and printing molecular phylogenies, in particular those obtained using BEAST. At the time of writing, the current version is v1.3.1. It is available for download from http://tree.bio.ed.ac.uk/.
The NEXUS alignment Open the file called Flu.nex in BEAUti. This file contains an alignment of 21 sequences from the Influenza A virus, 1698 nucleotides in length. Double click the partition data in the table to view its representing alignment. 1
Tip dates By default all the taxa are assumed to have a date of zero (i.e. the sequences are assumed to be sampled at the same time).
In this case, the Influenza sequences have been sampled at various dates going back 2
to 1997. The actual year of sampling is given in the name of each taxon and we could simply edit the value in the Date column of the table to reflect these. However we can also use the “Guess Dates” facility. In the Guess Dates dialog box select last in the drop down and click the “OK” button. The dates will appear in the appropriate column of the main window. You can then check these and edit them manually if required.
Setting the substitution model For this exercise, first, select Empirical under the Base frequencies menu. Second, select the 3 partitions: codon positions 1, 2 & 3 option so that each codon position has its own rate of evolution. Finally, we link all model parameters across codon positions by uncheck the check-boxes.
Setting the tree prior Leave clock model as default, and go to the Trees panel. Select Coalescent: Bayesian Skyline for the tree prior. We will also reduce the number of steps to 5 from the default of 10 because we only have 21 sequences and we don’t want to over-parameterize the model.
3
Setting priors Set the prior for clock rate in the Priors panel.
Setting the MCMC options For this dataset let’s initially set the chain length to 3,000,000. This will take 1030 minutes on a fast computer. Set the two sampling frequencies to 3000 and 1000 respectively.
4
Running BEAST Generate a BEAST XML named Flu.xml and run it in BEAST.
Analysing the BEAST output You can overlay the density plots of multiple logged quantities in order to compare them (it is up to the user to determine whether they are comparable on the the same axis or not). Select the relative substitution rates for all three codon positions in the table to the left (labelled CP1.mu, CP2.mu and CP3.mu). You will now see the posterior probability densities for the relative substitution rate at all three codon positions overlaid:
5
This plot clearly shows that the evolution of these sequences is dominated by purifying selection as the 3rd codon position (known as the wobble position) has a much higher rate of evolution (about 3 times faster) than either of the other codon positions.
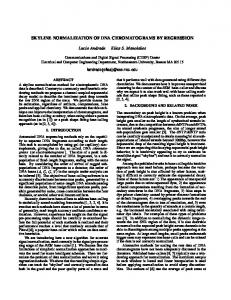
Constructing the Bayesian skyline plot To construct the BSP simply select Bayesian Skyline Reconstruction... from the Analysis menu. Select the appropriate trees log file (e.g. Flu.trees) that corresponds to the parameter log file loaded in Tracer. The remaining default values in the dialog box will be fine, so click OK. After the trees file is processed the BSP should appear in a new window:
6
By what amount did the effective population size of H5N1 Influenza grow from 1997 to 2005 according to the BSP?
What are the underlying assumptions of the BSP? Are the violated by this data set?
Summarizing the trees Summarize the trees file using TreeAnnotator:
7
And view it in FigTree:
Conclusion and Resources This practical only scratches the surface of the analyses that are possible to undertake using BEAST. It has hopefully provided a relatively gentle introduction to the funda8
mental steps that will be common to all BEAST analyses and provide a basis for more challenging investigations. BEAST is an ongoing development project with new models and techniques being added on a regular basis. The BEAST website provides details of the mailing list that is used to announce new features and to discuss the use of the package. The website also contains a list of tutorials and recipes to answer particular evolutionary questions using BEAST as well as a description of the XML input format, common questions and error messages. • The BEAST website: http://beast.bio.ed.ac.uk/ • Tutorials: http://beast.bio.ed.ac.uk/Tutorials/ • Frequently asked questions: http://beast.bio.ed.ac.uk/FAQ/
Notes This section has some extra details about aspects of some of the programs.
Guess Dates This operation attempts to guess what the dates are from information contained within the taxon names. It works by trying to find a numerical field within each name. If the taxon names contain more than one numerical field (such as the RSVA sequences in Exercise 2) then you can specify how to find the one that corresponds to the date of sampling. You can either specify the order that the date field comes (e.g., first, last or various positions in between) or specify a prefix (some characters that come immediately before the date field in each name). For the RSVA sequences you can select ‘last’ from the drop-down menu for the order or use the prefix option and specify ‘ ’ (underscore) as the prefix. In this dialog box, you can also get BEAUti to add a fixed value to each guessed date. In this case the value “1900” has been added to turn the dates from 2 digit years to 4 digit. Any dates in the taxon names given as “00” would thus become “1900”. Some of the sequences in the example file actually have dates after the year 2000 so selecting the will option would convert them correctly, adding 2000 to any date less than 09. When you press OK the dates will appear in the appropriate column of the main window. You can then check these and edit them manually as required. At the top of the window you can set the units that the dates are given in (years, months, days) and whether they are specified relative to a point in the past (as would be the case for years such as 1984) or backwards in time from the present (as in the case of radiocarbon ages).
9
Operators Each parameter in the model has one or more “operators” (these are variously called moves and proposals by other MCMC software packages such as MrBayes and LAMARC). The operators specify how the parameters change as the MCMC runs. The operators tab in BEAUti has a table that lists the parameters, their operators and the tuning settings for these operators. In the first column are the parameter names. These will be called things like kappa which means the HKY model’s kappa parameter (the transition-transversion bias). The next column has the type of operators that are acting on each parameter. For example, the scale operator scales the parameter up or down by a proportion, the random walk operator adds or subtracts an amount to the parameter and the uniform operator simply picks a new value uniformly within a range. Some parameters relate to the tree or to the divergence times of the nodes of the tree and these have special operators. The next column, labelled Tuning, gives a tuning setting to the operator. Some operators don’t have any tuning settings so have n/a under this column. The tuning parameter will determine how large a move each operator will make which will affect how often that change is accepted by the MCMC which will affect the efficency of the analysis. For most operators (like random walk and subtree slide operators) a larger tuning parameter means larger moves. However for the scale operator a tuning parameter value closer to 0.0 means bigger moves. At the top of the window is an option called Auto Optimize which, when selected, will automatically adjust the tuning setting as the MCMC runs to try to achieve maximum efficiency. At the end of the run a table of the operators, their performance and the final values of these tuning settings will be written to standard output. These can then be used to set the starting tuning settings in order to minimize the amount of time taken to reach optimum performance in subsequent runs. The next column, labelled Weight, specifies how often each operator is applied relative to the others. Some parameters tend to be sampled very efficiently - an example is the kappa parameter - these parameters can have their operators downweighted so that they are not changed as often (this may mean weighting other operators up since the weights must be integers).
Codon position models • Selecting the Partition into codon positions option assumes that the data are aligned as codons. This option will then estimate a separate rate of substitution for each codon position, or for 1+2 versus 3, depending on the setting. Estimating rates and dates from time-sample sequences a hands-on practical 3 • Selecting the Unlink substitution model across codon positions will specify that BEAST should estimate a separate transition-transversion ratio or general time reversible rate matrix for each codon position.
10
• Selecting the Unlink rate heterogeneity model across codon positions will specify that BEAST should estimate set of rate heterogeneity parameters (gamma shape parameter and/or proportion of invariant sites) for each codon position. • If there are no dates for the sequences (they are contemporaneous) then you can specify a fixed mean substitution rate obtained from another source. Setting this to 1.0 will result in the ages of the nodes of the tree being estimated in units of substitutions per site (i.e. the normal units of branch lengths in popular packages such as MrBayes).
Tracer statistics The statistics reported in Tracer for each logged quantity are: • Mean - The mean value of the samples (excluding the burn-in). • Stdev - The standard error of the mean. This takes into account the effective sample size so a small ESS will give a large standard error. • Median - The median value of the samples (excluding the burn-in). 95% HPD Lower - The lower bound of the highest posterior density (HPD) interval. The HPD is the shortest interval that contains 95% of the sampled values. • 95% HPD Upper - The upper bound of the highest posterior density (HPD) interval. • Auto-Correlation Time (ACT) - The average number of states in the MCMC chain that two samples have to be separated by for them to be uncorrelated (i.e. independent samples from the posterior). The ACT is estimated from the samples in the trace (excluding the burn-in). • Effective Sample Size (ESS) - The effective sample size (ESS) is the number of independent samples that the trace is equivalent to. This is calculated as the chain length (excluding the burn-in) divided by the ACT.
TreeAnnotator The sampled trees in BEAST are written to a separate file called the ‘trees’ file. This file is a standard NEXUS format file. As such it can easily be loaded into other software in order to examine the trees it contains. One possibility is to load the trees into a program such as PAUP* and construct a consensus tree in a similar manner to summarizing a set of bootstrap trees. In this case, the support values reported for the resolved nodes in the consensus tree will be the posterior probability of those clades. TreeAnnotator is a software program distributed with BEAST that can summarize the tree file. It takes a single ‘target’ tree and annotates it with the summarized 11
information from the entire sample of trees. The summarized information includes the average node ages (along with the HPD intervals), the posterior support and the average rate of evolution on each branch (for models where this can vary). The program calculates these values for each node or clade observed in the specified ‘target’ tree. The options in TreeAnnotator are detailed below: • Burnin - This is the number of trees in the input file that should be excluded from the summarization. This value is given as the number of trees rather than the number of steps in the MCMC chain. Thus for the example above, with a chain of 1,000,000 steps, sampling every 1000 steps, there are 1000 trees in the file. To obtain a 10% burnin, set this value to 100. • Posterior probability limit - This is the minimum posterior probability for a node in order for TreeAnnotator to store the annoted information. The default is 0.5 so only nodes with this posterior probability or greater will have information summarized (the equivalent to the nodes in a majority-rule consensus tree). Set this value to 0.0 to summarize all nodes in the target tree. • Target tree type - This has two options “Maximum clade credibility” or “User target tree”. For the latter option, a NEXUS tree file can be specified as the Target Tree File, below. For the former option, TreeAnnotator will examine every tree in the Input Tree File and select the tree that has the highest sum of the posterior probabilities of all its nodes. • Node heights - This option specifies what node heights (times) should be used for the output tree. If the “Keep target heights” is selected, then the node heights will be the same as the target tree. The other two options give node heights as an average (Mean or Median) over the sample of trees. • Target Tree File - If the “User target tree” option is selected then you can use “Choose File...” to select a NEXUS file containing the target tree. • Input Tree File - Use the “Choose File...” button to select an input trees file. This will be the trees file produced by BEAST. • Output File - Select a name for the output tree file. Once you have selected all the options, above, press the “Run” button.
12