monitoring and of dynamically reacting to certain monitoring events, but they differ in .... Change the order of message dispatching in message oriented middleware .... to locate and fix, hence advocating an approach of run-time behavior ...... monitoring system for smile beowulf cluster,â in Proceeding of the Third Interna-.
BEHAVIOR ISOLATION IN ENTERPRISE SYSTEMS BY MOHAMED S. MANSOUR
A Thesis Presented to The Academic Faculty by Mohamed S. Mansour
In Partial Fulfillment of the Requirements for the Degree Doctor of Philosophy in the College of Computing
Georgia Institute of Technology May 2007 Copyright © 2007 by Mohamed S. Mansour
BEHAVIOR ISOLATION IN ENTERPRISE SYSTEMS BY MOHAMED S. MANSOUR
Approved by: Karsten Schwan, Advisor College of Computing Georgia Institute of Technology
Alex Orso College of Computing Georgia Institute of Technology
David Kaminsky IBM
Calton Pu College of Computing Georgia Institute of Technology
Ling Liu College of Computing Georgia Institute of Technology
Date Approved: 6 April 2007
To my mother and father who made me what I am today. To my wife who stood by me every step of the way. To everyone who gave me a piece of advice along the way. Without all of you, I would not be here today.
iii
ACKNOWLEDGEMENTS
This work was made possible by support and advice from many other individuals. In this section, I will try to acknowledge every one of them. Please forgive me if I forgot anyone, I am still grateful for your help. My advisor Karsten Schwan gets the lion’s share. With lots of support and advice and plenty of hand holding in the beginning that gradually transitioned to support and guidance as I matured as a researcher. It would be an understatement to say this work would not have been possible without his help and support. I am also grateful to my thesis committee, their valuable feedback on my thesis proposal helped formulate a solid plan of attack to build a strong dissertation and provided a wealth of feedback that was instrumental in the writeup of this thesis both in its technical depth related to my work and also to the breadth of scope to relate my work to other areas of systems research. A big thank you is due to the nice folks at IBM: David Ogle, Mark Weitzel, Richard Allen, and Keith Smith were all instrumental in getting us on the right track with our IRMI research by answering technical questions related to Websphere, providing sample code and providing valuable insights to the system. Many thanks also to Heather McClain who made sure Ga Tech gets the best support possible with the IBM Academic Initiative program. The experimental aspects of I-Queue were made possible through collaboration with Worldspan. I was fortunate to know Mr. Sameh Abdel-Aziz at Worldspan who managed the relationship and overcame many obstacles to give me this opportunity. His help extended beyond the mundane managerial tasks to volunteering his time to explain the intricacies of the e-Pricing system, discussing my research ideas, and providing valuable feedback that was critical to the research. Many thanks also to the talented individuals I collaborated with
iv
at Worldspan: James Miller and Moni Panchavadi, thank you for accepting me as part of the team and for taking time off your extremely busy schedule to answer my questions. Special thanks go to Jegan Mehalinigham at Delta Technology. Jegan volunteered long hours of his busy schedule to listen, challenge and critique my research ideas and in the process providing supporting data from the Revenue Pipeline system. This level of access greatly helped my research and that of several other students in the program. Many thanks also to Joe Smart and his team, Mohan Tiruvaiyaru, Krishna Kolla, Seema Karkera, Madhu Kuriti, and Rajiv Koteshwar. This work was also made possible through early collaborations with former Delta Technology employees Rajiv Virmany and Gustav Pina. I cannot finish this section without acknowledging the help I got from other colleagues at the College of Computing. Ada Gavrilovska and Matt Wolf dedicated long hours to help me in producing and effective presentation of my work. Sandip Agarwala was always there for brainstorming and provided valuable pointers to other related research areas. Now I can finish, thanks to all who helped me along the way and my sincere apologies I forgot to mention anyone in specific.
v
TABLE OF CONTENTS DEDICATION . . . . . . . . . . . . . . . . . . . . . . . . . . . . . . . . . . . . .
iii
ACKNOWLEDGEMENTS . . . . . . . . . . . . . . . . . . . . . . . . . . . . . . .
iv
LIST OF TABLES . . . . . . . . . . . . . . . . . . . . . . . . . . . . . . . . . . .
x
LIST OF FIGURES
xi
. . . . . . . . . . . . . . . . . . . . . . . . . . . . . . . . . .
SUMMARY . . . . . . . . . . . . . . . . . . . . . . . . . . . . . . . . . . . . . . . xiii I
II
INTRODUCTION . . . . . . . . . . . . . . . . . . . . . . . . . . . . . . . .
1
1.1
Background . . . . . . . . . . . . . . . . . . . . . . . . . . . . . . . . .
2
1.2
Basic Definitions . . . . . . . . . . . . . . . . . . . . . . . . . . . . . .
2
1.3
Isolation Points . . . . . . . . . . . . . . . . . . . . . . . . . . . . . . .
4
1.3.1
Utility of Isolation Points . . . . . . . . . . . . . . . . . . . . .
4
1.3.2
Isolation Point Structure . . . . . . . . . . . . . . . . . . . . . .
5
1.3.3
Behavior Model . . . . . . . . . . . . . . . . . . . . . . . . . .
6
1.3.4
Physical Implementation . . . . . . . . . . . . . . . . . . . . . .
6
1.3.5
Isolation Localities . . . . . . . . . . . . . . . . . . . . . . . . .
7
1.4
External Behavior Enforcement . . . . . . . . . . . . . . . . . . . . . .
7
1.5
Evaluation Metrics . . . . . . . . . . . . . . . . . . . . . . . . . . . . .
7
1.6
Thesis Statement . . . . . . . . . . . . . . . . . . . . . . . . . . . . . .
8
1.6.1
Summary of Contributions . . . . . . . . . . . . . . . . . . . . .
8
1.7
Solution Approach . . . . . . . . . . . . . . . . . . . . . . . . . . . . .
9
1.8
Organization . . . . . . . . . . . . . . . . . . . . . . . . . . . . . . . . 10
APPLICATION DOMAIN . . . . . . . . . . . . . . . . . . . . . . . . . . . . 11 2.1
Overview . . . . . . . . . . . . . . . . . . . . . . . . . . . . . . . . . . 11
2.2
Delta Revenue Pipeline . . . . . . . . . . . . . . . . . . . . . . . . . . . 11 2.2.1
System Architecture . . . . . . . . . . . . . . . . . . . . . . . . 12
2.2.2
Usage Scenarios . . . . . . . . . . . . . . . . . . . . . . . . . . 14
2.2.3
Challenges . . . . . . . . . . . . . . . . . . . . . . . . . . . . . 14 vi
2.3
2.4 III
IV
Worldspan ePricing Engine . . . . . . . . . . . . . . . . . . . . . . . . 14 2.3.1
System Architecture . . . . . . . . . . . . . . . . . . . . . . . . 16
2.3.2
Usage Scenarios . . . . . . . . . . . . . . . . . . . . . . . . . . 16
Summary . . . . . . . . . . . . . . . . . . . . . . . . . . . . . . . . . . 17
BEHAVIOR ISOLATION IN COMPLEX ENTERPRISE SYSTEMS . . . . . 18 3.1
Introduction . . . . . . . . . . . . . . . . . . . . . . . . . . . . . . . . . 18
3.2
Mode of Operation . . . . . . . . . . . . . . . . . . . . . . . . . . . . . 18
3.3
Response Size as Quality of Information Metric . . . . . . . . . . . . . . 19
3.4
Behavior Model for Response Size . . . . . . . . . . . . . . . . . . . . 19
3.5
Validating the Behavior Model . . . . . . . . . . . . . . . . . . . . . . . 21
3.6
Improving System Utility . . . . . . . . . . . . . . . . . . . . . . . . . 23
3.7
Discussion . . . . . . . . . . . . . . . . . . . . . . . . . . . . . . . . . 24
3.8
Summary . . . . . . . . . . . . . . . . . . . . . . . . . . . . . . . . . . 25
ISOLATION POINT LOCALITIES . . . . . . . . . . . . . . . . . . . . . . . 27 4.1
Interaction with Lower Level System Resources . . . . . . . . . . . . . 27
4.2
Inter-Component and Inter-Machine Interactions . . . . . . . . . . . . . 29 4.2.1
4.3 V
Exploiting Semantic Program Knowledge . . . . . . . . . . . . . 29
Related Work . . . . . . . . . . . . . . . . . . . . . . . . . . . . . . . . 31
I-RMI: BEHAVIOR LOCALIZATION FOR RMI-IIOP . . . . . . . . . . . . 34 5.1
Introduction . . . . . . . . . . . . . . . . . . . . . . . . . . . . . . . . . 34
5.2
Motivation . . . . . . . . . . . . . . . . . . . . . . . . . . . . . . . . . 36
5.3
System Architecture . . . . . . . . . . . . . . . . . . . . . . . . . . . . 38
5.4
5.5
5.3.1
Behavior Dependencies in Application Interfaces . . . . . . . . . 39
5.3.2
Behavior Dependencies in Local System Interfaces . . . . . . . . 41
Implementation Details . . . . . . . . . . . . . . . . . . . . . . . . . . . 42 5.4.1
Modifying Call Stubs . . . . . . . . . . . . . . . . . . . . . . . 42
5.4.2
Modifying the IIOP Reader Layer . . . . . . . . . . . . . . . . . 42
Experimental Results . . . . . . . . . . . . . . . . . . . . . . . . . . . . 44
vii
5.6 VI
5.5.1
System Interfaces Isolation Point . . . . . . . . . . . . . . . . . 45
5.5.2
Remote APIs Isolation Point . . . . . . . . . . . . . . . . . . . . 47
Summary . . . . . . . . . . . . . . . . . . . . . . . . . . . . . . . . . . 50
I-QUEUE: SMART QUEUES FOR SERVICE MANAGEMENT . . . . . . . 51 6.1
Introduction . . . . . . . . . . . . . . . . . . . . . . . . . . . . . . . . . 51
6.2
Motivating Scenario . . . . . . . . . . . . . . . . . . . . . . . . . . . . 55
6.3
System Architecture . . . . . . . . . . . . . . . . . . . . . . . . . . . . 55 6.3.1
6.4
VII
Internal Design . . . . . . . . . . . . . . . . . . . . . . . . . . . 56
Experimental Results . . . . . . . . . . . . . . . . . . . . . . . . . . . . 58 6.4.1
Using I-Queue to Improve Server Reliability . . . . . . . . . . . 59
6.4.2
Using I-Queue to Improve System Utility . . . . . . . . . . . . . 61
6.4.3
Message Locality Using Global Isolation Point . . . . . . . . . . 63
6.5
Related Work . . . . . . . . . . . . . . . . . . . . . . . . . . . . . . . . 66
6.6
Summary . . . . . . . . . . . . . . . . . . . . . . . . . . . . . . . . . . 67
RELATED WORK . . . . . . . . . . . . . . . . . . . . . . . . . . . . . . . . 69 7.1
The InfoSphere Project . . . . . . . . . . . . . . . . . . . . . . . . . . . 69
7.2
Kernel Based Approaches . . . . . . . . . . . . . . . . . . . . . . . . . 69
7.3
Resource Accounting in J2EE Platforms . . . . . . . . . . . . . . . . . . 70
7.4
Component Based Performance Management . . . . . . . . . . . . . . . 71
7.5
Complementary Technologies . . . . . . . . . . . . . . . . . . . . . . . 71
7.6
Path Discovery Techniques . . . . . . . . . . . . . . . . . . . . . . . . . 71
VIII DISCUSSION AND CONCLUDING REMARKS . . . . . . . . . . . . . . . 73 8.1
Threats to Validity . . . . . . . . . . . . . . . . . . . . . . . . . . . . . 73 8.1.1
Sample Applications . . . . . . . . . . . . . . . . . . . . . . . . 73
8.1.2
Workloads . . . . . . . . . . . . . . . . . . . . . . . . . . . . . 73
8.1.3
General Discussion . . . . . . . . . . . . . . . . . . . . . . . . 74
8.2
Summary of Research Contributions . . . . . . . . . . . . . . . . . . . . 74
8.3
Future Directions . . . . . . . . . . . . . . . . . . . . . . . . . . . . . . 75
viii
INDEX . . . . . . . . . . . . . . . . . . . . . . . . . . . . . . . . . . . . . . . . . 77 VITA . . . . . . . . . . . . . . . . . . . . . . . . . . . . . . . . . . . . . . . . . . 96
ix
LIST OF TABLES 1
Query set sizes and fraction of unstable queries . . . . . . . . . . . . . . . 23
2
Average round trip time for client calls . . . . . . . . . . . . . . . . . . . . 49
3
Number of times primary server garbage collects per 100 client calls . . . . 49
4
A portion of the transition matrix from the resource leakage experiment . . 58
x
LIST OF FIGURES 1
Service path in RMI-IIOP - logical view . . . . . . . . . . . . . . . . . . .
4
2
General Architecture of an Isolation Point . . . . . . . . . . . . . . . . . .
5
3
Overview of Revenue Pipeline Subsystem . . . . . . . . . . . . . . . . . . 12
4
Queuing delays for each queue in Revenue Pipeline System . . . . . . . . . 13
5
General overview of message flows in travel reservation systems . . . . . . 15
6
Worldspan server complex: Architecture of one server . . . . . . . . . . . 16
7
Result size for thirty different executions of the same query . . . . . . . . . 20
8
Number of executions returning maximum result size . . . . . . . . . . . . 20
9
Max. queue length as a function of number of servers in the farm . . . . . . 24
10
Improved locality as a function of number of servers in the farm . . . . . . 25
11
Effect of secondary clients on message assembly time . . . . . . . . . . . . 28
12
Message assembly time at different socket buffer sizes . . . . . . . . . . . . 38
13
Overview of I-RMI . . . . . . . . . . . . . . . . . . . . . . . . . . . . . . 39
14
Request rate measured for a standard RMI-IIOP server . . . . . . . . . . . 46
15
Request rate for an I-RMI server . . . . . . . . . . . . . . . . . . . . . . . 47
16
Overhead of using buffer right-sizing to control cross talk in RMI-IIOP
17
Abstract view of nodes in an operational information system (OIS) . . . . . 48
18
Garbage collection at Primary Server . . . . . . . . . . . . . . . . . . . . . 49
19
Call rates measured at the primary server . . . . . . . . . . . . . . . . . . . 49
20
General overview of message flows in travel reservation systems . . . . . . 55
21
I-Queue System Architecture . . . . . . . . . . . . . . . . . . . . . . . . . 56
22
Memory Leak Model: Sensitivity to various message parameters and message sizes . . . . . . . . . . . . . . . . . . . . . . . . . . . . . . . . . . . 60
23
Memory Leak Model: Error reduction measured for different queue length settings(left) and for different training set sizes (right) . . . . . . . . . . . . 61
24
Effect of MAX_SEARCH_DEPTH on Geographic Match for different timeout values . . . . . . . . . . . . . . . . . . . . . . . . . . . . . . . . . . . 63
xi
. . 48
25
Effect of MAX_SEARCH_DEPTH on average excess delay for query at head of queue for different timeout values . . . . . . . . . . . . . . . . . . 64
26
Max. queue length as a function of number of servers in the farm . . . . . . 65
27
Improved locality as a function of number of servers in the farm . . . . . . 66
xii
SUMMARY
A barrier to creating the platform-independent services envisioned by middlewarebased development infrastructures is the level of performance robustness of the distributed applications created with them, in lieu of unpredictable variations in application behavior or in the resources available for satisfying user requests. Our goal is to improve the behavior locality of distributed applications and to prevent performance (mis-)behaviors from spilling across certain boundaries, since such spillage weakens behavior diagnoses and/or weakens or disables the effects of locally applied control or management methods. Toward these ends, we develop a novel software abstraction, termed isolation points (I-points), which can be used to isolate application components or subsystems from each other. The main contributions of this work are Isolation Points, which are software abstractions for monitoring and understanding dynamic runtime behaviors to better isolation application components hence creating more robust distributed applications. Two concrete artifacts using I-points also developed in this thesis are: I(solation)-RMI and I(solatoin)-Queue. I-RMI demonstrates the utility of isolation points in J2EE’s RMI-IIOP domain. I(solation)-Queue applies isolation points to message passing systems.
xiii
CHAPTER I
INTRODUCTION
Modern middleware and programming technologies are making it ever easier to rapidly develop complex distributed applications for heterogeneous computing and communication systems. The software architectures used for building such systems have evolved over the past 30 years, from monolithic applications running on centralized mainframe hardware, to client/server and three-tier applications spurred by the spread of cheap desktop PC and workstations, and next, to orchestrated services in service oriented architectures. The premise of our research is that the middleware technologies used to build such systems and the distributed environments in which they run are sufficiently complex to make it difficult, if not impossible, to optimize their runtime behavior. Further, in enterprise applications that carry out tasks critical to a company’s needs, it can be difficult to consistently deliver even the basic functionality needed by the enterprise, due to erratic system or software behaviors, dynamic variations in request volumes, and changes in resource availability. In response, this thesis methodically explores understanding, mitigating, and isolating dynamic system behaviors, as a means for improving a system’s ability to operate robustly and reliably. Accepting the fact that components or services may fail to meet their targeted service level agreements (SLAs), our goal is to: 1) detect abnormal or undesirable behavior and 2) prevent them from affecting neighboring services. In other words, the idea is to build ‘firewalls’ that prevent the spread of undesirable behaviors through systems. Our technical approach is to build middleware abstractions that incorporate ‘vertical’ (application/middleware/kernel) and end-to-end methods for these purposes.
1
1.1
Background
Performance isolation is not a new idea. Past work attempted to achieve this goal through virtualization, either as virtual machine monitors [20, 126, 122] or at the operating systemlevel [98, 2, 6, 58, 42, 18]. Other work along the same dimension focused on providing behavioral isolation for a specific sub-component [107, 108], or resource isolation among applications sharing the same hosting framework [40, 68]. Recent work in utility based computing [15, 13, 26] attempt to provide certain levels of guarantees for different classes of traffic, coupled with techniques for root cause localization and fast recovery [27, 34, 132, 37, 24, 46]. Other methods for dealing with undesired behaviors in server applications include request deletion in web servers [100], request prioritization or frame dropping in multi-media or real-time applications [111], and the creation of system level constructs supporting these application-level actions [95, 125]. Essentially, such methods are specific examples of the more general methods for dynamic system adaptation developed during the last decade [105, 131]. They share with adaptive techniques the use of runtime system monitoring and of dynamically reacting to certain monitoring events, but they differ in that the policy-level decisions made in response to certain events are focused on limiting dependencies rather than on exploiting them to optimize the behavior of the distributed system exhibiting these dependencies.
1.2
Basic Definitions
A component is the building block in our world model. A component is specified by its API interfaces, dependencies on external remote interfaces, and system interfaces. An example component is a Websphere instance running a particular back-end service, where the component description would then specify the input APIs for the service and the corresponding outputs, points of contact to external APIs, and system interfaces (e.g. dependencies on file I/O, communication sockets, or other similar low level system interfaces). The services we examine in this work are activated by an external message or request, and they respond by
2
returning a corresponding reply or an error. A component can describe a complete server process or a specific service. In the text we will use component, service and server interchangeably, to refer to component as defined in this section. The scope and level of detail for the model can vary and depends on the intended use. A component can be associated with one or more behavior models. A behavior model establishes a relationship between a measurable quality attribute of the component’s output, component’s interactions with its inputs, runtime environment, and any external services. To continue with the Websphere example, one can specify a behavior model that correlates response time to number of concurrent clients under normal operating conditions. In this dissertation, we focus on behavior models that describe undesired behaviors, for example unacceptable response times due to an increase in the number of concurrent clients. Behavior isolation refers to detecting conditions that lead to undesired behaviors and applying an enforcement mechanism to deal with them, thereby enabling the component to continue meeting its service objectives and isolating it from the ill effects of such conditions. A service path is the logical path inside a process boundary that traces a request from its point of entry to its application process until it exits the process. We are primarily concerned here with the segment of the path that traverses middleware layers. Figure 1 shows an example of a service path in RMI-IIOP. RMI requests arrive as IIOP fragments over TCP sockets. An IIOP fragment is read from the socket buffer, assembled with other fragments from the same message, then passed up to the RMI protocol layer which then forwards the message to the correct object. The reply is handled in the reverse order. A process might implement more than one mechanism for receiving and processing request messages. For example, Websphere supports RPC style calls (RMI-IIOP) in addition to JMS and Web Service type of interfaces, each with a different service path.
3
Figure 1: Service path in RMI-IIOP - logical view
1.3
Isolation Points
We propose a new method for constructing distributed enterprise systems using ‘smart’ middleware capable of understanding undesired behaviors and reacting online to contain such behaviors in application specific ways to maintain desired service objectives. To achieve this goal, we modify specific middleware subsystems and augment them with monitoring and control modules that can dynamically correlate service quality to data flows and/or system/kernel parameters, and subsequently manipulate the flows and/or parameters to maintain desired service quality. 1.3.1
Utility of Isolation Points
Our goal is to improve the behavior locality of distributed applications. The idea is to prevent (mis-)behaviors from spilling across certain boundaries, since such spillage weakens behavior diagnoses and/or weakens or disables the effects of locally applied control or management methods [37]. An example is an isolation point that recognizes clientbased garbage collection and in response, breaks the synchronicities between the client and servers, thus decoupling them in terms of their ability to affect each others performance. Isolation points provide a powerful mechanism for understanding behaviors at a local level, and isolating the undesired ones at local or global levels where most appropriate.
4
Policy Definition
Resource Monitor
Enforcement Mechanism
Figure 2: General Architecture of an Isolation Point 1.3.2
Isolation Point Structure
An isolation point is a monitoring and control module inserted at a specific point along a service path in order to monitor and maintain service quality. Figure 2 shows the general architecture of isolation points. Isolation points are composed of: 1) a behavior model and 2) an enforcement mechanism. Isolation points use request and resource monitoring probes to collect resource information and construct a behavior model. The enforcement mechanism uses the behavior model to detect and isolate patterns leading to undesired behaviors by applying user-specific actions. Isolation points can embed such actions, or they can use an external policy engine for storing and managing the user level policies. In this thesis, we use hard coded enforcement mechanisms. In practical implementations, such actions would be derived from user specified policies. The reader is referred to [103] for more work related to policies and policy engines. Isolation points can be deployed to deal with one or more undesired behavior effects, this association is a design and implementation issue. For clarity of presentation, we choose to associate our isolation point examples with specific behavior models. The choice of deploying certain types of isolation points to specific services in the distributed system is independent and local, however, coordination among multiple isolation points can add additional value to the system. Both independent and coordinated isolation points will be discussed in this thesis.
5
1.3.3
Behavior Model
The behavior model correlates certain input loads and/or message sequences to undesired changes in service quality. The behavior model gives us a relation between inputs and outputs that enables us to react at runtime and apply user-specific actions to prevent the undesired behaviors from occurring. Behavior models can be constructed in many ways, which include: • Statistical correlation • Machine learning • Domain expertise and heuristics The control mechanism uses the behavior model and monitors the the service to detect undesired behaviors, for example by detecting undesired input patterns. It then acts to mitigate their effects. Mitigation actions can take several forms depending on the specific case at hand, we list here some examples: • Change the order of message dispatching in message oriented middleware • Change default scheduler behavior • Change resource allocation, e.g. buffer space assigned to different socket buffers. 1.3.4
Physical Implementation
The physical implementation of an isolation point can map directly to a specific point in the code, for example a C function. More likely it will map to a group of functions, classes, and modules. Implementing an isolation point can be as simple as embedding calls to external mechanisms, or it can involve re-designing pieces of the middleware, for example using a single thread to read IIOP fragments instead of one thread per client connection. Different services in a distributed systems will act independently to monitor their own behavior and enforce local policies. 6
1.3.5
Isolation Localities
In this dissertation, we take a middleware centric approach where we place isolation points in middleware implementations. We have identified three general classes of service path localities fit for isolation points: 1) subsystems dealing directly with kernel/system interfaces, e.g., reader threads in IIOP protocol implementation, 2) subsystems responsible for dispatching messages to application code on local node, e.g., RMI message dispatcher, and 3) subsystems responsible for dispatching calls to remote nodes. Examples of these localities will be demonstrated in the following chapters.
1.4
External Behavior Enforcement
Isolation points, as defined in the previous section, become an integral part of a component. The behavior model(s) constructed by these points capture interesting relationships between component’s inputs and outputs. So far, we have argued for the use of such models to locally enforce behavior isolation. Our next step is to extend the definition of the component model to expose the behavior model, hence making the behavior model available to external components. This enables us to place the enforcement mechanism external to the component, possibly resulting in a more efficient implementation. For example, in single queue/multi server systems where certain server behaviors are triggered by specific input patterns, by exposing the behavior model we can place the enforcement mechanism at the queue level (queue dispatcher) where we can more efficiently control input sequences to all servers in the system.
1.5
Evaluation Metrics
To evaluate our approach, we focus on measuring the robustness of service quality as the service is subjected to different patterns. To quantify service quality, we use two metrics, Quality of Information (QoI) and Quality of Service (QoS). Quality of Information refers to any quantifiable attribute of the service output that can be measured at the service provider.
7
An example of QoI used in this dissertation is the number of alternate fares returned for a specific travel itinerary request. More fares mean more options to the consumer (end user) which ultimately leads to more consumer loyalty and higher conversion rates (convert the search into a sale). Hence, more fares returned in the result or answer reflect a higher quality from the search engine provider’s perspective. As we will show later, the search for alternate fares for a specific travel query is subject to a strict time limit enforced by contractual agreements, where the actual number of alternate fares returned by the search service can vary due to variations in processing speeds, cache misses and other factors outside scope of the search component itself [48].
1.6
Thesis Statement
Degradation in service quality can be effectively isolated - monitored and contained - by interposing local monitoring and enforcement modules at points along the service path or data flow. We term these modified program localities as Isolation Points. Isolation points are characterized by their ability to: • enforce behavior isolation at a local level without requiring global system knowledge, and • define service quality with flexible metrics including performance, QoS, and of quality of information. 1.6.1
Summary of Contributions
To our knowledge this is the first thesis to improve behavior robustness for enterprise applications using a dynamic mitigation-based approach. We propose the use of performance and behavior ‘firewalls’ to learn, identify, and proactively mitigate undesired behaviors at a local level. Our approach is also unique in its ability to improve application relevant metrics like quality of information. We present Isolation Points (IPs), a software approach
8
for building behavior-robust systems. We demonstrate the utility of IPs with two middleware implementations using commercial middleware and server applications from industry applications.
1.7
Solution Approach
This research was motivated by several case studies from industry [85, 120] and from popular application frameworks currently used to build enterprise applications. Our experimentation with one implementation of the popular J2EE [9, 4] framework shows performance vulnerabilities in a 3-tier application that enable one client’s misbehavior to impact server’s ability to meet its required SLA, a 56% drop in one experiment[84]. Another set of experiments show a strong correlation between a server’s behavior and the specific orderings of message sequences handled by that server, a case made more interesting as the server process is recycled for each request thus eliminating any inter-message dependencies at the application level [86, 85]. Yet another set of experiments from a completely different application environment show that business productivity can be affected because of lack of system support for automated processing of ad-hoc analytical queries against a production transactional database [120]. The above cases show that certain undesired behaviors can arise from subtle interactions between system subcomponents, or between applications and underlying systems. These dependencies can result in undesirable runtime behaviors when triggered by certain combinations of inputs. Furthermore, root-cause for these vulnerabilities can be difficult to locate and fix, hence advocating an approach of run-time behavior understanding and mechanisms for detecting and isolating these behaviors as a first line of defense. These problems are not addressed by current technologies. Virtualization layers and OS-based virtualization address isolation between entire VMs or entire application groups and do not address vulnerabilities at the application or request level. In a similar way, other approaches that aim at providing isolation solely at the application level [40] do not address
9
vulnerabilities resulting from interactions between application and underlying system subcomponents as well as correlation to particular client behaviors and/or message patterns. Our last point is to demonstrate how the problem at hand can be solved with only access to local monitoring information. [16, 34]. Certain systems can only meet their intended SLAs if configured in precisely the right form, in other words, global optimization is necessary to achieve a working system configuration. We will show that for the sample applications we have studied, local information is sufficient for understanding abnormal or undesired behaviors, and that localized actions can contain such behaviors and isolate them. Initial experiments were conducted in lab settings with standard application frameworks using standard benchmarks and workloads. As our understanding of the problem space evolved, we leveraged our contacts with Worldspan L.P. and Delta Technology to acquire scenarios from their production environments that can benefit from our research. Traffic traces that support such scenarios were also obtained. Simplified models were constructed to evaluate our research ideas and were evaluated with the traffic traces obtained from industry. Final experiments were conducted on-site using production software systems with sample traces.
1.8
Organization
The remainder of this dissertation is organized as follows. Chapter 2 gives an overview of the class of applications we target. To assist the reader in understanding the concept and utility of isolation points, we present a complete example in Chapter 3 using the ePricing server farm of Worldspan. Chapter 4 summarizes our experience with isolation point localities. Following are two concrete implementations of isolation points in popular middleware codes: I-RMI in chapter 5, and I-Queue in chapter 6. Related work is surveyed in chapter 7. Finally, concluding remarks and future directions are presented in chapter 8.
10
CHAPTER II
APPLICATION DOMAIN
This chapter presents an overview of two applications we considered in our research. The applications show that our work targets a realistic application space and provides tangible value to real-life users.
2.1
Overview
This work targets application systems deployed in mid to large enterprises. We further narrow our scope by selecting mission-critical large-scale enterprise applications with high request volumes and 24/7 operation. We target applications deployed on server farms with multi-tier architectures using either RPC style calls or message passing. The following sections present two industrial applications that are representative of this class of enterprise applications.
2.2
Delta Revenue Pipeline
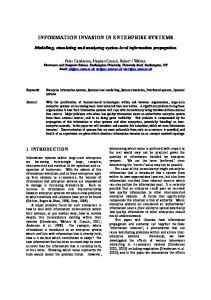
Delta Air Lines utilizes a revenue tracking system named Revenue Pipeline. The purpose of the Revenue Pipeline system is to track and report on operational revenue from worldwide flight operations. Due to generally accepted accounting principles, (GAAP) income cannot be realized as revenue until the service is performed or the product is shipped. For the airline, this means that money realized from ticket sales cannot be recorded as earned revenue until the customer boards the plane and flies to her destination (there are additional rules for cancellations and ‘no shows’). The revenue pipeline subsystem keeps accurate records of earned revenue, tracking all events relating to ticket sales, flight and passenger departures and arrivals, flight manifests, and various other events related to passengers and flights (e.g., lost baggage claims). 11
&('�)�)�*+)�'�,.-
8:9 '�-.;+@? =�=�A�,.-BA7)�= DE? -.- ? -BA
/1032 " ��� #$���%�
����
������������� �!���
Figure 3: Overview of Revenue Pipeline Subsystem 2.2.1
System Architecture
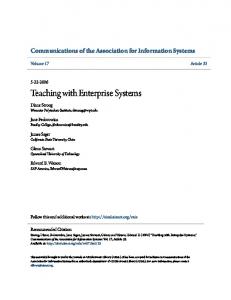
The system is fed with events from multiple sources distributed worldwide. These events represent ticket sales, passenger boarding, flight departure and arrivals and various other events. The system processes an average of 40 thousand messages per hour. The state is updated and stored in a production database (see Figure 3), the production database currently hold about 300 million ticket records and receives daily updates of about 250 thousand tickets. A nightly ETL (extract, transform and load) job extracts 80% of the daily updates to a data warehouse. The ETL job takes an average of 2.5 hours. The production database is also mirrored to a third data store dedicated to ad-hoc queries. The mirroring is set to update once a day so as to minimize any load on the production database. The revenue pipeline system is used for generating accounting reports, performing various business analytics as well as providing relevant information to other subsystems at Delta. We next explain in some detail some of the policies associated with the revenue pipeline subsystem. A critical accounting report must be generated to satisfy regulatory requirements. This constitutes a firm deadline at which all information fed to and produced by the subsystem must be up to date. Operationally, the report is executed against the data warehouse, and this defines a deadline for processing all incoming messages related to flights that departed for the current month, including current day flights. Missing the deadline can lead to financial costs in the form of productivity loss, lack of data for accurate financial planning 12
3.95
Average Queue Delay (hours)
3.9
3.85
3.8
3.75
3.7
3.65
3.6
1
2
3
4
5
6
7
8
Queue Num
Figure 4: Queuing delays for each queue in Revenue Pipeline System and impediments associated with missing a mandated filing deadline. Meeting the required deadline is not a trivial undertaking, as demonstrated by an analysis of the queuing delays experienced by the system’s current implementation. It indicates that messages can wait in the queue for up to four hours (see Figure 4), in some operating conditions. Given that queuing delay and the length of the queue (about 4000 messages on average), we find that satisfying the up-to-date requirement can take up to 8 hours depending on the number of events relating to today’s flights and their positions in the queue. Clearly, additional computing resources for this subsystem could reduce these delays, but such additional allocations would violate other IT cost-based policies of the enterprise. A particularly interesting interaction of the revenue pipeline subsystem with other subsystems is explained next. The revenue pipeline subsystem serves as a source for other subsystems to gain up to date information on the company’s current operational states. This subsystem has a wide variety of users, some just providing updates, but others desiring to perform complex or long running queries that have substantial resource demands. Unfortunately, the imposition of excessive load on the production database can reduce its performance to the extent where its consequently increased delays slow down subsystems like revenue pipeline. This is particularly true during peak load hours. An alternative target for such business queries is the data warehouse, but its information (updated only once a day) may not be sufficiently
13
up to date and/or complete. The database mirror provides an intermediate solution with more recent snapshots of the data and lower access cost, but lacks the historical quality of the data warehouse. 2.2.2
Usage Scenarios
On an average day, there is a need to run one or two queries against the production database itself, because of the highly up to date information it contains. The current system uses a manual approval process for such access. This requires business users to first seek approval, then the query is sent to the system administrator, who executes the query and carefully monitors certain system metrics while it is executing. The purpose of monitoring is to make sure the database has sufficient capacity to handle its normal load of transactional messages in addition to the query being run. This takes one to two hours and consumes 4-5 man-hours of some of the highly qualified and least available employees. 2.2.3
Challenges
The manual routing and monitoring of query execution in addition to the manual process involved with managing the database refresh process prompt us to consider methods to automate such efforts. The additional mirror database in the Revenue Pipeline system provides an interesting mechanism for providing a data source with a trade off between cost of access and data utility. Careful planning of the database snapshots which takes into account user tolerance for delays and anticipated load from user queries can lead to substantial savings in terms of production database resource consumption.
2.3
Worldspan ePricing Engine
With the proliferation of the Internet, a large percentage of travel reservations are now done online. We present here an overview of the IT systems involved in travel booking and reservations. Airlines and other travel providers publish their fares, rules and availability
14
Client 1
Client 2 Client 3
Message queue
Clearinghouse (CW)
GDS Airlines
Figure 5: General overview of message flows in travel reservation systems information to clearing warehouses (CW). The CW in turn publishes the updates to several Global Distribution Services (GDSs). The GDS implements several services which for a given travel itinerary searches for the lowest available fare across multiple providers (airlines). Figure 6 shows an overview of the major components of this distributed system. The second application we present is a pricing engine from Worldspan, a global GDS provider and a leader in Web-based travel e-commerce. A pricing engine receives a travel itinerary, searches a large database of prices, fares and rules and returns a list of available routes sorted by fare. It is estimated that the size of the fare and pricing database at Worldspan is currently at 10GB and is expected to increase by approximately 20% over the next few years. 10GB is the size of data files used to store the fare and pricing information for international flights. That includes data and index structures needed to access the data efficiently. The current practice is to completely rebuild the 10GB file from scratch for every update (about 8 per day). Worldspan receives an average of 11.5 million queries per day with contractual agreements to generate a reply within a predetermined amount of time. The high message volume coupled with constantly changing system state creates a need for monitoring and reliability middleware that can learn the dynamically changing performance characteristics and adapt accordingly.
15
'(! & ! )*� � ���
$ ��� ��%�&
+-,(. /10 2(3547684�9:2;.?274�4 @ 2(35476�4�9:2;.�274�4
���������� � � �� ������
��������� � ! �#" ������ � ����
��
�� �� ��
Figure 6: Worldspan server complex: Architecture of one server 2.3.1
System Architecture
Worldspan operates a server complex of approximately 1500 server machines for processing pricing messages. The configuration of each server is shown in Figure 6. We label each process as either persistent or non-persistent. A persistent process remains alive across several messages, while a non-persistent process is started to process a message, then terminated with a new process launched for the next message. 2.3.2
Usage Scenarios
System administrators for the ePricing engine configure the server to run in non-persistent mode. This choice reflects the complexity of the application code, since starting a new process for each request eliminates the need to clean all related state in the process, a nontrivial programming task. Terminating and restarting a new process for each query has no impact on its actual processing time measured in the system. This is because (1) there are no server-resident request queues and (2) a server machine is considered unavailable and thus, no queries are sent to it during process termination, launch, and initialization. Query time is measured only once the process is fully initialized and ready to accept a new message, and a query is considered complete after a reply has been sent. The inefficiencies implied by non-persistence are overcome by adding extra machines
16
to the server complex and thereby maintaining a low overall complex utilization. The economies of this decision are deemed preferable to investing the additional programming and debugging time needed for correct operation with process persistence.
2.4
Summary
This chapter presented two applications used in this dissertation. The applications are representative of a class of mission critical enterprise applications characterized by high request volumes, large state, and high reliability requirements.
17
CHAPTER III
BEHAVIOR ISOLATION IN COMPLEX ENTERPRISE SYSTEMS
In this chapter we present the Worldspan ePricing application in more detail and some of its associated behaviors that motivate our research.
3.1
Introduction
Consider flight searches and subsequent bookings made by end users planning future travel. One of the systems operated by Worldspan is the ePricing flight and fare search engine, which responds to requests from various travel sites. Applications like the ePricing engine are complex, often exhibiting unforeseen performance dependencies, caused by application code, by application/OS interactions, and by variations in server hardware. A specific case in point is the variation in server performance based on the sequence of queries processed by the server shown in Figure 7. These variations are observed despite the fact that the ePricing engine uses ‘clean’ servers, that is, its server processes are terminated and restarted for each request. Online monitoring can detect the presence of this behavior [64, 51, 79, 82, 118], but we have not been able to diagnose its root cause1 , and it is not cost-effective to perform additional root cause analysis. The behavior isolation-based approach and associated software abstractions developed in this thesis constitute a viable method for dealing with such complex behaviors.
3.2
Mode of Operation
For each query, the server process is bounded by a timeout T dictated by the requestor (typically 16 seconds). After T seconds, the server aborts the search process, returns the 1
One hypothesis is that these variations are caused by an interaction between the application software and the Windows operating systems running on those machines.
18
results it has found so far, and terminates. It is possible that the server exhausts the search space before T . This is the case with travel requests for which there are not many available seats. In this case, the server process returns an answer as soon as it realizes that it has exhausted its search and then terminates.
3.3
Response Size as Quality of Information Metric
The ePricing server has to search a very large state in a bounded time in order to return the cheapest fares in response to requests. Specifically, it is desirable to find and return many alternate fares with each reply, since that translates into the possible discovery of cheaper fares or into additional, useful choices provided to end users. Cheaper or additional fares lead to improved customer experience, which leads to higher customer loyalty and possibly, increased chances in converting the search query to a ticket reservation and booking (a revenue-generating event). Hence, the number of solutions returned for each request, ‘Response Size’, is an important and carefully monitored business metric.
3.4
Behavior Model for Response Size
In Figure 7, we show the ‘response size’ metric for a specific query on 30 different executions with identical seat availabilities. These experiments show that for the same queries, this metric can differ by up to 13% if the query is executed on a server machine that was subjected to other queries of the same geography (e.g., all queries for travel between East Coast USA and Europe) vs. queries of mixed geographies (e.g., East Coast to Europe AND West Coast to Asia). Figure 8 depicts the results for 8 queries that are executed under two different settings: (1) Local, in which all queries and the same geography and (2) Mixed, in which the queries were of mixed geographies. The application and system experts at Worldspan strongly suspect these effects are due to certain patterns of query sequences executed in each server, specifically caused by patterns with queries from different geographies which is explained next.
19
44 43
Number of Results in Reply
42 41 40 39 38 37 36 35 34
1
2
3
4
5
6
7
8
9 10 11 12 13 14 15 16 17 18 19 20 21 22 23 24 25 26 27 28 29 30
Execution #
Figure 7: Result size for thirty different executions of the same query
No. Executions Returning Max Results
35
30
25
20
Local Mix
15
10
5
0
1
2
3
4
5
6
7
8
Query #
Figure 8: Number of executions returning maximum result size
20
The geography of a fare request is defined as the geographic region of travel origin and destination. For example, a fare request for travel from Atlanta to London can be classified under the East Coast/Europe geography, similarly, a fare request for travel between L.A. and Tokyo can be classified under the West Coast/Asia geography. This geographic classification is based on how fare data is physically store on disc by geographies. Based on this input we assume a behavior model that strongly correlates response size with query sequences comprised of similar queries. This assumption is validated in the following section.
3.5
Validating the Behavior Model
Experiments conducted on-site at Worldspan facilities are used to validate the hypothesis that query time is affected if sequential queries cover different geographies (e.g., a query for travel from Atlanta to Paris, followed by another for travel from L.A. to Tokyo). To evaluate the aforementioned affinity effects, we compare the results of two sets of queries: Set #1 contains queries for travel between the U.S. east coast and Europe; it is composed of 37 queries. Set #2 is composed of 20 queries for flights between the U.S. west coast and Asia. We next show that this locality in message parameters, henceforth termed message locality, impacts server performance. For each set, a long stream of requests is generated by repeating the queries in the set repeatedly for 33 times, each time using a randomized order. For each query execution, we observe the number of solutions returned in the reply message, where the number of solutions is the term used to denote the number of alternative routes and fares the server detects for this particular query. A key item of interest here is that for this application, the measurements of delay and throughput commonly used in the literature on enterprise or web services are not suitable. This is because the SLA (Service Level Agreement) the organization must meet for search services combines minimum delay with response quality. The quality of a reply is measured by the cheapest fare it can find for a given
21
request (based on seat availability) and also by the number of alternate fares it can find. The two are related as the system is more likely to find the cheapest fare if the search is able to cover more space within the given time restrictions. We use the size of the response as a direct measure of the number of alternate fares returned by the server as the overheads in the XML reply are fairly constant across replies. For this SLA, latency requirements are always met, by intentionally underloading servers, with server utilization never exceeding 50%. The key property of interest, therefore, is response quality. More generally, then, to attain behavior isolation, this means that we must consider application-level semantics and quantities, such as parameter values (i.e., response quality) and the correlation of changes in such values and in application behavior. A conclusion from these facts is that behavior isolation requires instrumentation at application-level, in addition to the instrumentation vendors are adding to the middleware and system levels. Experiments were conducted on an IBM eServer with 3GB of RAM running Windows Server 2003 in a controlled environment in which the testing machine is not subjected to any state updates while executing these query sets. In the more general case, such updates arrive once every 8 hours, updating flight schedules and prices, and once every 1/2 hour, updating seat availability. For these controlled experiments, therefore, the server should return the exact same number of solutions for all executions of a particular query. The experimental results show that this is not the case. In fact, we identify certain unstable queries that return different solution sizes for different executions. Table 1 summarizes the frequency of such queries, and in Figure 8, we plot the number of executions returning maximum alternate fares (solutions) for each query. Notice here that executions in which queries are reorganized to attain better query locality (MIX) demonstrate higher utility to the end user overall.
22
Table 1: Query set sizes and fraction of unstable queries Query Set #1 Query Set #2 Total Queries 37 20 Time Sensitive Queries 7 2
3.6
Improving System Utility
In this section we evaluate an isolation point based approach to dealing with query instability. In this example, we enhance the message queue dispatcher with a global isolation point that chooses the server for processing the next message based on server state. The dispatcher attempts to improve the utility of the farm (geo utility in our example) by matching the query being dispatched to an idle server whose last execution matches this query. Our proposed isolation point is evaluated with data traces collected by the quality assurance group at Worldspan - over 1, 970 request messages. We initially executed these messages on the server to measure the response time for each message. The results are entered into a simulation developed to evaluate certain behaviors. This is explained in more detail below. Experiments were conducted in Worldspan’s Atlanta offices using a production version of the ePricing server running on an IBM eServer hardware comparable to the machine configuration utilized in Worldspan’s server complex. The number of servers was varied between 10 and 100. The message arrival pattern was assumed uniform with 500ms inter-arrival time. Figure 9 plots the maximum queue length against number of servers, each data point representing the maximum queue length observed over 20 runs with different message ordering. Queuing delays are observed for farm with less than 28 servers. Figure 10 shows the measured geographical match as a percentage of all messages processed. The maximum match percentage is 97%, which is calculated by sorting all messages according to their geographical code and counting the percentage of messages that matches their previous neighbor. As seen from the graph, we can obtain a match level of about 44% at 28 servers. Adding more servers to the farm does not necessarily improve queuing delays or response time but does increase the geo match
23
900
Max. Queue Length
800 700 600 500 400 300 200 100 0
10
15
20
25
30
Num Servers Figure 9: Max. queue length as a function of number of servers in the farm percentage, We note here that Worldspan operates their farm at a 50-60% utilization factor, while that translates to 56 servers in our simulation, results in roughly 80% geo match percentage. The geo match obtained with no isolation points (baseline measurement) was 7-8%, this represents the case of dispatching messages to any available server regardless of execution history.
3.7
Discussion
The behavior in Figure 7 is partly explained by the following facts. The server has to search a very large state for the cheapest fares. The server responds to a query if: (1) it exhausts its search space, or (2) it hits some timeout limit. Such timeout limits were experienced for the unstable queries summarized in the table. In contrast, for stable queries, the server quickly finds the best solutions and then uses its remaining time before timeout to eliminate (and then, not return) suboptimal results. A conclusion from these observations is that while isolation points can detect and even correct (see below) certain undesirable application behaviors, it is typically easier to carry out such behavior isolation actions than it is to detect and/or correct for the root causes of such behaviors. This insight motivates our
24
120.00% Max. Geo Match
% Geo Match
100.00% 80.00% 60.00%
Min. servers to meet SLA
40.00% Baseline
20.00% 0.00%
10
20
30
40
50
60
70
80
90
100
Num Servers Figure 10: Improved locality as a function of number of servers in the farm focus on using the relatively cheaper remedy of behavior isolation through isolation points compared to earlier pursuits in distributed system debugging [16, 34, 37].
3.8
Summary
The basic insight from these experimental demonstrations is that hidden behavior dependencies can strongly affect business utility (in this case, correlated with geography) in enterprise software, and that it is not unusual for such dependencies to be triggered by common requests. In summary, the experiments shown in this chapter provide two basic insights: (1) interactions between applications and underlying operating systems/hardware can have a significant impacts on system output, and (2) to diagnose or even understand (much less fix) such interactions, methods must use semantic information about the programs in which they occur. An example of semantic knowledge in the cases above is the ‘geography’ of request parameters. For isolation points, this means that in general, they must be able to access request parameters and/or selected relevant program state. This requirement is not met by the methods for middleware- or system-level monitoring advocated elsewhere [64, 31]. Instead, identifying the specific parameters to be monitored either requires user input or 25
extensive sensitivity analysis, and finally (3) current methods for dealing with such behaviors [27] are insufficient.
26
CHAPTER IV
ISOLATION POINT LOCALITIES
In constructing isolation points we need to carefully consider where to place our enforcement logic along the service path. In this chapter we argue for two classes of localities fit for that purpose. We also make a case for exploiting semantic program knowledge to support better behavior models.
4.1
Interaction with Lower Level System Resources
Modern software engineering practices encourage application developers to code based on abstract system models, a case in point being Java’s ‘write once run anywhere’ goal. This assumption opens the door to performance vulnerabilities because in reality, a gap exists between the application’s abstract system model and the system’s actual behavior under load, stress, or failure [10, 123, 75]. This gap leads to unexpected and undesired runtime behaviors. Abstraction from underlying system layers has tangible benefits to applications developers, such as code portability and reduced complexity. Furthermore, such abstractions make it possible to add adaptive middleware and system components that can deal with the issues mentioned above. An illustration of this point is given by a simple example from the Websphere implementation of RMI-IIOP (Websphere V5 running IIOP V1.2). This implementation dedicates a separate reader thread per client connection. In this implementation, when a server is subjected to invocations from multiple clients, all of the corresponding reader threads are activated, as they all receive notifications of data being available on their underlying sockets. It is up to the underlying kernel thread scheduler to decide which thread to run next. Assuming a round-robin scheduler and equal buffer sizes on all connections, it is common for streams with very small request sizes to receive better treatment compared to streams 27
Single Client
Two Clients
600
Assembly time (milliseconds)
500
400
300
200
100
0 100
150
200
250
300
350
400
450
500
Message size (KB)
Figure 11: Effect of secondary clients on message assembly time with large request sizes. Note that this analysis also applies to writer threads. Figure 11 shows how assembly time per message for a client increases by over 100% when the server is handling only one additional concurrent connection. The potential for ‘performance crosstalk’, or worse, for purposeful exploitation of such behavior is obvious. A game player who can modify his requests to the server to fit in half the number of fragments as other players can get up to twice his fair share of the server’s time. A client who needs to attach additional payload to his server requests can get penalized as the server continues to process smaller messages from other clients while waiting on the assembly of this client’s requests. We note here that fragment assembly occurs at the lowest level of the RMI-IIOP stack. The RMI logic, and the application of course, are only notified of message arrival when all fragments are read from the socket and assembled into one message. Therefore, any action to mediate this behavior is best located at that junction. One can argue that corrective measures can be taken at the middleware or even the application level, perhaps by imposing relative rate limits or similar mechanisms. However, due to the fact the higher layers are only notified when a complete message is fully assembled, they have no way to differentiate between two clients sending messages at different rates and/or sending messages of different sizes.
28
The example of messages of different sizes received at the socket layer is just one instance of performance dependencies observed at the interface of middleware to underlying system components. Similar dependencies exist elsewhere, including in file system interfaces, for disk caches, etc. We conclude that the middleware-system interface is one class of localities where it would be beneficial to place isolation points.
4.2
Inter-Component and Inter-Machine Interactions
Interactions between application components raise the potential for the spread of performance and behavior problems. In this work we focus on interactions via calls to component interfaces, both synchronous (RPC style) and asynchronous (message passing). Behavior isolation has to consider (1) the targets of inter-component calls, (2) the interfaces presented by components, and (3) the formal and actual parameters used in calls and their effects. A simple illustration is an example experienced by Delta Airlines, where in the past and assuming a modest number of directly connected travel agents, direct calls were allowed to a flight subsystem to extract current flight state. When opened up to the Internet, frequent calls to this interface resulted in sufficient slowdown to cause it to seriously violate its performance guarantees to subsystems that relied on it. Isolation points associated with this call target and this specific interface can detect and then, correct for problems like these (e.g., by shutting down this interface). 4.2.1
Exploiting Semantic Program Knowledge
Poison Messages.
Efficient performance isolation may require knowledge beyond what
can be supplied by operating systems or middleware. A specific case occurring in an airline enterprise information system (EIS) was abnormal performance observed as occasional surges in resource usage. If unchecked, this could threaten operational failure (e.g., inappropriately long response times) and/or revenue loss (e.g., clients going to alternate sites). The methods for performance isolation described earlier can detect such behavior and prevent it, by shutting off the misbehaving subsystem, but such drastic action penalizes many 29
requests not linked to this abnormality. In this particular case, a more refined approach is to create an isolation point that tracks request parameters and types, to dynamically identify the requests that cause the behavior. Such an isolation point, however, must have access to program semantics like parameter types, values, etc. With such knowledge, it is then possible to build models that can correlate certain message parameters and type or format information about them to certain system behaviors (e.g., resource consumption). More generally, of course, the culprits may not be single poison requests, but they may be ‘poison sequences’ along dynamic program paths. This is discussed next.
Poison Sequences. In the more general case, we find that certain combination of message sequences can result in unacceptable dynamic behaviors similar to the ones described above. An example of such behavior is a server that leaks memory every time it processes and incoming message where the amount of leaked memory is directly proportional to message size [86]. A simple remedy to this problem is to reboot the server every X messages, or every T hours or minutes. Both approaches fail to acknowledge that a sequence of messages with large size would lead to larger memory leaks compared to a sequence with small message sizes. In this case, an isolation point that tracks incoming message sizes can give a better prediction of when to perform a server reboot, or more interestingly, control the message sequence in some application defined way (e.g. reorder the messages) so that the server sees longer sequences with small message sizes and hence requires less frequent reboots. Another example, one we cited already in Section 2, is that of message locality in the Worldspan ePricing application. By linking message dispatching with the content of the From and To fields of the queued messages and combine that with the execution history on the server machines we can achieve higher business utility. In summary, achieving behavior locality requires us to insert isolation points that monitor and control: (1) interactions with lower level system resources and (2) inter- and intra-
30
component interactions. Isolation points can greatly benefit from exploiting semantic program knowledge to accurately identify causes from mis-behavior and efficiently deal with them.
4.3
Related Work
Prior work has developed many methods for dealing with performance problems in server applications. The latter include request deletion in web servers [100], request prioritization or frame dropping in multi-media or real-time applications [111], and prior work on the creation of system-level constructs that support these application-level actions [95, 125]. The objective of such work is to eliminate or limit undesirable performance behaviors to attain desired levels of Quality of Service (QoS). Such methods, therefore, are usefully employed with the isolation point-based approach advocated here. Also of use is earlier work on dynamic system adaptation [22, 39, 105, 131], which attempts to improve the behavior of the distributed systems’ performance [89, 105]. Performance isolation is a well-established principle in modern operating systems [20]. This work advocates such an isolation-based approach to performance management, but differs from prior work in that it also considers performance dependencies that exist across the different layers of abstraction existing in current systems, such as dependencies across system-level communication protocols and the middleware-level messaging systems that use them. The specific results attained here for Java RMI-IIOP and J2EE-level method calls are related to earlier work done on the IQRUDP [57] data transport protocol, which coordinates middleware-level and transport-level adaptations to better meet application needs. What is new here, however, is that we consider explicit characteristics of the more complex Java middleware environments, including Java’s garbage collection techniques. Hardware, kernel, and application-level protection and isolation have been studied extensively for single Java virtual machines [40]. [68] applies the concept of a Java resource accounting interface to isolate applications inside a JVM at the granularity of isolates to
31
J2EE platforms. In comparison, our work focuses on performance isolation at single request granularity (even within the same application), and we identify three kinds of performance dependencies embedded in the middleware implementation of J2EE and WebSphere. Since detection logic is placed into middleware prior to application execution, resource reservation approaches like those described in [68] can be used as an enforcement mechanism, where thresholds are set dynamically by a resource monitor. Note that some of the scenarios presented here are not addressed by the isolate mechanism, such as when the vulnerability point is in the lower levels of the middleware before the message is parsed and dispatched to its target application (isolate). Machine learning techniques have been applied successfully in previous studies to server and process monitoring. Application traces for detecting application faults are examined in [104, 81, 46, 65]. Bowring et al. use similar methods to classify software behavior based on program traces [25]. These studies use application traces to detect a problem as it occurs and to recover the system by restarting the whole or parts of the system. Our approach differs in that it uses application-defined methods to dynamically adjust system parameters or behavior, to increase system utility. The SLIC project at HP Labs [59] applies statistical learning methods to problems similar to those addressed in this work, including performance forecasting [97] and performance diagnosis [132, 36, 70, 93, 130]. These methods classify based on system metrics, without leveraging the additional information available in incoming request parameters. Our experience with multiple industrial applications shows that the values of request parameters can be excellent predictors of certain interesting system behaviors and thus, should not be ignored for the development of effective methods for runtime behavior diagnosis and management. Application Response Management (ARM) [62] is an instrumentation API mainly concerned with profiling request flows in a distributed application. The instrumentation code collects data on transaction and sub-transaction boundaries and processing time at each
32
step. The data is fed to an analysis engine for analysis and monitoring. Isolation points are similar to some extent to tools that build on ARM (e.g. eWLM [60]), in the sense that they monitor requests, analyze and detect anomalies, and then apply some corrective action. This is a very common architecture in autonomic and adaptive systems. The difference, however, is as follows: 1) Isolation points advocate a more localized approach. We try to identify the problem at the node level and contain it there to prevent its spread to other parts of the system. 2) Our approach is ‘vertical’ by correlating measurements from the application layer to the kernel/OS level, as necessary.
33
CHAPTER V
I-RMI: BEHAVIOR LOCALIZATION FOR RMI-IIOP
In this chapter we present the detailed design of I-RMI, a version of RMI-IIOP enhanced with three representative isolation points. Basic evaluations of I-RMI and its utility in behavior localization are also presented.
5.1
Introduction
Modern middleware and programming technologies are making it ever easier to rapidly develop complex distributed applications for heterogeneous computing and communication systems. Typical software platforms are Microsoft’s .NET, Sun Microsystems’ Java 2 Enterprise Edition (J2EE) specification, and vendor implementations of these specifications like IBM’s WebSphere, BEA’s WebLogic, and open source efforts like JBoss. Businesses use these platforms to link different enterprise components across the wide spectrum of hardware and applications that are part of their daily operation. Science and engineering applications benefit from their rich functionality to capture data from remote sensors and instruments, access shared information repositories, and create remote data and collaboration services. The software platforms identified above are mapped to hardware infrastructures in which end clients are concerned with data capture or presentation (Tier 1), supported by two server-level tiers that implement application and storage services, respectively. The J2EE architecture follows this 3-tier model by defining three container types to host each of the tiers, where containers offer sets of standard services to cover non-functional requirements like transactions, messaging, and security. The goal is for developers to be able to focus on business logic and processes rather than having to deal with dependencies on client or server hardware and software systems. 34
A barrier to creating the system-independent services envisioned by application development platforms is the level of performance robustness of the distributed applications created with them, in lieu of unpredictable variations in user behavior or in the resources available for satisfying user requests. Recognition of this fact has resulted in a multiplicity of techniques for dealing with behaviors like bursty request volumes, including dynamic load balancing and migration, server replication, and similar runtime methods [17, 28, 96]. For media-rich or data-intensive applications, bursty loads can be combated by reducing the fidelity of media content, skipping media frames, or using application-specific techniques for reducing computation and communication loads [128]. Our interest is to use application- or environment-specific techniques like those listed above to create more performance-robust distributed applications. The goal is to better isolate applications from each other with respect to their performance behaviors. The consequent technical contributions of this chapter are the following. First, experimental evidence demonstrates the importance of performance isolation toward creating well-behaved distributed applications. Specifically, we show that the unusual behavior of even a single client can substantially diminish a data-intensive J2EE server’s ability to provide suitable levels of service to its other clients. Second, we propose an approach to achieving performance isolation that (1) exposes system resource information to the middleware layer, (2) enriches the middleware layer with methods for analyzing and adapting application behavior, isolation points and adaptation modules, (3) permits the middleware layer to execute these solutions when or if necessary, the latter based on (4) user-defined SLAs (Service Level Agreements). A final contribution is the description of a general architecture for performance-isolated messaging both for J2EE applications and for the popular publish/subscribe programming model. The concrete artifact produced by and evaluated in this research is I(solation)-RMI, a version of RMI-IIOP enhanced with functionality that enables applications to detect and react in meaningful ways to violations of performance isolation SLAs.
35
Results attained with I-RMI are encouraging. For the well-known Trade benchmark, for example, complete elimination of side-effects (an up to 56% drop in throughput) resulting from slow clients. These results are achieved by using a sliding window algorithm at two different isolation points.
5.2
Motivation
There is a plethora of work addressing runtime performance management in distributed server systems, ranging from system-level solutions like process/load migration or request throttling [96, 124, 100], to application-level tradeoffs in the quality of server responses produced for clients vs. server response time [45, 76], to the creation of new middleware or system abstractions that support the runtime adaptation of applications and systems in response to changes in user requirements or platform resources [39, 47, 57, 83, 94, 95]. Modern distributed applications created with development platforms like those based on the J2EE standard are sufficiently complex to make it difficult, if not impossible, to design application-wide methods for optimizing their runtime behavior. Instead, we address the simpler problem of curtailing or limiting the spread of performance problems across distributed client/server subsystems. Examples of this problem occur in the enterprise system run by Delta Air Lines: (1) a backup job run by an administrator during system operation can generate a sufficient level of I/O to slow down file system operations for another subsystem running on the same machine, or (2) the logging of operational data contained in files to a backend database slows down other subsystems that use or produce this file data. One result of such slowdowns is that they cause other subsystems’ request queues to build up, including those from the front ends used by clients, potentially leading to operational failures (e.g., inappropriately long response times) or revenue loss (e.g., clients going to alternate sites). The problem, of course, is that performance degradation in one part of the system (i.e., the storage subsystem) leads to performance degradation elsewhere. In other words, the system does not adequately deal with or isolate the performance dependencies
36
inherent to this distributed application. Our approach to limiting performance dependencies in distributed enterprise applications like those described in [21, 127] is to enhance middleware with functionality that offers improved levels of performance isolation, thereby creating a performance analogue of the firewalls used in computer security: (1) by examining middleware to identify points along the code path that are vulnerable to performance dependencies, termed isolation points, and (2) by re-coding these points and enhancing them with a generic and extensible API that permit developers to define runtime reactions to violations of applicationspecified measures of performance exhibited by applications, represented as adaptation modules. The outcome is the creation of performance ‘firewalls’ that prevent the spread of performance problems across different components of distributed applications. Our implementation approach addresses the broad class of web service-based applications, by associating instrumentation and support for performance firewalls with the RMI/IIOP implementations used in interactions between web, application, and backend servers. Specifically, I-RMI uses three representative isolation points to achieve behavior locality. In the first isolation point, we modify the IIOP implementation in Websphere V5 to use Java’s non-blocking socket APIs and expose the socket buffer size to the isolation point logic. The new model enables us to: (1) have predictable performance from the fragment assembly codes in the IIOP layer, and (2) align this behavior with user-defined service level objectives by controlling relative buffer sizes on each socket connection (see Figure 12). This isolation point demonstrates the importance of managing interfaces with lower level system resources to achieve behavior locality. Additional isolation points are added by instrumenting the generated RMI stubs. The instrumentation codes track incoming method calls and outgoing method invocations (to remote clients). By correlating that information with monitoring information from target machines, we are able to detect situations where the server becomes unable to process its pending requests, which may in turn lead to queue buildup and result in pressure on
37
1x
2x
4x
8x
16x
32x
600
Assembly time (milliseconds)
500
400
300
200
100
0 100
150
200
250
300
350
400
450
500
Message size (KB)
Figure 12: Message assembly time at different socket buffer sizes the memory subsystem (as reviewed in Section 3.2.2). Avoiding such situations helps us prevent the ripple effect that would otherwise result if servers were not protected against slow-responding remote method invocations.
5.3
System Architecture
I(solation)-RMI (I-RMI) is a version of RMI-IIOP [7] enhanced with three classes of isolation points, to cover J2EE’s applications’ intra- and inter- process interactions, as shown in Figure 13. The goal is to create an implementation of RMI [129] suitable for the information-flow architectures prevalent in today’s enterprise computing systems. As with related abstractions developed in earlier work [54, 83, 101], the changes made by isolation points occur at the middleware level and can be realized and carried out without requiring modifications to application code. The monitoring and adaptation methods used at these points use well-established techniques from adaptive and autonomic computing domains [90, 55].
38
Application Code
Incoming calls
Outgoing calls
‘Local Execution’ Isolation ‘Information Flow’ Isolation RMI IIOP ‘Low Level Interactions’ Isolation I-RMI Kernel
Connections to remote clients
Figure 13: Overview of I-RMI 5.3.1
Behavior Dependencies in Application Interfaces
The idea of isolation points applies both to client-server- and event-based distributed applications. Consider the structure of typical enterprise information systems described in [87]. Events generated at the edge of a system trigger chains of message passing and processing inside the system, where each processing step augments, personalizes, or otherwise transforms the original event. An example of such a system is deployed at Delta Air Lines, which feeds ticket reservation events into a revenue estimation system. Each event results in 20-30 subsequent calls to other modules inside this system. The application uses asynchronous messaging to decouple senders from receivers. Message-based distributed applications have to be constructed and administered so that the rates of delivering messages into queues do not exceed the rates of extracting messages from queues and processing them. Jitter in rates [44] can both lead to queue buildup and put pressure on servers’ available memory resources. This in turn can deteriorate server performance and its ability to meet target performance levels. A concrete set of examples studied in this chapter addresses data-intensive applications, our intent being to explore the uses of J2EE infrastructures for manipulating the large data items implied by future applications in tele-medicine or -presence, remote collaboration, remote access to rich data sources [19], and data mining. For example, for the multimedia
39
or document management applications described in Liferay Portal [8], we expect message sizes to be quite large, and any additional delays in processing queued messages by remote clients can result in substantial server-level performance degradation. The ‘slow client’ isolation point added to RMI-IIOP is intended as a generic mechanism for handling the case described above. This point is inserted in the call path before call argument marshalling. The logic we inject into the path monitors queue behavior (system or application-level queues) indirectly, by monitoring the respective incoming and outgoing request rates. By combining estimates of queue lengths with resource utilization on the local and remote nodes, the injected code can detect situations where a slow node is causing serious queue buildup that might lead to performance degradation on the server. A sliding window is used to measure these rates, one window per causally connected incoming and outgoing APIs, one window for local resource information, and a third window for resource information on each remote machine. The specific action taken to reduce queue buildup is decided at runtime by user-supplied logic. Possible actions include: decreasing the sizes of call parameters to reduce the processing required on the target server, rerouting the call to another host, rejecting the call and having the sender deal with this exception, etc. Our next scenario is derived from an airline enterprise information system (EIS). System administrators strive to provide consistent performance levels for the operation of their system. An occasional surge in resource usage, traced back to a particular uncommon request type, can cause other subsystems’ requests to build up, including those from the front ends used by clients, ultimately threatening operational failure (e.g., inappropriately long response times) or revenue loss (e.g., clients going to alternate sites). Such uncommon request/message types are termed Poison Messages.
40
5.3.2
Behavior Dependencies in Local System Interfaces
Tennenhouse describes ‘QoS crosstalk’ as the effect of multiple concurrent streams on server performance [116]. We include an isolation point in I-RMI to manage and minimize such crosstalk effects. This section describes its implementation and demonstrates the potential of poor performance isolation in the presence of multiple concurrent request streams with varying request sizes. Such request streams are common in information flow applications between front-end Web/UI servers and backend business process servers. The RMI-IIOP implementation we use dedicates a separate reader thread per client connection. When a server is subjected to invocations from multiple clients, all of the corresponding reader threads are activated, as they all receive notifications of data being available on their underlying sockets. It is up to the underlying kernel thread scheduler to decide which thread to run next. Assuming a round-robin scheduler and equal buffer sizes on all connections, it is common for streams with very small request sizes to receive better treatment compared to streams with large request sizes. Note that this analysis also applies to writer threads. Behaviors like those explained in the previous paragraph can be unacceptable for certain application deployments or client connections. Known control methods addressing them include changing the socket buffer sizes for certain connections, altering threads priorities, or both. Setting the right buffer size for each connection requires that such a value be calculated uniformly for all connections. Toward these ends, we insert an isolation point at the IIOP reader thread level, and we re-implement parts of RMI-IIOP to use a single reader thread and non-blocking I/O. The single reader thread provides a single point of control where the ‘right’ buffer sizes can be calculated and applied. The resource monitor is responsible for tracking how many parallel streams are active. The enforcement logic dynamically adjusts the buffer sizes for each connection to achieve the desired relative weights. This modified implementation is backwards compatible with non-modified RMI implementations.
41
5.4
Implementation Details
We implemented the above isolation points in Websphere V5 and V6 using IIOP V1.2, as outlined in more details below. 5.4.1
Modifying Call Stubs
RMI, similar to other RPC style mechanisms, relies on generating stubs that handle the call transparency at runtime including marshalling and de-marshalling of call arguments. To implement the first two isolation points we inserted the monitoring adaptation logic in these stubs by inserting template source codes at pre-determined points in the stub source code. The code insertion was added by means of scanning the source code using regular expressions that matched the insertion locations and replaced them with code snippets that included the right hooks. The stubs were then recompiled and jar files were updated with the new class files. Placing the enforcement mechanism at the stub level is an implementation detail. Other possible methods include modifying the middleware code at a layer above the dispatchers or modifying the stubs using non-source code based methods. Our implementation chose to modify the source code of the stubs, which requires a recompilation of the code, alternate methods include binary code re-writing or dynamic code instrumentation [72, 73, 99]. This implementation method was chosen based on convenience and we acknowledge its drawbacks: required access to source code, unsafe as the regular expression might match more or less than what is desired, and sensitivity to changes in stub code generation. 5.4.2
Modifying the IIOP Reader Layer
As explained before, the IIOP implementation used a separate thread per client connection. Our goal was to modify the design to use a single reader thread that utilizes non-blocking
42
Java I/O APIs to service all client connections. Non-blocking APIs allow for better scalability as well as give us better control over managing system resources. While IIOP was designed with some flexibility in mind, for example by defining standard interception points, making changes in socket handling is at the core of the IIOP implementation and requires making some invasive changes. We had no access to source code and could work only with Java class files. The first step was to identify the Java classes that implemented the IIOP socket handling layer. We created a dumb RMI call on the server that made a thread stack dump, the few methods at the top of the stack gave us a clue as to which classes and methods handled the method dispatch. Next we scanned the jar files for these classes and reverse engineered them for their original Java source code using tools like []. Reverse compilation did not always produce valid source, especially for methods with long and complex code blocks - more on that later. The reverse-engineered code revealed the entry points into the RMI stack, we used that information to scan for the IIOP logic that calls these methods. We achieved this by mass reverse engineering the jar files then running a simple text search. Other tools were available to assist in such search [1], but we choose text search for its simplicity. At this point we identified the Java classes that implemented the IIOP protocol, which we didn’t need to modify, and by tracing the code we identified the call graph that starts at opening a socket, then listens on a socket and finally extracts a chunk of data and handles it to the IIOP parsing and dispatching logic. Our main concern was the communication layer which was implemented in a few classes only and was completely separate from the IIOP protocol details (parsing, versioning, ...). The next step was to change the design to use non-blocking APIs. We need to make the changes in 5 Java classes. First we reverse engineer the class file to obtain its source code, then we proceed to make the required changes in the source code. The new source is compiled and re-packaged in the jar file and the server is re-started to make the changes effective. Reverse engineering failed to produce valid Java code for some class files (by valid we mean code that can be compiled by the standard Java compiler). For these classes
43
we developed the following strategies: • Modify method behavior using Inheritance. In some classes it is desired to alter the behavior of one or more methods. However, the byte code for these methods, or other methods on the same class, cannot be reverse engineered into compilable Java source code. Our observation of such classes is that the instantiation points for such classes are often in simple classes that can simply be decompiled. Assuming we want to alter the behavior of method f oo on class A, we follow the following pattern: – Create a subclass a subclass B that inherits from A and override f oo with the desired behavior. The original f oo can be accessed by calling super. f oo(). – Locate call sites to newA() and replace them with newB(). It is our experience that while the class A might be overly complex for decompilation, it is often instantiated from simple classes that can be decompiled with no issues. By following the above two steps we created a subclass with the desired modified behavior. • Modify method behavior using byte code editing. We resorted to this approach in cases where we needed to make surgical changes to methods that did not lend themselves to Java decompilation tools. Using the BCEL tool [99] we were able to accomplish simple tasks such as substituting a method call with one of our own, injecting a method call at a function entry point or a function exit point. A combination of the above patterns enabled us to implement the design changes we sought after.
5.5
Experimental Results
Experiments are run in Georgia Tech’s enterprise computing laboratory, using Version 5.1 of IBM WebSphere J2EE server running on an x345 IBM server, a dual 2.8GHz Xeon
44
machine with 4GB memory and 1GB/s NIC, running RedHat Linux 9.0. The server runs against Version 8.1 of DB2 which runs on a separate machine with an identical configuration. Clients, secondary servers and load generators run on an IBM BladeCenter with 14 HS20 blade servers installed. Each blade has dual 2.8GHz Xeon processors with 1GB RAM and 1 Gb/s NIC card running RH Linux 9.0. Trade benchmark was running on Websphere 6.0 ND using DB2 V8.1 database running on a separate host. Rational Performance Tester (RPT) was used to generate the workload for the trade benchmark. 5.5.1
System Interfaces Isolation Point
We employed two techniques to control the cross talk between client communication channels. the first is to use a single thread to handle all read operations. This change also required us to use Java non-blocking I/O (NIO) library which is different from the traditional java.io package used in the default IIOP implementation. The second change we implemented to control cross-interference is to use socket buffer sizing for each client to achieve the desired isolation (as defined by a higher-level policy). In our experimentation the policy is to maintain the same throughput regardless of presence of other concurrent traffic [108]. When evaluating the performance of RMI vs. I-RMI we should keep in mind the implementation differences between the two (single threaded vs. multi-threaded and Java IO libraries vs. Java NIO libraries). A good way of assessing I-RMI benefits would be to compare the performance of I-RMI itself before and after activating the enforcement mechanisms. In our first experiment we show cross talk effect on request rates (Figure 14). The graph shows request rate (in requests/second) for a client sending a constant stream of 32KB messages, where each message is sent as 16 IIOP fragments over the wire. At T=5000 ms we started another stream of 2KB (1 IIOP fragment per request) messages from another client and ran it till T=10000. The impact on the first client’s throughput is a drop of almost
45
2000 1800
Request rate (r/s)
1600 1400 1200 1000 800 600 400 200 0
0
2000
4000
6000
8000
10000
12000
14000
16000
Time (ms)
Figure 14: Request rate measured for a standard RMI-IIOP server 35%. We next show the effect of inserting an isolation point that controls socket buffer sizes (Figure 15). The isolation point periodically evaluates average request size per connection and adjusts socket buffer sizes to neutralize the cross talk effect. For the same conditions described above we notice almost no degradation in client 1’s request throughput. Similar results were obtained for clients with 16KB to 64KB message streams. The slight increase in throughput when isolation points are in effect can be attributed to using larger socket buffer size and fewer number of system calls to read the data from underlying OS buffers. We note here that 16KB messages are common. In the Trade benchmark, reply messages for a request to check a client portfolio return a list of stocks in the portfolio along with other related information. A portfolio with 6 stocks is returned in an 8KB reply message. The last experiment we show here measures the overhead imposed by our isolation point. We compared the throughput with our isolation point enabled to that with the isolation point code disabled; both implementations used the non-blocking I/O library. The results are shown in Figure 16. The overhead is mainly in the code for measuring average
46
2000 1800
Request rate (r/s)
1600 1400 1200 1000 800 600 400 200 0
0
2000
4000
6000
8000
10000
12000
14000
16000
Time (ms)
Figure 15: Request rate for an I-RMI server message rate and average fragments per request on each channel. Despite this code being in the critical path, a implementation of it fundamentally results in overheads in the range of only 2 - 4%. Request rate was measured by running the client and server for 15 seconds and counting the number of requests finished from T=7 to T=12. 5.5.2
Remote APIs Isolation Point
Consider the abstract distributed application shown in Figure 17. The external source injects events into the system, by sending messages to a primary server where they are queued for processing. A worker thread selects messages from the queue and sends them to the secondary server. The primary server also provides auxiliary services to an external client. The external event source generates a 512KB message every 10ms. A client makes repeated requests to the server; each request carries a return parameter of 1MB; the server caches the 1MB object and uses it to serve all client requests. A simple J2EE-based implementation of this application exhibits the average round trip times for the client listed in Table 4. In the first case, ‘Unloaded’, the secondary server runs with a very light load. Under these conditions, the average queue length is under 3 units, and the client average RTT is 35
47
4.50% 4.00%
Overhead %
3.50% 3.00% 2.50% 2.00% 1.50% 1.00% 0.50% 0.00%
4K
8K
16K
32K
64K
Msg Size (bytes)
Figure 16: Overhead of using buffer right-sizing to control cross talk in RMI-IIOP External event source
Primary server
Secondary server
Client
Figure 17: Abstract view of nodes in an operational information system (OIS) ms/call. The second scenario, ‘Stress Load’, imposes a heavy workload on the secondary server. We use the stress utility to run 8 CPU intensive threads. This results in a significant drop in the ability of the secondary server to process its requests and subsequently, creates queue buildup on the primary server. Because of this buildup, available free memory drops on the primary server and garbage collection is triggered more often (JVM memory was set to max. to 120MB). This causes an increase in client average RTT to 80ms/call and a 56% drop in throughput (see Figure 19). These can be attributed to increased garbage collection on the primary server (see Table 3) due to memory pressure resulting from queue buildup. Two observations may be made about this example. First, there is an observable indirect effect of one path of the system on another, seemingly unrelated path. Performance isolation must deal with such indirect effects. Second, the resources to be monitored to detect effects like these are not trivially identified. For instance, monitoring the server’s 48
Table 2: Average round trip time for client calls Scenario Average RTT [from client side] Unloaded secondary server 35 ms/call Secondary server stress loaded 80 ms/call Secondary server stress loaded + Primary server uses I-RMI 35 ms/call
Table 3: Number of times primary server garbage collects per 100 client calls Scenario GC Unloaded secondary server 6 Secondary server stress loaded 102 9 8
Garbage Collection
7 6 5 4 3 2 1 0
0
5
10
Time (secs)
15
20
25
Figure 18: Garbage collection at Primary Server
input rate
outgoing rate
70
Rate of calls (calls/window)
60
50
40
30
20
10
0
0
5
10
15
20
25
Time (secs)
Figure 19: Call rates measured at the primary server
49
local resources does not serve as a good predictor. This is because by the time we observe the high garbage collection activity on the primary server, queues have already built up and corrective measures are no longer easy to apply. A more appropriate method is to monitor the remote machine. Specifically, by detecting activity on the remote machine that will likely cause slow response times, it is possible to proactively divert any high volume traffic or traffic with large in-memory buffers. Modern service-based applications are subject to a wide variety of inter-machine dependencies and therefore, potential side effects caused by such dependencies. This is because servicing a logically single request will typically involve multiple, blocking (RPC-style) calls to remote machines along with the buffering of state necessary to complete those calls. A simple example in a hospital application of which we are aware is the evaluation of a patient’s medical x-rays results, which requires several calls to retrieve the original x-ray image plus any annotations added by the treating doctors. The x-ray image is the final product, but associated state of considerable size has to be buffered in memory until all annotations are retrieved from remote systems and added to the image. The effect of buffering such large amounts of intermediate state in internal system memory can lead to undesirable side effects like those exposed in this section’s example. It can also cause the client/path slowdown due to garbage collection depicted in Figure 18.
5.6
Summary
In this chapter we presented the detailed design of I-RMI, a modified version of RMIIIOP with three sample isolation points. Experimentation with Websphere and the Trade benchmark demonstrate the utility of our approach in limiting a 35% drop in throughput resulting from client cross talk, and also eliminating a 56% drop in call rate resulting from queue buildups due to a slow end point. The local API isolation point was discussed in more details in [84].
50
CHAPTER VI
I-QUEUE: SMART QUEUES FOR SERVICE MANAGEMENT
In this chapter we present techniques and their middleware implementation for automatically managing requests streams directed at server applications subjected to dynamic data updates, the goal being to improve application reliability in face of evolving feature sets and business data. I-Queue demonstrate a 16% improvement in server utility in lab results based on traces from Worldspan’s ePricing engine.
6.1
Introduction
The complexity of modern enterprise systems and applications is causing renewed interest in ways to make them more reliable. Platform virtualization [20] and automated resource monitoring and management [14, 63] are system-level contributions to this domain. Middleware developers have introduced new functionality like automated configuration management [113, 112, 106], improved operator interfaces like Tivoli’s ‘dashboards’ [61], automated methods for performance understanding and display [24], and new methods for limiting the potential effects of failures [104, 84]. Large efforts like IBM’s Autonomic Computing and HP’s Adaptive Enterprise initiatives are developing ways to automate complex management or configuration tasks, creating new management standards ranging from Common Base Events for representing monitoring information [63] to means for stating application-level policies or component requirements (e.g. WSLA[71]). Finally, applications often relax their reliability requirements, to avoid the potentially high costs of maintaining or preserving state for restarts or recovery, an early example being the BASE vs. ACID requirements formulated for search engines [45]. We try to address service failures in distributed applications. The failure model used is
51
typical for distributed enterprise applications like web services, where ‘failures’ are not direct or immediate system or application crashes, but cause atypical or unusual application behaviors captured by distributed monitoring techniques[34, 46]. Examples include returns of empty or insufficient responses, partially correct results, performance degradation causing direct or increasingly probable violations of delay guarantees specified by SLAs, and others. In the peer-to-peer literature, researchers are using such behaviors to build or maintain distributed trust models [69], in order to avoid using untrustworthy machines or network links. Focusing on enterprise systems with reliable hardware infrastructure but potentially unreliable software, we investigate ways in which they can deal with unusual behaviors and eventually, failures caused by single or sequences of application requests, which we term poison request sequences. The specific example studied is a global distribution system (GDS) that does transaction processing for the travel industry. To summarize, our assumption is that even with extensive testing applied to modern enterprise applications, it is difficult, if not impossible, to ensure their correct operations under different conditions. This is not only because of the undue costs involved with testing such systems under all possible input sequences and application states, but also because the effects of poison message sequences can expose hidden faults that depend both on the sequence of input messages and on changes in system state or application databases. Examples of the latter include regular business data updates, evolving application databases, and system resources that are subject to dynamic limitations like available virtual memory, communication buffers, etc. The particular problem we consider here is poison requests or request sequences arriving at a server system. These sequences lead to corrupted internal states that can result in server crash, erroneous results, degraded performance, or failure to meet SLAs for some or all client requests. To identify such sequences, we monitor each single server, its request
52
sequences and responses, and its resource behavior. Monitoring results are used to dynamically build a library of sequence patterns that cause server failures. These techniques use dynamic pattern matching to detect poison sequences. While failure detection uses general methods, the techniques we use for failure prevention exploit application semantics. As with solutions used to improve the performance of 3-tier web service infrastructures [67], we simply interpose a request scheduler between clients and server. In contrast to earlier work on load balancing [67], however, the purpose of our scheduler is to detect a potentially harmful request sequence and then change it to prevent the failure from occurring or at least delay its occurrence, thereby improving total system uptime. An example of a prevention method is to shuffle requests or change request order to defer (or eliminate) an imminent server crash. The idea is to apply dynamically different request shuffling methods within some time window, to prevent a failure or to at least, opportunistically defer it, thereby reducing the total time spent on system recovery or reboot. More detailed examples are discussed in Section 6.4. Our motivation and experimental evaluation are based on a server complex operated by Worldspan, which is a leading GDS and the global leader in Web-based travel e-commerce. Poison message sequences and their performance effects were observed in a major application upgrade undertaken by the company in 2005, after a one man-year development effort for which its typical internal testing processes were used. The failures observed were degraded system performance resulting from certain message sequences, but system dynamics and concurrency made it difficult to reproduce identical conditions in the lab and identify the exact sequence and resource conditions that caused the problem. The current workaround being used is similar to the micro-reboot methods described in [27]. The experimental presented in this chapter constitutes a rigorous attempt to deal with problems like these, using requests, business software, and request patterns made available to our group by this industry partner. A concrete outcome of our research is the I-Queue request management architecture and software implementation. I-Queue monitors a stream of incoming
53
Web Service requests, identifies potential poison message sequences, and then proactively manages the incoming message queue to prevent or delay the occurrence of undesired behaviors caused by such sequences. The I-Queue solution goes beyond addressing the specific server-based problem outlined above, for multiple reasons. First, I-Queue is another element of the more general solution for performance and behavior isolation for distributed enterprise applications described in [84]. The basic idea of that solution is to embed performance monitoring and associated management functionality into key interfaces of modern enterprise middleware: (1) component interfaces, (2) communication substrates like RMI, and (3) middleware-system interfaces. Here, I-Queue is the messaging analogue of our earlier work on I-RMI [84]. Second, I-Queue solutions can be applied to any 3-tier web service infrastructure that actively manages its requests, an example being the popular RUBiS benchmark for which other research has developed request queuing and management solutions to better balance workloads across multiple backend servers. In that context, however, I-Queue’s dynamic sequence detection methods would be embedded into specific end servers or into queues targeting certain servers rather than into the general workload balancing queue containing all requests in the system. Otherwise, substantial overheads might result from the need to sort requests by target server ID. Third, I-Queue solutions can be applied to request- or message-based systems, examples of the latter including event-based or publish-subscribe systems [77] or messaging infrastructures [110, 117]. In Section 2, we present the scenario that motivated this work. In Section 3, we describe the system architecture and details of the system design. Section 4 gives an overview of the sample application used in evaluation. We list the experimental results in Section 5 and survey related work in Section 6. We finally conclude in Section 7 with closing remarks and future research directions.
54
Client 1
Client 2 Client 3
Message queue
Clearinghouse (CW)
GDS Airlines
Figure 20: General overview of message flows in travel reservation systems
6.2
Motivating Scenario
Figure 20 shows an overview of the major components of Worldspan’s distributed enterprise applications and systems. The airlines publish their fares, rules and availability information to clearing warehouses (CW). The CW in turn publishes the updates to several GDSs. The GDS implements several services which for a given travel itinerary searches for the lowest available fare across multiple airlines. It is estimated that the size of fare and pricing database at Worldspan, is currently at 10GB and is expected to increase by approximately 20% over the next few years. Worldspan receives an average of 11.5 million queries per day with contractual agreements to generate a reply within a predetermined amount of time. The high message volume coupled with constantly changing system state creates a real need for monitoring and reliability middleware that can learn the dynamically changing performance characteristics and adapt accordingly.
6.3
System Architecture
I-Queue uses a simple monitor-analyze-actuate loop similar to those described in previous adaptive and autonomic computing literature [90, 55]. Our contribution is adding a higher level analysis module that monitors message traffic and learns the message sequences more likely to cause erratic behavior then apply application specific methods to prevent or reduce the likelihood of such problems. The monitoring component observes inputs and outputs
55
������������� # ������� ������������� � ������������� �� �� �� � ! "���
%'& ���� � �� � ����������� � (��� )��*+�,�-�� )�
� ������ � � � �� ��� �� � � ���� ��
3547698;:�@?�A�6CBD4
�� �1��20
. ����/ ) �0 ������������� � ������������� # �$� E5FG:GH�8!FGIJ? A�6KBL4
Figure 21: I-Queue System Architecture of the system. The analysis module in our system is the Learning Module (LM), which performs sensitivity analysis by correlating various system performance metrics and input message parameters. The goal of the Learning Module is to establish a set of parameter(s) that can act as good predictors for abnormal behaviors. The output is an internal model that can be used to predict performance behavior for incoming message streams. LM is modular and can use any machine learning algorithm suited for the problem at hand. This work experiments with algorithms that use Markov Models. The actuator component is the Queue Management Module (QMM). Using the internal performance model generated by LM, QMM prescans the incoming messages in a short window to see if they are likely to cause performance problems. If a suspicious sequence is detected, QMM takes an applicationspecific action to prevent this problem from occurring, or at least, to defer it. The action used here is to re-arrange the buffered messages to another sequence that is not known to cause performance problems, or that is known to cause fewer problems. Figure 21 shows an overview of the system architecture. 6.3.1
Internal Design
To demonstrate the value of I-Queue, we used Hidden Markov Models (HMMs) [102] to implement the LM. In our traces, each message is completely independent of other messages, and messages can be processed in any order without changing their semantics. During the learning phase, we construct transition matrices for each observed parameter(e.g.,
56
message size, internal message parameters, message inter-arrival time, ...). A transition matrix is a 2D matrix, for each message pair and a specific parameter, where the value of the parameter from the first message indicates the matrix column, and the value of the parameter from the second message indicates the matrix row. Analyzing message pairs leads to a first order model. For an N-order model, we check N + 1 messages, the concatenated parameter values from messages 1 to N indicate the column and the parameter value from message N + 1 indicate the row. To reduce matrix size, we use a codebook to convert parameter values to a numeric index. For multi-valued parameters (i.e., list parameters), we use a two level codebook, where the first level encodes each value in the array, then we combine the array values for a message in sorted order and use that for a lookup into the second level codebook. N-dimensional parameters can be dealt with using N + 1 levels of codebooks. We currently construct one transition matrix per parameter, but support for combinations of parameters can be added. For each message, we record all parameters as they arrive, and we observe system state after they are processed. If the system ends in a positive state, then we increment the corresponding cells in the transition matrices. If the server crashes or otherwise shows any performance misbehaviors, then we decrement the appropriate cells. During this training period, we also calculate a prediction error rate. This rate gives us an indication of the quality of a parameter as a predictor. It is calculated by counting the number of times the transition matrix for a certain parameter indicates strong likelihood of performance problems that do not actually occur (think of it as a false alarm rate). An example of a transition matrix is shown in Table 4. For our experiments, we use a second order Markov Model. The rows of the matrix are labeled with the codes from two consecutive messages, the columns are labeled with the message that follows in sequence. The cell values give us an indication of server behavior as it executes a particular sequence of messages. A positive value indicates good behavior, e.g., message sequence AAA (first row by first column) and the higher the value the better, e.g., AAA is more preferable than AAE (first row by fifth column). A negative value indicates strong likelihood of poor server
57
Table 4: A portion of the transition matrix from the resource leakage experiment A B C D E F ... AA 111 29 5 7 30 143 AB 17 26 2 5 7 9 AC 4 2 nil 2 2 12 AD 2 -2 -1 nil -1 5 ... BA 33 4 1 -1 3 36 BB 11 3 2 -2 4 15 BC 2 1 1 nil 1 -1 ... performance for a certain message sequence (e.g., ADB), the lower the negative value the worse. Sequences not observed in training are noted by a nil in the transition matrix. At the end of the training period, we choose the parameter with the least prediction error rate as our predictor (multiple parameters with relatively close error rates require human evaluation). To account for system initialization and warm up effects, we also construct a separate set of matrices for tracking the first N messages immediately following a system restart. At the end of the learning phase, we have a transition matrix that is fed to QMM. QMM evaluates the buffered messages before releasing a message to the head of the queue. The performance score is calculated by enumerating all possible orderings of the messages and for each ordering examine the message pairs and add the corresponding value from the transition matrix. A higher score indicates a sequence that is less likely to cause performance problems a low score indicates a sequence that is very likely to cause performance problems. The ordering with the highest score is chosen and the queue is ordered accordingly. QMM also performs this reordering after a server restart.
6.4
Experimental Results
In this section we demonstrate how I-Queue can be applied using two sample applications.
58
6.4.1
Using I-Queue to Improve Server Reliability
The goal of this example is to evaluate the I-Queue approach with simple failure models using realistic traces from Worldspan’s ePricing server. We constructed a sample application server and injected a small memory leak that is directly proportional to the size of the input message. Larger input messages are assumed to generate more work by the server which can lead to a larger leak. Memory leaks cause gradual degradation in server performance due to memory swapping and can eventually result in a server crash. To detect problems like these, the I-Queue prototype implements an early detection module to detect performance degradation early on. The module utilizes the Sequential Partial Probability Test (SPRT) statistical method for testing process mean and variance. The server model is reset when SPRT raises an alarm indicating performance degradation significant enough to be detected. Real-time SPRT was developed in the 1980s based on Wald’s original process control work back in 1947 [121]. SPRT features user-specified type I and type II error rates, optimal detection times, and applicability to processes with a wide range of noise distributions. SPRT has been applied in enterprise systems for hardware aging problems [30] and for other anomaly detection [50]. SPRT is also used for early fault detection in nuclear power plants [49]. Experiments are run in Georgia Tech’s enterprise computing laboratory, the model server was built in Java and run on an x345 IBM server(hostname: dagobah), a dual 2.8GHz Xeon machine with 4GB memory and 1GB/sNIC, running RedHat Linux kernel version 2.4.20. Sensitivity analysis and queue management code were also implemented in Java. Our first experiment concerns sensitivity analysis using Worldspan’s traffic traces. Figure 22 shows the results of our detection algorithm. The x-axis shows the different parameters we analyzed, the corresponding error rate is plotted on the y-axis. The error rate is a measure of the quality of a specific parameter as a predictor with lower error rates indicating a better predictor. As seen in the graph, the parameter MSG-SIZE has error rate of 0% which means it accurately predicts the failure 100% of the time. 59
Error Rate
1 0.9 0.8 0.7 0.6 0.5 0.4 0.3 0.2 0.1 0
0.869
0.371
0.323
0.218 0
MSG-SIZE
P-IA
P-LI
POFFREPLY-ON
P-PC
Parameter
Figure 22: Memory Leak Model: Sensitivity to various message parameters and message sizes In the second part of the experiment, we engage the queue management module to reorder the messages. Figure 23 (LEFT) shows the reduction in number of server restarts as a function of the buffer length in our managed queue. We observe here that we do not get a significant improvement with larger buffer sizes. Instead, a buffer size of five is sufficient for giving us adequate results. The training phase for our system involves running a batch of messages and observing the system behavior for them. A training set is composed of 460 messages and in the real server environment; a message typically takes 4-16 seconds to process. Thus, in the best-case scenario, we need 30 minutes to train the system (not counting the time needed to re-start the server). Given the cost of the learning phase of our system, we next evaluate the effectiveness of our algorithms for different training set sizes. Figure 23 (RIGHT) shows system improvement measured as average reduction in number of crashes on the y-axis versus number of training sets on the x-axis. The training sets are generated by random re-ordering of the original set. The reduction rate is measured by counting the number of server restarts for the original batch of messages with the managed vs. the unmanaged queue. It is a measure of the reduction in server faults we can achieve by using I-Queue, hence a higher reduction rate indicates more value in using I-Queue. The graph shows that we can get very good results with only a few training sets. This shows that I-Queue can be deployed with reasonable training time.
60
1 0.95
0.9 0.85
0.9 0.85
Training Set Size = 50
Reduction Rate
Reduction Rate
1 0.95
0.8 0.75 0.7 0.65 0.6 0.55 0.5
0
10
20
30
0.8 0.75 0.7 0.65 0.6 0.55 0.5
40
Queue Length
Queue Length = 5
50
150
250
350
Training Set Size
Figure 23: Memory Leak Model: Error reduction measured for different queue length settings(left) and for different training set sizes (right) 6.4.2
Using I-Queue to Improve System Utility
Our next example demonstrates the value of I-Queue in managing request streams in a complex system. The specific subsystem managed by I-Queue is Worldspan pricing query service. The service is handled by a farm of 1500 servers. Query messages from various clients are placed in one of two global queues. Each server in the farm acts independently of the others. As a server becomes available for processing, it pulls a message from the queue, processes the message, and generates a corresponding response message forwarded to other parts of the system for further processing. The request message contains a set of alternative itineraries for which the lowest available fare is to be found by the server. The response message contains a list of fares for each itinerary sorted by fare. All request messages are independent, and the server should maintain an average memory usage level when idle. We next present two algorithms that are the core of the I-Queue approach to improving behavior isolation for message-based applications. These algorithms provide two different implementations for message dispatching to a server farm, providing generic support for application-defined notions of message locality. The goal is to create management methods useful to a wide range of message-based applications. Methods are evaluated with data traces collected by the quality assurance group at Worldspan - over 1, 970 request messages. We initially executed these messages on the server to measure the response time for each message. The results are entered into a simulation developed to evaluate certain behaviors.
61
This is explained in more detail below. Experiments were conducted in Worldspan’s Atlanta offices using a production version of the ePricing server running on an IBM eServer hardware comparable to the machine configuration utilized in Worldspan’s server complex. 6.4.2.1
Message Locality through Active Pulling
In this approach, a server actively pulls a message from the queue as soon as it becomes available. In the degenerate case, a server always pulls the head of the queue. In this section we evaluate the performance of a server that searches the first MAX_SEARCH_DEPTH queries for one that geographically matches the last one it executed. Care must be taken not to starve queries at the front of the queue so we force the search algorithm to select the head of the queue regardless of match if the head was skipped before and was queued for more that T o seconds. The evaluation was performed using message traces obtained from Worldspan’s ePricing system. The requests were collected by the quality assurance team as a base line for testing new releases. Response time and number of results for each request were measure by running the sequence against a server identical to the farm servers. Care was taken to isolate the server from any data or code updates while collecting these measurements. The following results were obtained through simulating a farm with 10 servers. The message inter-arrival time was set to a very low value to simulate a farm under severe overload conditions. Listing 1: Active pulling with priority queue pseudo code
for (int i=0; i< MAX_SEARCH_DEPTH ; i++) { Request r = get_request_at (i); long delay = get_queue_delay ( request ); if ( geo_match (r, srv) || delay >= MAX_DELAY ) { dispatch (srv , r);
62
35
Geographical Match (%)
30
25
To=100ms To=200ms To=300ms To=400ms
20
15
10
5
0
0
1
2
3
4
5
6
7
8
9
Max. Search Depth
Figure 24: Effect of MAX_SEARCH_DEPTH on Geographic Match for different timeout values mark_skipped_queries_for_delay (i -1); return ; } } Request head = get_next_request (); dispatch (srv , head ); Figure 24 plots the average geographic match achieved at different MAX_SEARCH_DEPTH values. Figure 25 plots the average delay experienced by the query at the head of queue. 6.4.3
Message Locality Using Global Isolation Point
In this section we evaluate isolation points positioned at a more global level as opposed to individual servers. In this example the queue dispatcher chooses the server to process the next message based on the server state. The dispatcher attempts to improve the utility of the farm (geo utility in our example) by matching the query being dispatched to an idle server whose last execution matches this query.
63
3000
Avg. Delay (ms)
2500
2000
To=100ms To=200ms To=300ms
1500
1000
500
0
0
1
2
3
4
5
6
7
8
9
Max. Search Depth
Figure 25: Effect of MAX_SEARCH_DEPTH on average excess delay for query at head of queue for different timeout values
64
900
Max. Queue Length
800 700 600 500 400 300 200 100 0
10
15
20
25
30
Num Servers Figure 26: Max. queue length as a function of number of servers in the farm The following results were obtained by running a simulation using the same traces as in the preceding section. The number of servers was varied between 10 and 100. The message arrival pattern was assumed uniform with 500ms inter-arrival time. Figure 26 plots the maximum queue length against number of servers, each data point represents the maximum queue length observed over 20 runs with different message ordering. We note that for a farm with less than 28 servers we observe queuing delays. Figure 27 shows the measured geographical match as a percentage of all messages processed. The maximum match percentage is 97%, we calculated this value by sorting all messages according to their geographical code and counting the percentage of messages that matched their previous neighbor. as seen from the graph, we can obtain a match level of about 44% at 28 servers. Adding more servers to the farm does not necessarily improve queuing delays or response time but does increase the geo match percentage. We note here that Worldspan operate their farm at 50-60% utilization factor, that will translate to 56 servers in our simulation which gives us about 80% geo match percentage. The geo match obtained with no isolation points (baseline measurement) was 7-8%, which is the case of dispatching messages to any available server regardless of execution history.
65
120.00% Max. Geo Match
% Geo Match
100.00% 80.00%
Min. servers to meet SLA
60.00% 40.00%
Baseline
20.00% 0.00%
10
20
30
40
50
60
70
80
90
100
Num Servers Figure 27: Improved locality as a function of number of servers in the farm 6.4.3.1
Algorithm Comparison
First we note that a local isolation point, one at the local server level as described in the previous section, provides limited improvement in locality. Also, the improvement is sustained by the presence of more than one message in the queue to search through, an undesirable condition in the first place. In contrast, a global isolation point can produce significant improvement in utility under normal operating conditions. We note here that a global isolation point still needs the analysis information obtained from the local nodes. In this example we assumed all servers are identical and analysis from one server can be applied at a global level. We conclude that under the right conditions a global isolation point can provide much better utility/isolation compare to local isolation points.
6.5
Related Work
Our approach builds on established practice, in which machine learning techniques have been applied successfully to server and process monitoring. Application traces for detecting application faults are examined in [104, 81, 46, 65]. Bowring et al. uses similar methods
66
to classify software behavior based on program traces [25]. These studies use application traces to detect a problem as it occurs and to recover the system by restarting the whole or parts of the system. Our approach differs in that we use application-defined methods to interpose and reschedule the message stream to minimize the number of system restarts and hence, increase system utility. The parallel computing domain has an extensive body of work on reliability using various monitoring, failure prediction [78], and checkpointing techniques [32, 35]. Our work studies enterprise applications, specifically those in which system state is typically preserved in an external persistent storage (e.g., a relational database). In such systems, checkpointing the system state amounts to persisting the input event until it is reliably processed, and the cost of failures is dominated by process startup and initialization. In such environments, a reduction in the frequency of failures provides a tangible improvement to the system operators. Additionally, the dynamic models we build (including the failure predictor) can prove valuable to system programmers as they try to troubleshoot the source of failure.
6.6
Summary
We demonstrated a useful technique for automatically (1) detecting undesirable (i.e., poison) message sequences and then, (2) applying application-specific methods to achieve improved system performance and reliability. We anticipate having more complex behaviors corresponding to multiple failure models interrelated in non-linear ways. We plan to approach this problem by using some of the well-studied clustering techniques (e.g., K-means analysis) to isolate the different behaviors and then apply our methods to each one separately. Our longer term agenda is to use the monitoring and reliability techniques demonstrated here in the context of service-oriented architectures. We are particularly interested in dynamically composed systems where users can create ad-hoc flows such as
67
portal applications for high level decision support systems. In such systems, it is imperative to build middleware infrastructure to detect abnormal behaviors induced by certain component or service interactions and also, to impose ‘firewalls’ that can contain such behaviors and prevent them from further spreading into other parts of the system.
68
CHAPTER VII
RELATED WORK 7.1
The InfoSphere Project
The InfoSphere project [5] at Georgia Institue of Technology studied information flows in distributed systems with focus on creating system support for desired quality of information. The project covered several areas including program specialization [88], domainspecific languages [38], and personalized infromation filtering [80]. Similary we focus on quality of information metrics. However, our work specifically looks at methods implemented at the service provider or information producer to learn, detect, and contain any quality degradation. [23, 114]
7.2
Kernel Based Approaches
Performance isolation is not a new idea [20] and in addition, prior work has developed many methods for dealing with performance problems in server applications. The latter include request deletion in web servers [100], request prioritization or frame dropping in multi-media or real-time applications [111], and the creation of system-level constructs supporting these application-level actions [125][95]. Essentially, such methods are specific examples of the more general methods for dynamic system adaptation developed during the last decade [105][131]. They share with adaptive techniques the use of runtime system monitoring and of dynamically reacting to certain monitoring events, but they differ in that the policy-level decisions made in response to certain events are focused on limiting performance dependencies rather than on exploiting them to optimize the behavior of the distributed system exhibiting these dependencies. We advocate an isolation-based approach to performance management, but differ from
69
prior work in that we also consider performance dependencies that exist across different layers of abstraction existing in current systems, such as dependencies across systemlevel communication protocols and the middleware-level messaging systems that use them. The specific results attained for Java RMI-IIOP and J2EE-level method calls are related to earlier work done on the IQ-RUDP [57] data transport protocol, which coordinates middleware-level and transport-level adaptations to better meet application needs. What is new here, however, is that we consider explicit characteristics of the more complex Java middleware environments, including Java’s garbage collection techniques [11] and in addition we focus on quality of information based metrics.
7.3
Resource Accounting in J2EE Platforms
Hardware, kernel, and application-level protection and isolation have been studied extensively for single Java virtual machines [21][40][56]. Czajkowski and von Eiken report a resource accounting interface for Java in [41]. That thread of effort later produces a full system for isolating applications inside a JVM [40][56] at the granularity of isolates. These ideas are extended to J2EE platforms in [68]. Our work focuses on performance isolation at the single request granularity (even within the same application) and we identify three performance dependency points that are embedded in the middleware implementation of J2EE and WebSphere. Our framework places the detection logic in the middleware layer before a request starts execution, which enables us to use resource reservation approaches like those described in [68] or [3] as our enforcement mechanism, where thresholds can be set dynamically by our resource monitor. Similar degrees of isolation can be achieved by creating separate isolates for each class of requests; this comes at the expense of redundant installations of the same code. Some of the scenarios we present in this paper are not addressed by the isolate mechanism such as when the vulnerability point is in the lower levels of the middleware before the message is parsed and dispatched to its target application (isolate).
70
7.4
Component Based Performance Management
Diaconescu et.al describe methods for managing performance in component-based systems [43], focusing on performance management by monitoring performance of application level components and detecting runtime degradation due to changes in operating environments and workload. Their solution is to dynamically substitute the ill-behaving component with a redundant one the can offer better performance under the current loads. I-RMI focuses on preventing the spread of ill-behaving components of a distributed system. The two approaches complement each other, as one can provide alternative application components to provide better performance for applications, and the other acts as a second line of defense to prevent the spread of performance problems if they do occur.
7.5
Complementary Technologies
Several projects are currently in progress for developing policy-based approaches for defining service compositions in Web Services and Service Oriented Architecture environments, including BPEL, WS-Policy and WS-C. [115] highlights the need to combine all of these orthogonal features to support production workflows for web services, where such policies can be used for monitoring and steering of business applications [29] and scientific applications [51]. Our middleware solution seeks to provide the ’enabling’ low-level components necessary to achieve such high-level business-driven policies, similar to the work presented in infokernel.
7.6
Path Discovery Techniques
Discovering causal relationships between messages in a distributed system has been studied before. Chen et.al in [34] used data mining techniques to uncover correct (non faulty) request paths in a system from traces obtained by tagging the requests as they flow through the system. Similarly, Aguilera et.al [16] used techniques borrowed from signal processed to discover such relations in RPC systems to identify components causing performance
71
bottlenecks. These two approaches study the message causality (service paths) at the component level, which we consider a horizontal slice. On a different note, [12] is trying to extract the service path of a request from the point it enters the system and all related low-level OS/Kernel activity related to such request both on the caller and callee sides. We can think of this as a vertical slice through the system. We expect the final form of our work to use a combination of the above two approaches. Causal relationships between components can help us detect situations similar to those in the Slow Client cited in our I-RMI work. Interdependencies between application level logic and low-level kernel resources is needed to identify cases where coupling at the kernel level (and below) occurs between logically separate component entities. While the above approaches focused on explicitly stating the causal relations we expect our approach to focus on detecting only the causalities that result in performance dependencies.
72
CHAPTER VIII
DISCUSSION AND CONCLUDING REMARKS
In this chapter we present a general discussion of this research; we follow with a list of contributions made and conclude with notes on open questions and possible opportunities building on this research.
8.1
Threats to Validity
8.1.1
Sample Applications
Initial evaluations of I-Queue methods used simple application models combined with industrial traces. The results were encouraging and demonstrated the utility of I-Queue in applications of behavior isolation, particularly reliability and performance isolation. Further evaluations used Worldspan’s e-Pricing server with traces obtained from their Quality Assurance group. We acknowledge here the sample of applications used in our evaluations was limited. This is because of the difficulty of getting access to production server farms and the lack of similar applications available to the academic community. Our only defense for this limited sample size is that the e-Pricing architecture is representative of a wide class of enterprise applications that are currently deployed as mission critical applications. 8.1.2
Workloads
Our evaluations of I-Queue were based on message traces obtained from Worldspan, L.P. The traces represent several thousand request messages that are collected by their Quality Assurance group and used regularly during system and integration testing. These traces do not capture dynamic behaviors related to user actions (e.g., message inter-arrival times or queue lengths). One underlying assumption was that we examined the I-Queue methods for servers under high load conditions where such measures are irrelevant, a phenomenon we
73
are observing in other industrial workloads. This assumption limits the results obtained to environments with similar workload characteristics. Evaluations under different workload conditions can be the topic of future research. 8.1.3
General Discussion
In this thesis we aimed to provide robust performance in distributed systems using local decision and performance analysis to understand abnormal or undesired runtime behavior and contain it. Experimentation shows the validity of this approach in representative enterprise applications. However, we note here that our approach is limited, obviously, to cases where making local decisions can actually mitigate the undesired behaviors. In cases where such localized actions are insufficient, we would need to revert to other techniques that attempt to stabilize the system, including those that require solving a global optimization problem.
8.2
Summary of Research Contributions
The main contribution of this research is Isolation Points, a software abstraction for behavior isolation in enterprise server systems. We presented two concrete uses of I-points: I(solation)-RMI and I(solation)-Queues. I-RMI demonstrates the utility of Isolation Points in server systems built on the J2EE framework, focusing on request/reply call interactions. I-Queue deals with message oriented systems. The utility of these implementations was validated by a set of experiments using sample applications and a set of simulations utilizing realistic traces from the industry. The second contribution is demonstrating how approaches like ours can be used for purposes other than performance robustness, by showing how Quality of Information in a business setting can be controlled through system level parameters. In the course of our research we interviewed various IT professionals and managers from Delta Technology and Worldspan. We obtained detailed specification of their internal applications architectures as well as anonymized traffic traces. The examples in this dissertation are based on these architectures and traces and we believe they can be used by other 74
researchers to validate their ideas; we consider these ‘benchmarks’ a valuable contribution to the systems research community.
8.3
Future Directions
This research spurs many opportunities for future research. A major hurdle we faced with our research with isolation points is locating the right interfaces for implementing an isolation point. Our manual approach consisted of first identifying metrics for measuring quality of information, locating the implementation causing QoS or QoI degradation, and then making code modifications to insert the right logic for containing these behaviors. Imminent research should focus on understanding emergent and dynamic behaviors using already established methods such as machine learning and data mining techniques, or perhaps devise new appropriate methods. White-box techniques such as [91, 92] were used successfully to facilitate program debugging and prevent some forms of attacks [53]. It is worth investigating how program instrumentation and runtime monitoring [33] can be used for linking observed program behaviors to specific program localities. Our component and behavior models are built on the assumption that we can monitor any metrics that we believe can affect the component’s behavior. Recent research [74, 52] demonstrated that performance interference does occur even in systems running on virtual machines (e.g. Xen). Our basic assumptions do not hold in such environments and more research is needed to extend the utility of isolation points to virtualized domains. In this work we advocated an online approach for constructing component behavior models. An alternate approach worth investigating is analyzing application and machine trace logs. Our experience with industrial applications is that application traces can range dramatically in level of details, even among components within the same application. This variation can be due to technologies used in building the application component or development budget and resources for a particular component. Also, some organizations still think it is impractical to maintain detailed machine level logs due to overheads associated
75
with data collection and storage space needed (see [119] for possible ways to overcome these problems). Recent work [66] proposed using flow-based analysis methods to locate bottlenecks or faulty nodes in a distributed system. More research is needed to link quality of information metrics to such analysis methods and isolation points could provide such mechanism. A potential area for investigating the utility of isolation points is the area of trusted computing. Recent work [109] demonstrated how to create trusted applications from legacy codes by placing data that is subject to trust restrictions (e.g., encoded with WS-security) in isolated trusted modules. We are interested in the possibility of associating trust models with trust points to monitor the trustworthiness of a component and redirect data flow to different components dynamically.
76
REFERENCES
[1] “Aristotle research group:
JABA: Java architecture for bytecode analy-
sis.” http://www.cc.gatech.edu/aristotle/Tools/jaba.html.
[online;
viewed:10/04/2004]. [2] “HP: Virtual server environment - overview.” http://h71028.www7.hp.com/ enterprise/cache/258348-0-0-0-121.html. [online; viewed:10/29/2006]. [3] “IBM: Websphere application server v5.1.x: Logical pool distribution (LPD).” http://publib.boulder.ibm.com/infocenter/ws51help/index.jsp? topic=/com.ibm.websphere.base.doc/info/aes/ae/corb_lpd.html. [online; viewed:8/24/2005]. [4] “IBM: Websphere software.” http://www.ibm.com/software/websphere. [online; viewed:8/24/2006]. [5] “The
infosphere
project.”
http://www.cc.gatech.edu/projects/
infosphere. [online; viewed:12/2/2006]. [6] “Microsoft:
Windows
virtual
server.”
http://www.microsoft.com/
windowsserversystem/virtualserver/default.mspx.
[online;
viewed:10/29/2006]. [7] “Sun microsystems: Java RMI over IIOP.” http://java.sun.com/products/ rmi-iiop/. [online; viewed:11/04/2006]. [8] “Liferay:
Open source enterprise portal.” http://www.liferay.com/cms/
servlet/PRODUCTS-PORTAL, 2005.
77
[9] “Sun microsystems: Java 2 platform, enterprise edition (EE).” http://java.sun. com/j2ee/, 2005. [10] A-E-M, M., G, G. R., G, G. R., R, M. K., and W, J. J., “Fault-scalable byzantine fault-tolerant services,” in SOSP ’05: Proceedings of the twentieth ACM symposium on Operating systems principles, (New York, NY, USA), pp. 59–74, ACM Press, 2005. [11] A, S. E. and R, G. A., “Garbage collecting the internet: a survey of distributed garbage collection,” ACM Computing Surveys, vol. 30, no. 3, pp. 330– 373, 1998. [12] A, S., A, F., S, K., and M, J., “E2EProf: Automated end-to-end performance management for enterprise systems,” in 37th Annual IEEE/IFIP International Conference on Dependable Systems and Networks (DSN 2007), 2007. [13] A, S., C, Y., M, D., and S, K., “QMON: QoS- and utilityaware monitoring in enterprise systems,” in Proceedings of the 3rd International Conference on Autonomic Computing (ICAC’06), pp. 124–133, IEEE Computer Society, 2006. [14] A, S., P, C., K, J., S, K., and W, M., “System-level resource monitoring in high-performance computing environments,” Journal of Grid Computing, vol. 1, no. 3, pp. 273 – 289, 2003. [15] A, S. and S, K., “Sysprof: Online distributed behavior diagnosis through fine-grain system monitoring,” in 26th IEEE International Conference on Distributed Computing Systems (ICDCS 2006), p. 8, IEEE Computer Society, 2006. [16] A, M. K., M, J. C., W, J. L., R, P., and M, A., “Performance debugging for distributed systems of black boxes,” in Proceedings 78
of the 19th ACM Symposium on Operating Systems Principles (SOSP 2003), (Bolton Landing, NY), pp. 74–89, October 2003. [17] A, J., O, M., M, D. Y., D, B., and F, K., “An adaptive load balancing scheme for web servers,” International Journal Network Management, vol. 12, no. 1, pp. 3–39, 2002. [18] B, G., D, P., and M, J. C., “Resource containers: a new facility for resource management in server systems,” in Proceedings of the third symposium on Operating systems design and implementation (OSDI’99), (Berkeley, CA, USA), pp. 45–58, USENIX Association, 1999. [19] B, T., G, J., and S, D., “Microsoft terraserver: a spatial data warehouse,” in SIGMOD ’00: Proceedings of the 2000 ACM SIGMOD international conference on Management of data, (New York, NY, USA), pp. 307–318, ACM Press, 2000. [20] B, P. T., D, B., F, K., H, S., H, T. L., H, A., N, R., P, I., and W, A., “Xen and the art of virtualization,” in Proceedings of the 19th ACM Symposium on Operating Systems Principles (SOSP 2003), (Bolton Landing, NY), pp. 164–177, October 2003. [21] B, P., L, D., and T, F., “Towards a resource-safe Java for service guarantees in uncooperative environments,” in Proceedings of the IEEE Workshop on Programming Languages for Real-Time Industrial Applications, (Madrid, Spain), pp. 101–111, 1998. [22] B, S., C, C., M, A.-F. L., and P, C., “Automatic specialization of protocol stacks,” in 29th Annual IEEE Conference on Local Computer Networks (LCN 2004), (Tampa, FL, USA), pp. 152–159, IEEE Computer Society, 2004.
79
[23] B, A. P., H, J., K, R., W, J., and P, C., “Infopipes: An abstraction for multimedia streaming.,” Multimedia Syst., vol. 8, no. 5, pp. 406–419, 2002. [24] B, P., F, G., B, L., L, H., C, G., P, K., T, G., H, J., F, A., J, M. I., and P, D., “Combining visualization and statistical analysis to improve operator confidence and efficiency for failure detection and localization,” in ICAC ’05: Proceedings of the Second International Conference on Automatic Computing, (Washington, DC, USA), pp. 89–100, IEEE Computer Society, 2005. [25] B, J. F., R, J. M., and H, M. J., “Active learning for automatic classification of software behavior,” in ISSTA ’04: Proceedings of the 2004 ACM SIGSOFT international symposium on Software testing and analysis, (New York, NY, USA), pp. 195–205, ACM Press, 2004. [26] C, Z., E, G., P, C., S, K., and W, M., “Iq-services: Resource-aware middleware for heterogeneous applications,” in Proceedings of the 18th International Parallel and Distributed Processing Symposium (IPDPS 2004), (Santa Fe, New Mexico), IEEE Computer Society, April 2004. [27] C, G., C, J., and F, A., “Improving availability with recursive microreboots: a soft-state system case study,” Perform. Eval., vol. 56, no. 1-4, pp. 213–248, 2004. [28] C, V., C, E., C, M., and Y, P. S., “The state of the art in locally distributed web-server systems,” ACM Computing Surveys, vol. 34, no. 2, pp. 263–311, 2002.
80
[29] C, F., C, M., and S, M.-C., “Enterprise cockpit for business operation management,” in Proceedings of the 23rd International Conference on Conceptual Modeling (ER 2004) (A, P., C, W. W., L, H., Z, S., and L, T. W., eds.), vol. 3288 of Lecture Notes in Computer Science, (Shanghai, China), pp. 825–827, Springer, November 2004. [30] C, K. J., G, K. C., and M, A., “Advanced pattern recognition for detection of complex software aging phenomena in online transaction processing servers,” in DSN ’02: Proceedings of the 2002 International Conference on Dependable Systems and Networks, (Washington, DC, USA), pp. 478–482, IEEE Computer Society, 2002. [31] C, M., D, P., K, A.-M., N, A., R, A., and S, A., “Splitstream: high-bandwidth multicast in cooperative environments,” in SOSP ’03: Proceedings of the nineteenth ACM symposium on Operating systems principles, (New York, NY, USA), pp. 298–313, ACM Press, 2003. [32] C, K. M. and L, L., “Distributed snapshots: determining global states of distributed systems,” ACM Trans. Comput. Syst., vol. 3, no. 1, pp. 63–75, 1985. [33] C, A. and O, A., “A generic instrumentation framework for collecting dynamic information,” in Online Proceedings of the ISSTA Workshop on Empirical Research in Software Testing (WERST 2004), (Boston, MA, USA), july 2004. http://www.sce.carleton.ca/squall/WERST2004. [34] C, M., K, E., F, E., B, E., and F, A., “Pinpoint: Problem determination in large, dynamic, internet services,” in Proceedings of the International Conference on Dependable Systems and Networks (IPDS Track), (Washington D.C.), 2002.
81
[35] C, E. and G, E., “Optimal strategies for scheduling checkpoints and preventative maintenance,” IEEE Trans. Reliability, vol. 39, no. 1, pp. 9–18, 1990. [36] C, I., C, J. S., G, M., K, T., and S, J., “Correlating instrumentation data to system states: A building block for automated diagnosis and control.,” in 6th Symposium on Operating System Design and Implementation (OSDI 2004), (San Francisco, California, USA), pp. 231–244, USENIX Association, 2004. [37] C, I., Z, S., G, M., S, J., K, T., and F, A., “Capturing, indexing, clustering, and retrieving system history,” in SOSP ’05: Proceedings of the twentieth ACM symposium on Operating systems principles, (New York, NY, USA), pp. 105–118, ACM Press, 2005. [38] C, C., H, H., Réè, L., S, L., Y, H., and P, C., “Spidle: a DSL approach to specifying streaming applications,” in GPCE ’03: Proceedings of the 2nd international conference on Generative programming and component engineering, (Erfurt, Germany), pp. 1–17, Springer-Verlag New York, Inc., 2003. [39] C, C., C, S., W, J., and P, C., “Adaptive methods for distributed video presentation,” ACM Computing Surveys, vol. 27, no. 4, pp. 580–583, 1995. [40] C, G., “Application isolation in the Javatm virtual machine,” in Proceedings of the 2000 ACM SIGPLAN Conference on Object-Oriented Programming Systems, Languages& Applications (OOPSLA 2000), (Minneapolis, Minnesota), pp. 354–366, October 2000. [41] C, G. and E, T., “JRes: A resource accounting interface for Java,” in Proceedings of the 1998 ACM SIGPLAN Conference on Object-Oriented Programming Systems, Languages & Applications (OOPSLA ’98), (Vancouver, British Columbia, Canada), pp. 21–35, october 1998. 82
[42] L, B., “Virtualization of linux based computers: The linux-vserver project,” in HPCS ’05: Proceedings of the 19th International Symposium on High Performance Computing Systems and Applications, (Washington, DC, USA), pp. 340–346, IEEE Computer Society, 2005. [43] D, A., M, A., and M, J., “Automatic performance management in component based software systems,” in Proceedings of the 1st International Conference on Autonomic Computing (ICAC 2004), (New York, NY), pp. 214–221, IEEE Computer Society, May 2004. [44] D, C., “Adaptive applications and QoS guaranties (invited paper),” in Proceedings of the International Conference on Multimedia Networking, MmNet ’95, (Aizu, Japan), IEEE-CS Press, September 1995. [45] F, A., G, S. D., C, Y., B, E. A., and G, P., “Clusterbased scalable network services,” in SOSP ’97: Proceedings of the sixteenth ACM symposium on Operating systems principles, (New York, NY, USA), pp. 78–91, ACM Press, 1997. [46] F, A., K, E., and P, D., “Combining statistical monitoring and predictable recovery for self-management,” in WOSS ’04: Proceedings of the 1st ACM SIGSOFT workshop on Self-managed systems, (New York, NY, USA), pp. 49–53, ACM Press, 2004. [47] G, A. and S, K., “CHAOSarc: kernel support for multiweight objects, invocations, and atomicity in real-time multiprocessor applications,” ACM Transactions Computer Systems, vol. 11, no. 1, pp. 33–72, 1993. [48] G, J., “Why do computers stop and what can be done about it?,” Tech. Rep. TR.85.7, Tandem, Jun 1985.
83
[49] G, K. C. and H, K., “Sequential probability ratio tests for nuclear plant component surveillance,” in Nuclear Technology, pp. 93–131, 1991. [50] G, K. C., L, W., and H, D., “Time-series investigation of anomalous CRC error patterns in fiber channel arbitrated loops.,” in ICMLA (W, M. A., A, H. R., C, K. J., H, K., and K, G., eds.), pp. 211–215, CSREA Press, 2002. [51] G, W., E, G., S, K., and V, J. S., “Falcon: On-line monitoring and steering of parallel programs,” Concurrency: Practice and Experience, vol. 10, no. 9, pp. 699–736, 1988. [52] G, D., C, L., G, R., and V, A., “Enforcing performance isolation across virtual machines in xen.,” in Proceddings of the ACM/IFIP/USENIX 7th International Middleware Conference (Middleware 2006) ( S, M. and H, M., eds.), vol. 4290 of Lecture Notes in Computer Science, (Melbourne, Australia), pp. 342–362, Springer, 2006. [53] H, W. and O, A., Malware Detection, vol. 27 of Advances in Information Security, ch. Detection and Prevention of SQL Injection Attacks. Springer, 2007. [54] H, G., P, M. L., and M, J. G., “Subcontract: a flexible base for distributed programming,” in SOSP ’93: Proceedings of the fourteenth ACM symposium on Operating systems principles, (New York, NY, USA), pp. 69–79, ACM Press, 1993. [55] H, J. E., W, I., C, D. M., and K, J. O., “An architectural approach to autonomic computing,” in Proceedings of the First International Conference on Autonomic Computing (ICAC’04), (Washington, DC, USA), pp. 2–9, IEEE Computer Society, 2004.
84
[56] H, C., C, C.-C., C, G., H, D., and E, T., “Implementing multiple protection domains in Java,” in Proceedings of the 1998 USENIX Annual Technical Conference, (New Orleans, LA), pp. 259–270, June 1998. [57] H, Q. and S, K., “IQ-RUDP: Coordinating application adaptation with network transport,” in Proceedings of the 11th IEEE International Symposium on High Performance Distributed Computing (HPDC-11 2002), (Edinburgh, Scotland, UK), pp. 369–378, IEEE Computer Society, July 2002. [58] H, M. E., “User-mode linux,” Linux J., vol. 2006, no. 145, p. 2, 2006. [59] HP L, “Statistical learning, inference and control (SLIC).” http://www.hpl. hp.com/research/slic/index.html. [online; viewed:8/24/2006]. [60] IBM, “IBM enterprise workload manager.” http://www.ibm.com/systems/ virtualization/systemsdirector/ewlm/. [online; viewed:2/2/2007]. [61] IBM, “IBM Tivoli monitoring.” http://www.ibm.com/software/tivoli/ products/monitor/. [online; viewed: 5/24/2006]. [62] IBM, “Overview of ARM instrumentation for IBM Tivoli Monitoring for Transaction Performance.” http://publib.boulder.ibm.com/tividd/td/ITMFTP/ SC32-9412-00/en_US/HTML/arm14.htm. [online; viewed:2/2/2007]. [63] IBM,
“Common
base
event.”
http://www.ibm.com/developerworks/
library/specification/ws-cbe/, 2003. [online; viewed:5/24/2006]. [64] J, J., P, C., S, K., W, M., and B, N., “dproc - extensible run-time resource monitoring for cluster applications,” in Proceedings of the International Conference on Computational Science-Part II (ICCS 02), (London, UK), pp. 894–903, Springer-Verlag, 2002.
85
[65] J, G., C, H., U, C., and Y, K., “Multi-resolution abnormal trace detection using varied-length n-grams and automata,” in ICAC ’05: Proceedings of the Second International Conference on Automatic Computing, (Washington, DC, USA), pp. 111–122, IEEE Computer Society, 2005. [66] J, G., C, H., and Y, K., “Modeling and tracking of transaction flow dynamics for fault detection in complex systems,” IEEE Transactions on Dependable and Secure Computing, vol. 3, no. 4, pp. 312–326, 2006. [67] J, W., C, J. S., and K, J., “Interposed proportional sharing for a storage service utility,” in Proceedings of the joint international conference on Measurement and modeling of computer systems, pp. 37–48, ACM Press, June 2004. [68] J, M. J., C, G., K, K., and S, G., “Extending a J2EEtm server with dynamic and flexible resource management,” in Proceedings ACM/IFIP/USENIX International Middleware Conference (Middleware 2004), vol. 3231 of Lecture Notes in Computer Science, (Toronto, Canada), pp. 439–458, Springer, October 2004. [69] J, S., A, M., and X, J. J., “Robust information dissemination in uncooperative environments,” in Proceedings of the 25th IEEE International Conference on Distributed Computing Systems (ICDCS’05), (Washington, DC, USA), pp. 293–302, IEEE Computer Society, 2005. [70] J, G., S, G. S., P, J., P, C., and S, A., “Detecting bottleneck in n-tier IT applications through analysis,” in Large Scale Management of Distributed Systems, 17th IFIP/IEEE International Workshop on Distributed Systems: Operations and Management, DSOM 2006 (S, R., M, S., O’S, D., and P, T., eds.), vol. 4269 of Lecture Notes in Computer Science, (Dublin, Ireland), pp. 149–160, Springer, 2006.
86
[71] K, A. and L, H., “The WSLA framework: Specifying and monitoring service level agreements for web services,” J. Netw. Syst. Manage., vol. 11, no. 1, pp. 57–81, 2003. [72] K, G., “Aspect-oriented programming,” ACM Comput. Surv., vol. 28, no. 4es, p. 154, 1996. [73] K, G., H, E., H, J., K, M., P, J., and G, W. G., “An overview of AspectJ,” Lecture Notes in Computer Science, vol. 2072, pp. 327– 355, 2001. [74] K, Y., K, R., B, P., B, M., W, Z., and P, C., “An analysis of performance interference effects in virtual environments,” in 2007 IEEE International Symposium on Performance Analysis of Systems and Software, (San Jose, California, USA), 2007. [75] K, Y., P, C., B, S., and C, C., “Efficient packet processing in userlevel OS: A study of UML,” in Proceedings of the 31th IEEE Conference on Local Computer Networks (LCN06), 2006. [76] K, B. and W, C. E., “Improving web performance by client characterization driven server adaptation,” in WWW ’02: Proceedings of the 11th international conference on World Wide Web, (New York, NY, USA), pp. 305–316, ACM Press, 2002. [77] K, V., C, Z., C, B. F., E, G., S, K., M, M. S., S, B., and W, P., “IFLOW: Resource-aware overlays for composing and managing distributed information flows,” in Proceedings of ACM SIGOPS EUROSYS’2006, (Leuven, Belgium), April 2006. [78] L, Y. and L, Z., “Exploit failure prediction for adaptive fault-tolerance in cluster computing,” in Proceedings of the Sixth IEEE International Symposium on Cluster 87
Computing and the Grid (CCGRID’06), (Los Alamitos, CA, USA), pp. 531–538, IEEE Computer Society, 2006. [79] L, C., M, M., and C, D. W., “Performance monitoring in a myrinetconnected SHRIMP cluster,” in Proceedings of the SIGMETRICS symposium on Parallel and distributed tools (SPDT 98), (New York, NY, USA), pp. 21–29, ACM Press, 1998. [80] L, L., P, C., S, K., and W, J., “Infofilter: supporting quality of service for fresh information delivery,” New Gen. Comput., vol. 18, no. 4, pp. 305–321, 2000. [81] L, G., C, J., and S, P., “Quickly finding known software problems via automated symptom matching,” in ICAC ’05: Proceedings of the Second International Conference on Automatic Computing, (Washington, DC, USA), pp. 101–110, IEEE Computer Society, 2005. [82] L, B., M, N., K, R., G, T., and S, P., “Design, implementation, and evaluation of the remos network monitoring system,” Journal of Grid Computing, vol. 1, no. 1, pp. 75–93, 2003. [83] L, J. P., S, R. E., Z, J. A., and B, D. E., “Specifying and measuring quality of service in distributed object systems,” in ISORC ’98: Proceedings of the The 1st IEEE International Symposium on Object-Oriented Real-Time Distributed Computing, (Washington, DC, USA), p. 43, IEEE Computer Society, 1998. [84] M, M. S. and S, K., “I-RMI: Performance isolation in information flow applications,” in Proceedings ACM/IFIP/USENIX 6th International Middleware Conference (Middleware 2005) (A, G., ed.), vol. 3790 of Lecture Notes in Computer Science, (Grenoble, France), Springer, 2005.
88
[85] M, M. S. and S, K., “Persistent residual increase in server processing time,” Tech. Rep. GIT-CERCS-06-13, CERCS, Oct 2006. [86] M, M. S., S, K., and A, S., “I-Queue: Smart queues for service management,” in Proceedings of the 4th International Conference on Service Oriented Computing (ICSOC 06), Lecture Notes in Computer Science, (Chicago, USA), Springer, 2006. [87] M, M. S., W, M., and S, K., “Streamgen: A workload generation tool for distributed information flow applications,” in Proceedings of the 33rd International Conference on Parallel Processing (ICPP 2004), (Montreal, Quebec, Canada), pp. 55–62, IEEE Computer Society, August 2004. [88] MN, D., W, J., P, C., C, C., K, C., G, A., W, P., C, C., M, G., and M, R., “Specialization tools and techniques for systematic optimization of system software,” ACM Trans. Comput. Syst., vol. 19, no. 2, pp. 217–251, 2001. [89] N, B. D., S, M., N, D., T, J. E., F, J., and W, K. R., “Agile application-aware adaptation for mobility,” in Proceedings of the sixteenth ACM symposium on Operating systems principles (SOSP ’97), (New York, NY, USA), pp. 276–287, ACM Press, 1997. [90] O, P., G, M., T, R., H, D., J, G., M, N., Q, A., R, D., and W, A., “An architecture-based approach to selfadaptive software,” IEEE Intelligent Systems, vol. 14, pp. 54–62, May/June 1999 1999. [91] O, A., J, S., B, M., and Z, A., “Isolating relevant Component Interactions with JINSI,” in Proceedings of the Fourth International ICSE Workshop on Dynamic Analysis (WODA 2006), (Shanghai, China), pp. 3–9, May 2006. 89
[92] O, A. and K, B., “Selective Capture and Replay of Program Executions,” in Proceedings of the Third International ICSE Workshop on Dynamic Analysis (WODA 2005), (St. Louis, MO, USA), pp. 29–35, may 2005. [93] P, J., J, G., S, G., P, C., and S, A., “Comparison of performance analysis approaches for bottleneck detection in multi-tier enterprise applications,” in IEEE International Workshop on Quality of Service, 2006. [94] P, B. and S, K., “dQUOB: Managing large data flows using dynamic embedded queries,” in HPDC ’00: Proceedings of the Ninth IEEE International Symposium on High Performance Distributed Computing (HPDC’00), (Washington, DC, USA), p. 263, IEEE Computer Society, 2000. [95] P, C., S, K., W, R., G, I., B, N., and L, G., “Flexible user/kernel communication for real-time applications in Elinux,” in Proceedings of the Workshop on Real Time Operating Systems and Applications and Second Real Time Linux Workshop (in conjunction with RTSS 2000), (Orlando, FL), November 2000. [96] P, M. L. and M, B. P., “Process migration in DEMOS/MP,” in SOSP ’83: Proceedings of the ninth ACM symposium on Operating systems principles, (New York, NY, USA), pp. 110–119, ACM Press, 1983. [97] P, R., G, M., and C, I., “Short term performance forecasting in enterprise systems,” in KDD ’05: Proceeding of the eleventh ACM SIGKDD international conference on Knowledge discovery in data mining, (New York, NY, USA), pp. 801–807, ACM Press, 2005.
90
[98] P, D. and T, A., “Solaris zones: Operating system support for consolidating commercial workloads,” in LISA ’04: Proceedings of the 18th USENIX conference on System administration, (Berkeley, CA, USA), pp. 241–254, USENIX Association, 2004. [99] P, T. A. J., “BCEL: The byte code engineering library.” http://jakarta. apache.org/bcel/. [online; viewed:10/04/2004]. [100] P, N. and L, C., “Scalable network I/O in Linux,” in USENIX Annual Technical Conference, FREENIX Track, (San Diego, CA), pp. 109–120, June 2000. [101] P, I., S, D. C., and C, R., “Techniques for enhancing real-time corba quality of service,” Proceedings of the IEEE, vol. 91, no. 7, pp. 1070–1085, 2003. [102] R, L. R., “A tutorial on hidden markov models and selected applications in speech recognition,” Proceedings of the IEEE, vol. 77, no. 2, pp. 257–286, 1989. [103] R, L., S, A., S, J., and S, S., “Cauldron: A policy-based design tool,” in 7th IEEE International Workshop on Policies for Distributed Systems and Networks (POLICY 2006), (London, Ontario, Canada), pp. 113–122, IEEE Computer Society, 2006. [104] R, C. and C, G., “Implementing large-scale autonomic server monitoring using process query systems,” in ICAC ’05: Proceedings of the Second International Conference on Automatic Computing, (Washington, DC, USA), pp. 123–133, IEEE Computer Society, 2005. [105] R, D., S, K., and Y, S., “Fara: A framework for adaptive resource allocation in complex real-time systems,” in Proceedings of the Fourth IEEE Real-Time Technology and Applications Symposium (RTAS 98), (Washington, DC, USA), pp. 79–84, IEEE Computer Society, 1998. 91
[106] S, A., P, C., J, G., W, Q., Y, W., and S, G. S., “Towards automated deployment of built-to-order systems.,” in Ambient Networks, 16th IFIP/IEEE International Workshop on Distributed Systems: Operations and Management, DSOM 2005 (S¨¨, J. and S, J., eds.), vol. 3775 of Lecture Notes in Computer Science, (Barcelona, Spain), pp. 109–120, Springer, 2005. [107] S, S. R., Towards dynamic adaptation of I/O scheduling in commodity operating systems. PhD thesis. [108] S, S. R. and T, P. J., “Fairness and performance isolation: an analysis of disk scheduling algorithms,” in International Workshop on High Performance I/O Techniques and Deployment of Very Large Scale I/O Systems (HiperIO ’06) In conjunction with CLUSTER 2006 The 2006 IEEE International Conference on Cluster Computing, (Barcelona, Spain), 2006. [109] S, L., P, C., H, H., and H, C., “Reducing TCB complexity for security-sensitive applications: Three case studies,” in Proceedings of ACM SIGOPS EUROSYS’2006, (Leuven, Belgium), April 2006. [110] S M, “Java message service (JMS).” http://java.sun.com/ products/jms/. [online; viewed: 5/24/2006]. [111] S, V., C, A., G, P., S, P., S, J., and V, H., “Application performance in the QLinux multimedia operating system,” in Proceedings of the eighth ACM international conference on Multimedia (MULTIMEDIA 00), (New York, NY, USA), pp. 127–136, ACM Press, 2000. [112] S, G. S., J, G., P, C., and S, A., “Automated staging for built-to-order application systems,” in Proceedings of the 2006 IFIP/IEEE Network Operations and Management Symposium (NOMS 2006), (Vancouver, Canada), 2006.
92
[113] S, G. S., P, C., J, G., Y, W., K, Y., W, Q., C, C., S, A., and M, K., “Clearwater: extensible, flexible, modular code generation.,” pp. 144–153, 2005. [114] S, G. S., P, C., and M, K., “Infopipes: Concepts and isg implementation.,” in 2nd IEEE Workshop on Software Technologies for Future Embedded and Ubiquitous Systems (WSTFEUS 2004), (Vienna, Austria), pp. 19–23, IEEE Computer Society, 2004. [115] T, S., K, R., and M, T. A., “Composition of coordinated web services,” in Proceedings ACM/IFIP/USENIX International Middleware Conference (Middleware 2004), vol. 3231 of Lecture Notes in Computer Science, (Toronto, Canada), pp. 294–310, Springer, October 2004. [116] T, D. L., “Layered multiplexing considered harmful,” in Protocols for High-Speed Networks I, pp. 143–148, Elsevier Science Publishers, May 1989. [117] T, “Tibco Rendezvous.” http://www.tibco.com/software/messaging/ rendezvous.jsp. [online; viewed: 5/24/2006]. [118] U, P., P, S., and C, K., “Building a resources monitoring system for smile beowulf cluster,” in Proceeding of the Third International Conference/Exhibition on High Performance Computing in Asia-Pacific Region (HPC ASIA’99), 1998. [119] V, C., K, E., D, B., W, Y.-M., R, R., L, S., and L, J., “Analyzing persistent state interactions to improve state management.,” in Proceedings of the Joint International Conference on Measurement and Modeling of Computer Systems (SIGMETRICS/Performance 2006) (M, R. A., K, P. B., and S, E., eds.), (Saint Malo, France), pp. 363–364, ACM, 2006.
93
[120] V K, M S. M, B. M. J. M. and S, K., “Policies for enterprise information systems: Two case studies,” in submitted to IM 07, 2007. [121] W, A., Sequential Analysis. NY: John Wiley & Sons, 1947. [122] W, C. A., “Memory resource management in VMware ESX server,” SIGOPS Oper. Syst. Rev., vol. 36, no. SI, pp. 181–194, 2002. [123] W, J. and P, C., “Tocttou vulnerabilities in unix-style file systems: An anatomical study.,” in Proceedings of the FAST ’05 Conference on File and Storage Technologies, (San Francisco, California, USA), USENIX, 2005. [124] W, M., C, D., and B, E., “Seda: an architecture for wellconditioned, scalable internet services,” in SOSP ’01: Proceedings of the eighteenth ACM symposium on Operating systems principles, (New York, NY, USA), pp. 230– 243, ACM Press, 2001. [125] W, R. and S, K., “Dynamic window-constrained scheduling for multimedia applications,” in Proceedings of the IEEE International Conference on Multimedia Computing and Systems, Volume II (ICMCS 1999), (Florence, Italy), pp. 87–91, IEEE Computer Society, June 1999. [126] W, A., S, M., and G, S. D., “Scale and performance in the Denali isolation kernel,” SIGOPS Oper. Syst. Rev., vol. 36, no. SI, pp. 195–209, 2002. [127] W, Y., S, K., and W, P., “Efficient end to end data exchange using configurable compression,” SIGOPS Oper. Syst. Rev., vol. 39, no. 3, pp. 4–23, 2005. [128] W, M., C, Z., H, W., and S, K., “SmartPointers: personalized scientific data portals in your hand,” in Proceedings of the 2002 ACM/IEEE conference on Supercomputing (SC ’02), (Los Alamitos, CA, USA), pp. 1–16, IEEE Computer Society Press, 2002.
94
[129] W, A., R, R., and W, J., “A distributed object model for the Java system,” in 2nd Conference on Object-Oriented Technologies & Systems (COOTS 96), pp. 219–232, USENIX Association, 1996. [130] W, Q., P, C., S, A., and B, R., “Dependency categorization and optimization on synchronization modeling in business processes,” in Proceedings of the IEEE 2007 International Conference on Data Engineering (ICDE’07), (Istanbul, Turkey), 2007. [131] Y, W. and N, K., “Process group management in cross-layer adaptation,” in Proceedings of SPIE/ACM Multimedia Computing and Networking Conference (MMCN’04), (Santa Clara, CA), pp. 55–68, January 2004. [132] Z, S., C, I., S, J., and F, A., “Ensembles of models for automated diagnosis of system performance problems,” in Proceedings of the 2005 International Conference on Dependable Systems and Networks (DSN’05), (Washington, DC, USA), pp. 644–653, IEEE Computer Society, 2005.
95
VITA
Mohamed Mansour was born in Cairo, Egypt on May 1968. In May 1991 he obtained a B.Sc. in Electronics and Communications from Ain Shams University and an M.Sc. in Engineering Math and Computer Science from University of Louisville in 1995. Mohamed worked as programmer analyst, system analyst, and team lead in several companies before attending Georgia Institute of Technology from 2002 to 2007 to work on his Ph.D. under the auspieces of Professor Karsten Schwan.
96