energies Article
Study of Unwanted Emissions in the CENELEC-A Band Generated by Distributed Energy Resources and Their Influence over Narrow Band Power Line Communications Noelia Uribe-Pérez 1, *, Itziar Angulo 2 , Luis Hernández-Callejo 3 , Txetxu Arzuaga 4 , David de la Vega 2 and Amaia Arrinda 2 1 2
3 4
*
Centre for the Development of Renewable Energy Sources—Research Centre for Energy, Environment and Technology (CEDER—CIEMAT), 42290 Lubia, Spain Department of Communications Engineering, ETSI Bilbao, University of the Basque Country (UPV/EHU), 48013 Bilbao, Spain;
[email protected] (I.A.);
[email protected] (D.d.l.V.);
[email protected] (A.A.) Department of Agricultural Engineering and Forestry, University of Valladolid (UVA), 42004 Soria, Spain;
[email protected] ZIV LV Products, CG Automation BU, 48170 Zamudio, Spain;
[email protected] Correspondence:
[email protected]; Tel.: +34-97-5281-013 (ext. 105)
Academic Editor: Josep M. Guerrero Received: 27 September 2016; Accepted: 18 November 2016; Published: 30 November 2016
Abstract: Distributed Energy Resources might have a severe influence on Power Line Communications, as they can generate interfering signals and high frequency emissions or supraharmonics that may cause loss of metering and control data. In this paper, the influence of various energy resources on Narrowband Power Line Communications is described and analyzed through several test measurements performed in a real microgrid. Accordingly, the paper describes the effects on smart metering communications through the Medium Access Control (MAC) layer analysis. Results show that the switching frequency of inverters and the presence of battery chargers are remarkable sources of disturbance in low voltage distribution networks. In this sense, the results presented can contribute to efforts towards standardization and normative of emissions at higher frequencies higher, such as CENELEC EN 50160 and IEC/TS 62749. Keywords: Distributed Energy Resources; meter reading; microgrids; Narrow-Band Power Line Communications; noise
1. Introduction With the increasing development of the Distributed Generation (DG) and Distributed Storage (DS), the role of Distributed Energy Resources (DERs) is taking more relevance. DERs are considered key agents in the shift towards upcoming electricity paradigms such as Smart Grids (SGs) and microgrids. Additionally, Power Line Communications (PLC) is one of the most spread technologies for data transmission in smart metering systems [1]. In fact, most installations in Europe and China use this technology due its lower cost compared to alternative wireless solutions and faster deployment since the communication channel is already installed [2]. Despite the very promising features of PLC for the SG, they can be highly affected if strong disturbances are present in the transmission channel [3]. These disturbances must be characterized in order to both identify potential impact situations and to develop strategies that overcome the communications impairments. Power inverters, due to the high amplitude spurious signals within a wide frequency band that are generated in the switching process, are one of the Low Voltage (LV) Energies 2016, 9, 1007; doi:10.3390/en9121007
www.mdpi.com/journal/energies
Energies 2016, 9, 1007
2 of 24
grid elements that must be considered [4]. Also battery chargers, pumps and turbines’ influence must be addressed since their electrical nature might affect PLC [5]. In this paper the influence of noise and spurious signals within the 2 to 150 kHz frequency range generated by DERs on the performance of Narrowband Power Line Communications NB-PLC in a microgrid environment is tackled. For this purpose, the potential effects of the noise generated by several energy sources on the quality of NB-PLC are analysed through a measurement campaign performed in a real microgrid with an integrated smart metering system based on PoweRline Intelligent Metering Evolution (PRIME). The main spurious and noise sources are identified in the obtained spectra and their influence in the NB PLC subnetwork topology is addressed. The work also includes an analysis of the MAC frames involved in the subnetwork set up and data transmission. Finally, the document presents the main conclusions and contributions of the work. The document is organized as follows: Section 2 describes the actual concerns regarding supraharmonics as well as their influence over PLC, highlighting the importance of addressing them within the context of microgrids. Section 3 describes the main features of PRIME. Section 4 presents the measurement setup and methodology employed and describes the tests carried out for this work. Section 5 includes the results and analysis obtained from the aforementioned measurements for each of the considered DERs operating alone while Section 6 includes the results and analysis from the measurements performed for each of the devices operating in a real microgrid, with the rest of surrounding DERs operating as well. Finally, Section 7 discusses the obtained results and contributions and Section 8 summarizes the main conclusions from this work. 2. Disturbances Introduced by Distributed Energy Resources in Power Line Communications PLC technology uses the electrical grid for data transmission. NB-PLC is typically used for smart metering, control and home-area services and it operates in the frequency range from 3 to 500 kHz [6]. NB-PLC is regulated by CENELEC standard in Europe, and specifically CENELEC-A band (3–95 kHz) has been planned for utilities. Examples of NB-PLC technologies are ITU-T G.hnem, IEEE 1901.2, PRIME and G3. Non-intended or spurious emissions in the frequency band from several kHz to hundreds of kHz, also referred to as “supraharmonics”, are attracting the attention of the scientific community. As highlighted in [5], different types of electrical equipment are showing high emissions in the frequency range below 150 kHz and are to be considered as potential for electromagnetic interferences to other electrical equipment, including PLC systems. Within supraharmonics range, emissions driven by a certain device are known as “primary emission” while the emission generated by other devices are considered “secondary emission” [7]. The importance of these high-frequency emissions is reflected in the creation of several working groups in the main international associations and standardization committees, such as CIGRE/CIRED joined group C4.24, IEEE EMC Society TC 7 and CENELEC SC205A, among others [8]. On one hand, the interest in distortion in the considered frequency range is due to an increasing number of sources of emission, including energy-efficient lighting and generation (such as DERs) and some other electrical equipment within the LV sector of the electricity distribution network [9–12]. In fact, the switching frequency of the converters present in much grid-connected equipment is commonly within the 2–150 kHz range [4]. This situation directly affects to upcoming electricity paradigms, such as SGs and microgrids, which will encounter more problems in the 2–150 kHz range due to the increasing number of renewable energy resources, and demand for energy efficiency; increasing capacitive behavior of the loads and an unavoidable need for communications. This in turn translates into more switching power converters, increasing higher frequency current due to low impedance of the loads and increasing use of communication technologies, respectively [13]. Some interesting works about supraharmonics can be found in the literature. While [14] presents a study of the waveform distortion in the LV network and includes some field measurements for indoor lighting devices, [15,16] assess the emission of domestic installations and LED lamps up to 150 kHz.
Energies 2016, 9, 1007
3 of 24
Regarding DERs, the disturbances generated by Photovoltaic (PV) inverters in higher frequencies have been tackled in literature [17,18] as well as simulated [19] and field-measured [20]. Some researches regarding wind turbine harmonic emissions in the higher frequency can be also found in [21,22] and the emission of high frequency harmonics caused by electrical vehicle charging is addressed in [23]. Additionally, [24] provides a review of standards and technical reports as well as some laboratory measurements regarding emissions and immunity within the smart metering context in the 2–150 kHz range. Finally, some other publications address detected problems of high frequency harmonics in public LV distribution grids, such as [25–27]. On the other hand, another reason of concern is the potential influence and consequences of high frequency emissions over PLC systems [28–31]. In fact, the noise model in PLC is more complex than in other traditional communication systems, since it consists of coloured broadband noise, narrowband interference and different types of impulsive noise [32]. A general overview of the performance of PLC in electrical networks can be seen in [33,34]. While a wide amount of studies dealing with the influence of emissions in PLC focus on domestic devices [35,36], also analyses of PLC disturbances in electrical vehicles can be found in literature [37]. Finally, [38] includes several simulations of the suitability of PLC for smart metering under different noise conditions. Regarding DERs, their negative influence in PLC may be higher, due to distributed location of these devices, in many cases close to the homes or even within the home of the prosumers, and therefore, close to the smart meters. Nevertheless, it has been barely addressed and more empirical tests are needed; as an example, studies of the influence of some other DERs such as hydropower systems or battery charges in PLC have not been found in the literature. This effect becomes crucial in microgrids, where DERs are located near the PLC equipment, and moreover, data provided by smart meters is important for the proper management of the power balance between generation, storage and consumption. To that end, this work focuses on the influence of DERs over NB-PLC in a real microgrid, with an emphasis on the empirical approach to this topic. In this sense, the results presented here are a valuable contribution regarding the actual efforts towards standardization and normative of emissions at frequencies higher than harmonics, such as CENELEC EN 50160 and IEC/TS 62749 [8]. 3. PoweRline Intelligent Metering Evolution The NB-PLC technology deployed in the microgrid that is analysed in this work is PRIME v1.3.6, which uses the frequency band from 41.992 to 88.867 kHz. Its key features are described below. PRIME employs several techniques to overcome channel disturbances. In the physical layer it uses Orthogonal Frequency-Division Multiplexing (OFDM) modulation and coding techniques, while the MAC layer is based on the automatic reconfiguration of the network. 3.1. Physical Layer OFDM is known by its good performance against frequency selective interferences. When it is combined with Forward Error Correction (FEC) coding, data transmission can face adverse channel impairments and noise scenarios. The FEC mechanism consists of a convolutional encoder together with a block interleaver. Additionally, other techniques such as limiting the amplitude of the incoming time samples or enhancing the correction capabilities of a Viterbi decoder by interleaving bits among several OFDM symbols instead of interleaving over one symbol increase the performance of PRIME under impulsive noise environments [39]. 3.2. Medium Access Control Layer PRIME devices are disposed in a tree structure where two types of nodes are possible: Base Node (BN), which acts as a master node of the subnetwork and is in charge of all the resources and connections; and Service Node (SN), which keeps connectivity to the subnetwork and switches the data of other nodes to propagate connectivity, if required. While BNs are embedded in the Data
Energies 2016, 9, 1007
4 of 24
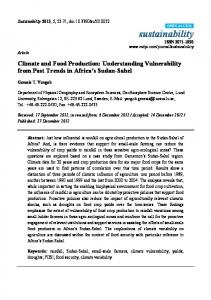
Concentrators (DCs), the SNs are included in the Smart Meters (SMs). SNs can have three functional statesEnergies [40], 2016, as Figure 9, 1007 1 shows: 4 of 24
• • •
Disconnected: it isitthe initial state, arenot notable abletotocommunicate communicate or switch • Disconnected: is the initial state,ininwhich which SNs SNs are or switch data.data. Terminal: where SNs are able to establish connections and transmit data, but not to switch the data • Terminal: where SNs are able to establish connections and transmit data, but not to switch the datanodes. of other nodes. of other • Switch: in this state SNs areable abletotoforward forward data other nodes within the subnetwork. Switch: in this state SNs are datatotoand andfrom from other nodes within the subnetwork. Additionally, they keep all terminal state functions. Additionally, they keep all terminal state functions.
Figure 1. Different states of of thethe SNs SNrepresentation representation varies according its role: yellow Figure 1. Different states SNsininPRIME. PRIME. The The SN varies according its role: yellow diamond for switch, green triangle for terminal and empty triangle for disconnected. diamond for switch, green triangle for terminal and empty triangle for disconnected.
PRIME tackle noise promotingnodes nodes to to switch the communication capabilities of PRIME can can tackle noise byby promoting switchstate. state.If If the communication capabilities of a SN are affected by noise disturbances, the BN can decide to promote a neighbor SN from terminal a SN are affected by noise disturbances, the BN can decide to promote a neighbor SN from terminal to to switch state in order to ensure the communication between the affected SN and the BN. switch state in order to ensure the communication between the affected SN and the BN. The evolution of the topology of a PRIME subnetwork can be obtained in the form of log files, The evolution of the topology of a PRIME subnetwork can be obtained in the form of log files, which also provide information regarding the coverage of each SN. The coverage indicates the which also provide information regarding the coverage each Thethecoverage indicates the probability P of a successful communication between the BNof and a SNSN. within same subnetwork. probability of these a successful communication between the BN and a SN within the The BNPsets values, which are quantified from 1 to 6 with the criteria specified insame Table subnetwork. 1. It can The BN sets these as values, are quantified from 1 to with the criteria specified indownlink. Table 1. It can be considered a jointwhich evaluation of the performance of 6 the communications uplink and be considered as a joint evaluation of the performance of the communications uplink and downlink. Table 1. Probability P of a successful communication between the BN and a SN within the same and itsPcorresponding coverage value. Tablesubnetwork 1. Probability of a successful communication between the BN and a SN within the same
subnetwork and its corresponding coverage value. Coverage Value
1 Coverage 2 Value 13 24 3 45 56 6
Probability P 0 < P < 0.5 Probability 0.5 < P < 0.75P 0 0.5 0.75