Benchmarks
Quantifying chromatin accessibility of individual gene family members by combining ligation-mediated PCR with real-time PCR Celia R. Espinoza and Ann J. Feeney The Scripps Research Institute, La Jolla, CA, USA BioTechniques 41:404-408 (October 2006) doi 10.2144/000112263
The eukaryotic genome in the nucleus is compacted into a highly complex structure known as chromatin, which is an important component in the control of gene transcription. One of the first events required for gene expression is the remodeling of chromatin into an accessible state. Chromatin remodeling associated with gene activation can be measured by evaluating the accessibility of intact nuclei to micrococcal nuclease (1) or restriction endonuclease enzymes. Restriction endonuclease assays involve the treatment of nuclei with a restriction enzyme, followed by detection of chromatin cleavage by Southern blot hybridization (2), direct real-time PCR (3) or ligation-mediated PCR (LM-PCR) (4). The main limitation of the first two detection approaches is the requirement of higher numbers of cells; while LM-PCR overcomes that problem, it is poorly quantifiable. Furthermore, none of these techniques have originally been conceived to measure the differential accessibility of individual members of a multigene family. Changes in chromatin accessibility in one gene member from a multigene VH immunoglobulin family had been previously performed by using LMPCR and Southern blot analysis (5). In that work, data were quantitated by comparing band intensities. Here we tested whether chromatin accessibility of individual members of a highly homologous gene family could be efficiently measured by combining LM-PCR with real-time PCR. We chose the immunoglobulin VHS107 family because its three functional members have very different 404 ı BioTechniques ı www.biotechniques.com
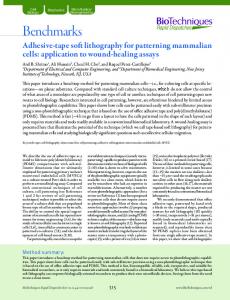
rearrangement frequencies, with V1 rearranging five times more than V11, and V13 rearranging forty times less frequently than V1 (6). Furthermore, we previously demonstrated a positive correlation between the extent of the association with acetylated histones and relative rearrangement frequency within the VHS107 family (7). Based on those observations and the fact that gene rearrangement in the immune system is preceded by increased chromatin accessibility (8), we considered the VHS107 family an ideal model to evaluate the efficacy of our assay. We tested our approach in freshly isolated mouse pro-B cells, where the VHS107 family actively rearranges. We took advantage of the existence of a shared NlaIII restriction site downstream of the recombination signal sequence (RSS) in all three VHS107 family members (Figure 1A). Intact nuclei were prepared according to Hempel and Ferrier (9) with some minor modifications (see the supplementary material available online at www.BioTechniques.com). Approximately 106 nuclei were treated with 0, 2, or 10 U NlaIII at 37°C for 10 min. After overnight incubation in 2× DNA extraction buffer, DNA was recovered by phenol/chloroform/ isoamylalcohol extraction and overnight isopropanol precipitation. DNA was then dissolved in 1× Tris EDTA (TE), and the concentration was measured by PicoGreen® (Invitrogen, Carlsbad, CA, USA). First-strand synthesis was performed on 200 ng using the forward family-specific primer V107-5′, which evenly picks up all three family members, followed
by overnight ligation of the unidirectional BW linker (3) at 17°C (Table 1). Linker-ligated DNA samples were recovered by overnight isopropanol precipitation, followed by resuspension in 1× TE. Half of the sample volume was used in a first round of PCR using the V107-5′ and BW3 primers (18 cycles). DNA quantification was performed using PicoGreen, and all samples were diluted to 25 pg/μL in 1× TE. Fifty picograms of each sample were used to perform real-time PCR with SYBR® Green. In this step, gene-specific forward primers were used—each of them paired with the BW3 primer, which is complementary not only to the unidirectional BW linker, but also to the last two base pairs of the firststrand synthesized product (Figure 1B). The amount of product generated is proportional to the amount of digestion occurring across the regions amplified for the primers. Thus, if the region under study has an increased accessibility and hence increased digestion, more PCR product will be generated, which in real-time PCR is reflected by a lower number of amplification cycles.
A
NlaIII
B
Nuclei Isolation and NlaIII Digestion V107-5�
First-Strand Synthesis
� Linker
LinkerLigation
V107-5�
V1-5�
BW3
LM-PCR (18 cycles)
V11-5� V13-5� V107co-5�
BW3
Real-Time PCR with Gene Specific Primers
Figure 1. Combined use of ligation-mediated PCR (LM-PCR) with real-time PCR for quantifying chromatin accessibility of individual gene family members. (A) Representation of the VHS107 coding region (dark gray) showing the location of the recombination signal sequence (RSS; black) and the NlaIII restriction enzyme site. (B) Step by step strategy used to measure chromatin accessibility. Vol. 41 ı No. 4 ı 2006
Benchmarks
406 ı BioTechniques ı www.biotechniques.com
Table 1. Oligonucleotides Used in Chromatin Accessibility Assays Uni-linker
Sequences
BW1
5′-GCGGTGACCCGGGAGATCTGAATTC-3′
BW2
5′-GAATTCAGATC-3′
First-Strand Synthesis, LM-PCR, and Real-Time PCR V107-5′
5′-TGGGTCCGCCAGCCTCCAG-3′
BW3
5′-CCGGGAGATCTGAATTCTG-3′
V1-5′
5′-AGACTGGAGTGGATTGCTGCAAG-3′
V11-5′
5′-AGGCACTTGAGTGGTTGGGTTTT-3′
V13-5′
5′-CAGCCTCCAGGGAAGTCACC-3′
V107co-5′
5′-AACAGAGTAYAGTGCATC-3′
LM-PCR, ligation-mediated PCR.
assay allows the use of a small amount of sample and is both sensitive and quantitative. Furthermore, by considering the primer efficiency differences in the final calculation, the quantification is more accurate as opposed to simply measuring and comparing individual CT values. ACKNOWLEDGMENTS
We thank R. Rouse, J. Carey, J. Lamoureux and S. Salerno for comments on the manuscript. This work was supported by a grant from the National Institutes of Health (no. RO1 AI 52313). COMPETING INTERESTS STATEMENT
5. Chowdhury, D. and R. Sen. 2003. Transient IL-7/IL-7R signaling provides a mechanism for feedback inhibition of immunoglobulin heavy chain gene rearrangements. Immunity 18:229-241. 6. Love, V.A., G. Lugo, D. Merz, and A.J. Feeney. 2000. Individual VH promoters vary in strength, but the frequency of rearrangement of those VH genes does not correlate with promoter strength nor enhancer-independence. Mol. Immunol. 37:29-39. 7. Espinoza, C.R. and A.J. Feeney. 2005. The extent of histone acetylation correlates with the differential rearrangement frequency of individual VH genes in pro-B cells. J. Immunol. 175:6668-6675. 8. Yancopoulos, G.D. and F.W. Alt. 1985. Developmentally controlled and tissue-specific expression of unrearranged VH gene segments. Cell 40:271-281. 9. Hempel, W.M. and P. Ferrier. 2004. Restriction endonuclease accessibility as a determinant of altered chromatin structure. Methods Mol. Biol. 287:53-63.
The authors declare no competing interests.
1.50
REFERENCES
1.25
1. Graffmann, N., S. Santourlidis, J. Christ, P. Wernet, and M. Uhrberg. 2006. Direct and quantitative analysis of chromatin accessibility by MIRECAL-a Micrococcus nuclease/real-time PCR chromatin accessibility assay with locus specificity. Anal. Biochem. 354:308-310. 2. Jackson, D.A., J.C. McDowell, and A. Dean. 2003. Beta-globin locus control region HS2 and HS3 interact structurally and functionally. Nucleic Acids Res. 31:1180-1190. 3. Rao, S., E. Procko, and M.F. Shannon. 2001. Chromatin remodeling, measured by a novel real-time polymerase chain reaction assay, across the proximal promoter region of the IL-2 gene. J. Immunol. 167:4494-4503. 4. Mueller, P.R. and B. Wold. 1989. In vivo footprinting of a muscle specific enhancer by ligation mediated PCR. Science 246:780786.
Relative Accessibility
We included in our final calculations the differential amplification efficiency of each pair of primers. This is a critical step, because omitting this calculation could lead to a misinterpretation of the real-time PCR data. Therefore, after PCR using a genespecific forward primer and the BW3 reverse primer, the V1, V11, and V13 products were purified from agarose gels. The purified PCR products for V1, V11, and V13 were quantified for DNA concentration using PicoGreen. Samples were diluted to the same number of amplicon copies. Because there are differences in sizes between the V1, V11, and V13 PCR products, we considered it more appropriate to dilute samples based on the number of amplicon copies rather than on their DNA concentration. Amplicon copy calculations take into consideration both the fragment size and the mass of one amplicon molecule. As a practical test for PCR efficiency, we constructed a standard curve by using 10-fold dilutions of each PCR product (10,11). The quantification was made by SYBR Green real-time PCR. For normalization purposes, the whole product signal was measured by using a family-specific forward primer (V107co-5′) and the BW3 primer. After determination of the cycle threshold (CT) values for each primer combination (CTcom), the CT value from the whole product signal (CTp) was subtracted from CTcom (CTcom - CTp). The difference was named CT control. So, when differences in primer efficiency where taken into consideration, chromatin accessibility of individual gene family members were calculated as 2-(CT sample – CT control), where CT sample is the CT value for a specific gene, and CT control is the efficiency of the respective primer combination. Data are finally presented as relative to the chromatin accessibility of the V1 gene. We found that at very limiting conditions of enzyme concentration and incubation time, V1 had the highest accessibility over V11 and V13, which agrees with its highest rearrangement frequency in that family (Figure 2). In the present study, we have improved the quantification of chromatin accessibility of individual gene family members by combining LM-PCR with real-time PCR. Our
2 U NlaIII 10 U NlaIII
1.00 0.75 0.50 0.25 0.00
V1 V11 V13 Figure 2. Sensitive and quantitative measurement of chromatin accessibility of individual members of a highly homologous gene family. Data are expressed relative to the accessibility of the V1 gene at 2 U of enzyme (=1). Results represent the mean ± sem of four real-time PCRs from two independent preparations. Vol. 41 ı No. 4 ı 2006
Benchmarks
10. Ciccone, D.N., K.B. Morshead, and M.A. Oettinger. 2004. Chromatin immunoprecipitation in the analysis of large chromatin domains across murine antigen receptor loci. Methods Enzymol. 376:334-348. 11. Rutledge, R.G. and C. Côte. 2003. Mathematics of quantitative kinetic PCR and the application of standard curves. Nucleic Acids Res. 31:e93.
Received 31 May 2006; accepted 2 August 2006. Address correspondence to Celia R. Espinoza, Department of Immunology, The Scripps Research Institute, 10550 North Torrey Pines Road, IMM22, Room 304, La Jolla, CA 92037, USA. e-mail:
[email protected] To purchase reprints of this article, contact:
[email protected]
408 ı BioTechniques ı www.biotechniques.com
Vol. 41 ı No. 4 ı 2006