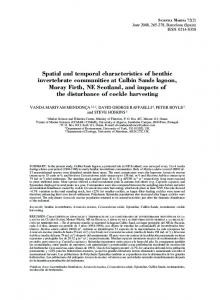
Mean (+SE) δ. 13. C. Mean (+SE) C:N. S Lumps. W hitford R. Little Is. OHR. Inner. Mid. δ15N ..... samples in Geographe Bay contained E. radiata, compared to 24.5% in Perth (SIMPER). Ecklonia ...... Panulirus cygnus George. J. Exp. Mar. Biol.
C hapter 5 5. BENTHIC ECOSYSTEM STRUCTURE: SPATIAL AND TEMPORAL VARIABILITY IN ANIMAL AND PLANT DIVERSITY Contributing Investigators
Russ Babcock (Project Leader), Geordie Clapin, Phillip England, Nicole Murphy, Julia Phillips, Alison Sampey, Mat Vanderklift, Mark Westera
CSIRO Marine and Atmospheric Research
Outline Executive Summary Introduction Aims, objectives Methods Results 5.1 Environmental Parameters 5.2 Seasonal dynamics in reef algal communities 5.3 Regional trends in reef algal communities 5.4 Spatial variation in reef algal community structure 5.5 Regional trends in reef invertebrate communities 5.6 Regional trends in fish communities 5.7 Environmental correlates of reef algal community structure 5.8 Relationships between algal communities and faunal diversity and biomass 5.9 Shallow water habitat mapping Discussion References
Executive Summary The SRFME study found a strong seasonal signal in algal biomass in all regions, however processes underlying this pattern varied for different locations, or for particular sites within locations depending on the dominant algal habitat type. Most locations showed lowest biomass in winter (e.g. Jurien, Marmion, Two Rocks and Bunbury) but others showed summer minima where the majority of sites were dominated by Sargassum. The proximal factors that drive these variations also differ among locations. Erosion of biomass is most likely to be the factor driving changes in Ecklonia dominated sites (Marmion, Two Rocks, Perth) while light limitation is likely to be a major factor at Bunbury. Where Sargassum dominates sites (Green Head) algal phenology can explain changes in biomass. In contrast to the pattern for biomass, algal community structure showed no seasonal trend which was also the case for invertebrates. Spatial trends in the data were apparent with both algae and invertebrates showing the highest number of species recorded at Jurien. Perth had the lowest numbers of species although volume two
187
numbers were only marginally greater at Geographe Bay. Four new species of invertebrates were collected during the SRFME study. Algal community structure showed significant variation at the regional and location level, although much of this variation may be explained by site level variation within locations. Similar patterns were apparent for the invertebrates both for algal associated fauna and benthic fauna. Fish showed a contrasting pattern with a high level of variation among assemblages at the regional level and virtually none at the location level. However at site level there was once again significant variation in fish assemblages. We attribute this consistent variation in assemblages at the site level to definable algal habitat types that tend to dominate at particular sites. While assemblages dominated by canopyforming large brown algae occurred at just over half the sites, nearly as many sites were instead characterised by diverse assemblages of foliose and filamentous red and brown algae. The distribution of the different algal species assemblages is correlated with a range of environmental variables, but the relative importance of different variables differs from one region to the next. At Jurien 69% of the variation in assemblage structure was explained by a combination of bottom topography and wave-generated water motion at the sea floor. At other sites the explanatory power of environmental variables was lower, between 30% and 56% and a range of water quality parameters (nutrients and suspended sediments) were most highly correlated with assemblage structure. The distribution of invertebrates was in turn linked to the nature of the algal assemblages, with species number varying according to the algal habitat type. Total numbers of invertebrates also varied according to algal habitat with an inverse relationship being found between Ecklonia density and the density of both mobile invertebrates, and large sessile invertebrates, particularly sponges and corals. Introduction Western Australia is unusual in possessing high-biomass, high-productivity benthic ecosystems despite the relatively low-nutrient waters of this coastal region that result from the low-rainfall environment as well as the influence of the Leeuwin current. The drivers of productivity and spatial distribution of WA’s coastal ecosystems are poorly understood, and there is increasing need for improved information on fundamental aspects of benthic community structure and variability in the wake of increasing pressures resulting from population growth and development (Department of Environmental Protection 1998). Improved understanding of benthic ecosystems can support efforts to manage growing human impacts, will better enable us to determine their likely response to human influences, and will help ensure their future health and sustainability. The SRFME study focused on improving understanding of one major habitat type –coastal rocky reefs – that had previously received relatively little attention. Rocky reefs are an important habitat type in nearshore coastal waters, supporting a diverse assemblage of benthic macroalgae (Huisman & Walker 1990, Phillips et al. 1997) and associated fish and invertebrates. Aside from the biodiversity associated with rocky reef communities, they are also a key component of coastal productivity, provide habitat and food for marine fauna, contribute to biogeochemical cycles, and can exert influence over nearby habitats such as seagrass meadows (Van Elven et al 2004). Despite their recognised importance, comparatively little is known of the ecology of rocky reef habitats along the lower west coast of Western Australia. As a consequence, the SRFME study sought to address this gap in current knowledge of the mechanisms structuring rocky reef communities. The approach taken in the SRFME study followed the only sound basis for future research which was to have a clear understanding of the distribution and abundance of major ecological components in the coastal ecosystem. The description of these patterns and their inter-correlations in space and time is the primary focus of Chapter 5. The dynamics of interactions between physical and biological processes, and of ecological interactions, is the focus of Chapter 6. The understanding of both pattern and process is essential to the achieving the ultimate goal of modelling the coastal ecosystem and gaining the ability to predict ecosystem behaviour.
188
SRFME final report 2006
Aims, objectives Building meaningful ecosystem models, whether they are conceptual or ultimately numerical, is a complex process that must draw on many different areas of expertise. Within such a program, the task of ecology is particularly complex since it must deal with a sometimes bewildering array of biological complexity and attempt to distil this down to tractable concepts that can be dealt with in a cost effective manner. The usual approach applied to this problem, especially where there is relatively little prior research on the ecosystem, is to conduct a series of systematic observations in such a way that the patterns of variation in marine communities over space and time would inform us of the key processes and environmental factors influencing the structure and dynamics of the system. For this reason sampling was designed to cover as wide a range of coastal reef habitats as possible, in order to encompass the full range of variability in physical and biological variables, improving our ability to correlate physical parameters with biological responses. The study areas were replicated throughout the SRFME region between Jurien Bay and Geographe Bay in order to ensure that results would be representative of the region, rather than specific to just one location. Additionally assemblages of plants and animals are patchy in space and time, complicating the process of discerning patterns in structure or process. Because ecologists’ perception of the nature of patchiness is that it is not a nuisance but an important component of ecology influencing many processes from population abundances and rates of change to interactions among species and overall species diversity (Underwood et al. 2000). Sampling to investigate the scale and nature of variability in ecological systems usually employed a nested design, incorporating sites in a hierarchical structure. In our case there was both spatial and temporal nesting. Spatially, sampling was nested at scales of meters, kilometres, tens of kilometres and hundreds of kilometres (quadrats, sites, locations and regions – Fig. 5.2). Temporal sampling was structured to incorporate seasonal and annual variation. Thus all of this hierarchical or nested sampling was done at the same set of “core sites”. This design also allowed us to establish baselines against which we will be able to assess whether trends or variation observed in the future are outside the range of spatial or temporal variation normally expected. Our ultimate goal was to lay the groundwork, with this reductionist approach, for scaling up estimates of distribution, abundance, biodiversity and so on, to broad scale synoptic evaluation of ecosystem values at a landscape scale. In order to do this we explored the use of remote sensing approaches to map and evaluate these ecosystem values. The goal of the SRFME study was to characterise and understand the mechanisms underlying natural variability in diversity and dynamics of benthic community assemblages in selected southwestern Australian coastal marine ecosystems. The project focused mainly on reef habitats since these have been less intensively studied than the seagrass habitats of southwestern Australia. The geographic scope of the work included areas between Green Head in the north and Cape Naturaliste to the south. The range was not greater due in part to logistical constraints but also since all the sites fell within the temperate west coast region. At the same time they afforded a set of gradients in physical (latitude, temperature, bathymetry, fluvial inputs) as well as anthropogenic gradients (proximity to large urban centres, marine protected areas). The specific SRFME goals addressed in this chapter were to: •
Characterise and quantify seasonal-scale temporal variation in algal and invertebrate assemblages
•
Characterise and quantify region-, location- and site-level variation in algal, fish and invertebrate assemblages
•
Characterise algal and invertebrate biodiversity and define identifiable algal community types
•
Explore and identify environmental factors correlated with algal community structure variation at cross-shore, within location and within site levels
•
Characterise and quantify correlations between algal community type and invertebrate assemblage structure and abundance
•
Evaluate the use of remote sensing approaches for the mapping of shallow water habitats
volume two
189
Methods Sampling sites Sites for the SRFME project were chosen based upon representing spatial scales of meters, kilometres, tens of kilometres and hundreds of kilometres (as mentioned above). At the largest scale (hundreds of kilometres) three main ‘regions’ were selected, Perth in the centre of the project area, Jurien approximately 200 km to the north and Geographe Bay approximately 200 km to the south of Perth (Fig. 5.2). Within each region, ‘locations’ were selected at the northern and southern extent to represent a scale of tens of kilometres. The locations selected in the Jurien region are Green head and Jurien Bay, in the Perth region Two Rocks and Marmion and in the Geographe Bay region Bunbury and Cape Naturaliste. Nested within each location, ‘sites’ were chosen at a spatial scale of kilometres to represent a range of reefs in the area. At each site, a variety of sampling methods including quadrat samples, and transects represent the smallest spatial scale. Sites from the SRFME regions of Jurien, Perth and Geographe Bay were sampled during the period winter 2003 to winter 2005. Within each location two ‘core’ sites were sampled each season in order to assess temporal variation. The core sites were chosen to be reasonably accessible during the expected range of seasonal weather conditions and were thus located on inshore reef, approximately 500m to 3 km from shore and within 12 km from the nearest safe boat launching ramp. Where possible, core sites were selected both inside and outside a marine reserve area. Additional sites in each location were selected to address questions of spatial variability relating to variation in physical environment such as cross-shore position and depth. These sites were located on a variety of inshore, mid and offshore reefs in both exposed and sheltered aspects of the reef and due to limited accessibility were generally sampled only once during the summer or autumn seasons. Fifty one sites were studied in the SRFME study; 9 sites from Green Head, 19 from Jurien Bay, 2 from Two Rocks, 9 from Marmion, 10 from Bunbury and 2 from Cape Naturaliste (Fig. 5.2 & Table 5.1). The average depth of reefs sampled ranged from 2.2 m at North Essex in Jurien Bay to 15.9 m at BBY15M at Geographe Bay. Most of the reefs sampled were less than 7 m but at least one deeper (>10 m) site was sampled in each region. The core sites were all inshore reefs of less than 7 m depth. At a regional scale the sampling sites are spread over approximately 400 km of coastline from north to south and there are inherent differences in the physical influences on the three regions. Average sea surface temperatures (SST) for the regions range by approximately 1.5°C, with maximum temperatures during March to April from 21.8°C at Jurien, 21.6°C at Perth, 21.2°C at Eagle Bay and the lowest of 20.3°C at Bunbury. Minimum SST during September to October ranged from 18.5°C at Jurien, 18.4°C at Perth, 17.7°C at Eagle Bay and again the lowest average of 17.0°C at Bunbury (ref: SRFME DIVE database). Human influences on water quality in the three regions are mainly dominated by proximity to large centres of population particularly at sites in the Marmion location and sites close to the Jurien, Bunbury and to a lesser extent Eagle Bay. Influences on water quality in the three regions also include input from estuarine and river systems. In the Jurien region the only river system is the Hill River which is closest to sites at Booka Valley, however this river is only seasonally open and usually only for a few days or weeks (Brearley 2005). In the Perth region the nearest river inputs are the Swan River, 25 km south of sites at Marmion and the More River which is 12km north of sites at Two Rocks and only seasonally open to the sea (Brearley 2005). Sites in the Geographe Bay region are possibly influenced more by riverine input particularly at Bunbury with the Leschenault Inlet and Collie River only 6 km to the north and the Capel River and Wonnerup Inlet to the south. Sites in the Cape Naturaliste location may be influenced by the numerous small inlets to Geographe Bay such Toby Inlet, and the Vasse diversion drain (Brearley 2005). The closest site to these inlets is at Eagle Bay approximately 13 km from Toby Inlet. 19 0
SRFME final report 2006
The Jurien and Perth regions share similar topographic features of complex limestone reef systems with a range of offshore, midshore and nearshore reefs and islands although with a greater number of islands at Jurien. These complex systems present a range of sites with varying degrees of influence by wave action from highly exposed outer reef to very sheltered reef inshore and inside the islands. The topography was quite different in the Geographe Bay region with a mix of granite and limestone reef and lacking the complex offshore reef and islands. The west facing coast at the Bunbury location with no offshore reef is very exposed to wind and wave influence whereas at Cape Naturaliste, the sites face further to the north and although still very exposed, seemed to be more influenced by surge from large swell. The majority of the reefs sampled were limestone; the exceptions to this are granite reefs located at Cape Naturaliste (Eagle Bay and Quarries) and basaltic reef at one Bunbury site (BBY08). The relief of core sites range from low relief limestone reefs at the Bunbury sites (South Bunbury and Dalyellup), through medium relief reefs at the Marmion sites (South Lumps and Whitford Rock) and Julia Rocks at Green Head, to high relief reefs at the remaining Jurien sites (Fisherman Island Sanctuary Zone 3, Wire Reef and Booka Valley Rocks) and the Two Rocks sites (Cook Lump and Map Reef). The Cape Naturaliste sites were medium to high relief granite boulders and cobbles interspersed with low relief sand covered patches of reef. Sampling methods – environmental Two measures of the physical characteristics of reefs were made; namely reef relief and rugosity (Table 5.1). The subjective measure of reef relief considered the elevation of the reef above the surrounding seabed, while the quantitative rugosity code measured the topography of the horizontal reef surface where sampling took place. Chlorophyll a, total suspended solids (TSS), water column nutrients and light attenuation were measured at each site. Although the sampling frequency only provided a ‘snapshot’ of local environmental with no integration of temporal variability, measurements were useful for making relative comparisons between sites within seasons. Filtered water samples were analysed according to standard methods for chlorophyll a, TSS, N, P and Si. Available nitrogen was measured in the form of ammonium (NH4) and total oxidised nitrogen (NOx), which is the combination of nitrate (NO3) and nitrite (NO2). Light levels throughout the water column were measured using a Li-Cor LI 250 meter with 2-Pi sensor. Carbon and nitrogen isotopes and content in the tissue of the kelp Ecklonia radiata were determined from reefs throughout the SRFME study area, to provide an indication of past nutrient availability and sources. Replicate plants were sampled from a number of reefs and samples were analysed using an ANCA-NT/20-20 stable isotope ratio mass spectrometer (Europa Scientific, Crewe, UK). Sampling methods - biological At each site sampling was conducted at both 1 m2 and 0.25 m2 scales using randomly placed 1 x 1 m quadrats which had a 0.5 x 0.5 m quadrat fixed in one corner. Sampling of the 1 m2 quadrats included solitary or mobile invertebrates >10 mm in size, with the 0.25 m2 quadrat typically providing data on invertebrates 100 cm), B – boulders, C – cobbles, * - granite reefs. Higher rugosity values indicate greater change in topography, or roughness, of reef surfaces. Rugosity Depth (metres) Reef Site Quadrat No. Site Name Mean Range Relief Mean St Dev Mean St Dev Jurien – Green Head 1 WA Museum 12 8.6 8.3 - 9.1 H 1.3 0.2 1.2 0.1 2 WA Museum 11 5.6 5.2 - 5.8 L 1.5 0.8 1.2 0.1 3 Fisherman’s Island 12m 12.8 12.5 - 13.2 M 1.0 0.1 1.1 0.1 4 Fisherman’s Islands Sanctuary Zone 2 3.8 3.4 - 4.2 1.3 0.2 5 Fisherman’s Islands Sanctuary Zone 1 4.8 4.2 - 5.5 M 1.2 0.1 6 WA Museum 15 7.0 7.0 - 7.1 L 1.0 0.0 1.0 0.0 7 Fisherman’s Islands Sanctuary Zone 3 4.1 2.5 - 5.8 H 1.4 0.2 1.4 0.2 8 Julia Rocks 2.9 1.0 - 4.4 M 1.3 0.1 1.3 0.2 9 WA Museum 14 5.1 5.0 - 5.5 L 1.0 0.0 1.0 0.1 Jurien – Jurien Bay 10 WA Museum 9 4.8 4.7 - 5.0 M 1.6 0.3 1.2 0.1 11 North Head 4.6 4.3 - 4.9 H 1.3 0.0 1.4 0.2 12 Favourite Island 6.2 6.1 - 6.4 L 13 WA Museum 3 5.4 4.5 - 5.9 H 1.3 0.2 1.3 0.2 14 Seaward Ledge East 06 6.5 5.8 - 6.8 LC 1.2 0.1 1.4 0.3 15 WA Museum 2 5.6 5.1 - 5.8 L 1.1 0.1 1.2 0.1 16 Seaward Ledge 6m 7.0 6.1 - 8.4 H 1.3 0.1 1.2 0.1 17 North Marker 9.7 9.0 - 10.2 L 1.3 0.1 18 Seaward Ledge 13m 13.6 13.3 - 14.0 M 1.1 0.1 1.1 0.1 19 WA Museum 5a 7.7 7.5 - 8.0 L 1.0 0.0 1.2 0.1 20 Wire Reef 5.2 3.8 - 6.3 H 1.6 0.1 1.6 0.3 21 North Osprey 2.8 2.5 - 3.1 M 1.4 0.1 22 North Essex 2.2 1.9 - 2.5 H 1.5 0.1 23 WA Museum 7 6.8 6.3 - 7.8 M 1.4 0.1 1.2 0.1 24 WA Museum 6 11.8 11.4 - 12.0 H 1.2 0.1 1.2 0.1 25 WA Museum 4a 5.1 4.8 - 5.4 L 1.4 0.2 1.2 0.1 26 Booka Valley Rocks 4.1 2.8 - 5.2 H 1.7 0.2 1.7 0.3 27 WA Museum 8 7.7 7.0 - 8.6 H 1.2 0.1 1.5 0.2 28 WA Museum 1 3.1 2.6 - 3.8 H 1.4 0.1 1.4 0.3 Perth – Two Rocks 29 Cook Lump 6.1 3.5 - 8.3 H 1.3 0.0 1.4 0.3 30 Map Reef 5.9 3.7 - 8.3 H 1.9 0.3 1.7 0.4 Perth – Marmion 31 South Lumps 5.5 4.4 - 7.2 L 1.2 0.1 1.4 0.2 32 Whitford Rock 4.4 2.9 - 5.7 M 1.5 0.2 1.6 0.3 33 3 Mile Reef North 15.6 14.8 - 16.2 M 1.2 0.0 1.1 0.2 34 Little Island West 1 14.0 13.4 - 15.0 M 1.2 0.1 35 Little Island 4.6 4.0 - 5.3 M 1.9 0.2 36 Cow Rock 4.2 3.0 - 5.1 H 1.7 0.3 1.5 0.2 37 3 Mile Reef South 13.6 13.0 - 14.2 L 1.2 0.1 1.1 0.2 38 Outer Horseshoe Reef 6.5 6.2 - 6.8 L 1.1 0.0 39 Horseshoe Reef West 1 13.8 13.4 - 14.2 L 1.1 0.0 Geographe Bay – Bunbury 40 BBY15M 15.9 15.1 - 16.2 L 1.0 0.0 1.1 0.0 41 BBY08 10.8 10.4 - 11.0 L* 1.2 0.1 42 South Bunbury 7.2 6.5 - 8.0 L 1.4 0.2 1.3 0.2 43 Bunbury 4 44 BBY14M 13.7 13.2 - 14.2 L 1.2 0.1 1.1 0.1 45 BBY10B 9.4 9.2 - 9.5 L 1.1 0.1 46 Dalyellup 1 6.8 6.3 - 7.3 L 1.1 0.4 1.2 0.1 47 Dalyellup North 5.8 5.6 - 6.0 L 48 Bunbury 3 49 Capel 5 2.1 1.5 - 2.6 M 1.4 0.1 1.7 0.1 Geographe Bay – Cape Naturaliste 50 Quarries 5.2 3.8 - 7.4 L* 1.2 0.1 1.5 0.5 51 Eagle Bay 5.7 2.3 - 6.7 L*BC 1.4 0.2 1.6 0.2 196
SRFME final report 2006
Results
5.1 Environmental Parameters Investigators / Institution
Alison Sampey, Geordie Clapin, Julia Phillips, Nicole Murphy, Russ Babcock, Mat Kleczkowski
CSIRO Marine and Atmospheric Research
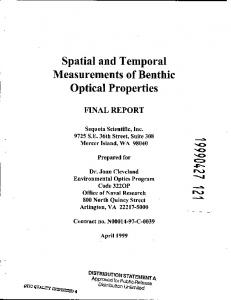
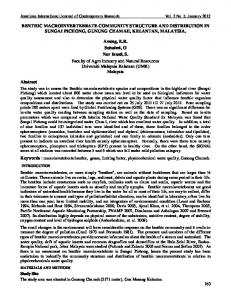
Nutrients In the majority of samples NOx made up a larger portion of available nitrogen than NH4 (Fig. 5.3). Mean levels of available nitrogen were highest at Two Rocks and Jurien Bay during autumn 2004. Mean levels at Marmion were elevated above other sites on all other occasions. Mean phosphate (PO4) levels at the majority of sites ranged from 0.3 to less than 0.01 µM-L, and were highest at Marmion (0.28 µM-L) and lowest at Bunbury (0.04 µM-L) (data not shown here). There was little seasonal change in phosphate levels. Chlorophyll a Mean chlorophyll a levels were highest in Bunbury (5.4 µM-L) and lowest at Green Head (0.5 µM-L) (Fig. 5.3). Mean chlorophyll a levels did not vary much seasonally except at Bunbury, where they were much higher and more variable in winter compared to the other seasons. This is consistent with the trends in nutrient availability. Light attenuation Light attenuation coefficient showed a clear seasonal trend across most locations with attenuation increasing from autumn to winter and the highest attenuation recorded during spring then dropping off during summer (Fig. 5.4). Bunbury generally had the highest attenuation coefficient, which also corresponds to the high levels of chlorophyll a (and TSS, not shown here) particularly during winter and spring. These trends were also quite apparent to the divers conducting sampling at each location as changes in underwater visibility. Visibility was very low at Bunbury sites during winter and spring, frequently with a distinct reduction to almost zero visibility within 1 to 2 m above the bottom. However, since water samples were collected near the surface this stratification of highly turbid water near the bottom is not fully reflected in the TSS samples.
volume two
197
«-, �
���
.(�
./X
���
��� ���
«-, �
!UTUMN��
7INTER��
���
���
«-, �
���
���
«-, �
��� ���
3UMMER��
���
��� ���
«-, �
3PRING��
!UTUMN��
���
���
«-, �
���
7INTER��
���
���
'REEN (EAD
*URIEN "AY
4WO -ARMION "UNBURY #APE 2OCKS .ATURALISTE ,OCALITY
Figure 5.3: Mean total oxidized nitrogen (NOx) and ammonium (NH4) recorded from sites within each location.
198
SRFME final report 2006
Mean (+ SE) Chl a µ gL-1
8
Chlorophyll a
autumn
winter
spring
Two Rocks
Marmion
Bunbury
Summer
6
4
2
Mean (+ SE) Light attenuation coefficient
0 0.8
Light Attenuation
0.6
0.4
0.2
0
Green Head
Jurien Bay Jurien
Perth
Cape Naturaliste
Geographe Bay
Figure 5.4: Seasonal variation in chlorophyll a (µg L-1) and light attenuation for project sites during 2004-2005.
C and N content and isotopes At a regional level, kelp from Perth reefs had elevated levels of δ15N, that were nearly twice as high as in kelp from Jurien and Geographe Bay (p