Some companies have introduced life cycle management based on life cycle thinking and a life cycle perspective on all their activities from purchase over ...
Available online at www.sciencedirect.com
ScienceDirect Procedia CIRP 29 (2015) 1 – 7
The 22nd CIRP conference on Life Cycle Engineering
Better – but is it good enough? On the need to consider both eco-efficiency and eco-effectiveness to gauge industrial sustainability Michael Z. Hauschilda,* a
Technical University of Denmark (DTU), Department of Management Engineering, Division of Quantitative Sustainability Assessment, Produktionstorvet Building 424, Kongens Lyngby, DK-2800, Denmark
* Corresponding author. Tel.: +45-4525 4664. E-mail address: mzha @dtu.dk
Abstract Sustainability is gaining prominence among the priorities of large companies, and engineers have taken on the eco-efficiency challenge, optimizing the functionality and minimizing the negative environmental impacts of our products and technologies. Although impressive improvements in efficiency can be demonstrated in many local cases, increases in population, affluence and consumption create an opposite trend that we need to factor in when we address sustainability of our technological developments in an absolute sense. The paper discusses absolute boundaries for environmental sustainability, metrics for gauging our solutions against these boundaries and the need and possibilities of expanding our focus from efficiency to effectiveness. © The Authors. Authors. Published Published by by Elsevier Elsevier B.V. B.V.This is an open access article under the CC BY-NC-ND license © 2015 2015 The Peer-review under responsibility of the International Scientific Committee of the Conference “22nd CIRP conference on Life Cycle (http://creativecommons.org/licenses/by-nc-nd/4.0/). Engineering. Peer-review under responsibility of the scientific committee of The 22nd CIRP conference on Life Cycle Engineering Keywords:5-10 keywords Absolute sustainability; IPAT equation; Eco-efficiency; Midpoint LCA; Eco-effectiveness; Cradle to cradle; Planetary boundaries; Carrying capacity; Normalization; Person equivalent
1. Introduction Industry has a crucial role to play in the transformation of our society and in particular our consumption and production towards environmental sustainability. Its own energy consumption and discharge of chemical pollutants to the environment are important sources of environmental impacts that need to be curbed, but industry’s main role lies in the development and production of the products that will satisfy the needs of our generation without compromising future generations’ possibilities to satisfy their needs. About sustainability the World Business Council for Sustainable Development states that “Business cannot succeed in societies fail” (http://www.wbcsd.org/newsroom/keythat messages.aspx). Thus, sustainability within industry is in the interest of current and future generations but also of industry itself. The urgency of a shift towards sustainable practices becomes more and more obvious whether the focus is on manmade climate change, freshwater use, toxic pollution or
depletion of scarce resources. Environmental performance has long been on the corporate agenda but where has it taken us? The paper takes a look at industrial practices so far and argues that we need a shift from the current focus on relative improvement towards absolute assessments of performance to support a move towards sustainable industrial practices. 2. Eco-efficiency of products and technologies Traditionally, companies have a focus on efficiency of their operations, aiming to maximize their value creation while minimizing costs. From an environmental performance perspective, costs may be the use of energy or other resources or the unwanted impacts on the environment that are caused by the operation. The environmental efficiency can accordingly be expressed by an energy-efficiency, a resourceefficiency or a broader eco-efficiency of the product or the provided service. The ISO 14045 standard [1] defines ecoefficiency as an “aspect of sustainability relating the
2212-8271 © 2015 The Authors. Published by Elsevier B.V. This is an open access article under the CC BY-NC-ND license (http://creativecommons.org/licenses/by-nc-nd/4.0/). Peer-review under responsibility of the scientific committee of The 22nd CIRP conference on Life Cycle Engineering doi:10.1016/j.procir.2015.02.126
2
Michael Z. Hauschild / Procedia CIRP 29 (2015) 1 – 7
environmental performance of a product system to its product system value”. These efficiency measures may accordingly be defined as the ratio between the value created or function fulfilled by the product system and the cost in terms of the resource use or impact that is caused. For the eco-efficiency the expression would be: ܿܧെ ݂݂݁݅ܿ݅݁݊ܿ ݕൌ �
௨�௧ௗ��௨௧௧௬�௩ௗௗ ா௩௧�௧�௨௦ௗ
(Eq. 1) Huppes and Ishikawa [2] note that to make the definition of eco-efficiency operational, more work is needed to agree on the content given both to the value creation in the numerator and the environmental impact caused in the denominator of Eq. 1. Beginning with the denominator, the environmental impact caused, the ISO standard [1] argues that environmental impact should be evaluated using Life Cycle Assessment (LCA). When the focus is on value creation through production and use of products, there are two good reasons to follow this ISO requirement. The first reason is that the creation of value or function through products will cause impacts on the environment not just during the manufacture or use of the product but also through the acquisition of resources that are used to produce or operate the product. At the end of its use, the product may also cause negative impacts through end of life treatments but it may also be refurbished to have a second life or act as a source of materials or components for other products, thus saving additional production. All these stages of the product’s life cycle must be considered to ensure that the calculated eco-efficiency gives the full picture of the environmental impacts that the product causes [3,4].
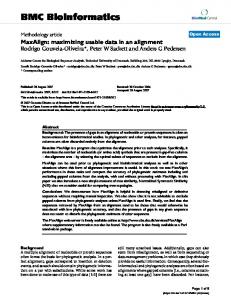
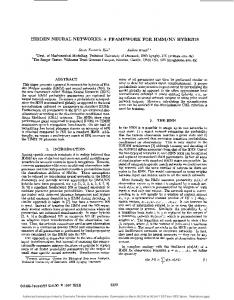
Figure 1. In eco-efficiency assessment a life cycle perspective should be applied on the activity
The second reason to use LCA for assessment of the environmental impacts in Eq. 1 is that products can contribute to many environmental impacts ranging from the global scale with climate change, stratospheric ozone depletion and loss of non-renewable resources, over regional impacts like acidification, eutrophication, photochemical ozone formation and toxic impacts to humans and ecosystems, to local scale impacts like use and destruction of land and depletion of water resources. LCA offers a well-established methodology with a consistent and coherent framework of mutually exclusive and collectively exhaustive impact categories to quantify and compare the contributions to all these impacts in a quantitative manner [5,6]. The current trend to concentrate environmental performance assessments of products and technologies on their life cycle-based carbon footprint is motivated by a
concern about climate change impacts and by the feasibility of quantifying the carbon footprint with a limited effort and reasonable certainty. While a carbon footprint is generally better than nothing, its ability to represent the overall impact of a product or technology is often poor [7] and the broader coverage of impacts requested by the LCA is required to reveal the problem shifting between impacts that may occur when reductions in one impact (like climate change) are accompanied by increased impacts in other categories of impact [8].
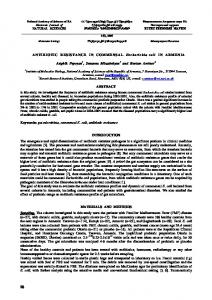
Figure 2. In LCA environmental impacts are assessed in a consistent framework linking inventory results to mutually exhaustive impact categories at midpoint and on to damage to the areas of protection through quantitative characterization models [6].
Concerning the content of the numerator in Eq. 1, the function or service provided by the product is quantified in terms of type, duration and extent in the functional unit that is defined in the first phase of the LCA with the aim to ensure that when different alternatives are compared in the LCA, they do provide the same service and are functionally equivalent for the user [9,10]. By fixing the functionality provided by the product or technology and taking a life cycle perspective while addressing all relevant impacts, LCA is the obvious tool for comparing eco-efficiencies of products and technologies [1]. 3. Application of eco-efficiency in industrial practices An optimization of industrial eco-efficiency requires that it be addressed at all levels of industrial activity. Duflou and coworkers give examples of how energy-efficiency can be optimized from the level of the individual process over the level of the factory or company to the symbiotic relationship between multiple companies and the supply chain or the product life cycle. They discuss the improvements that are attainable at the different levels and argue that at least 50% improvement should be possible for the global manufacturing industry [11]. A cause of environmental impacts also outside the factory is the consumption and disposal of the product and the activities that this entails (Figure 1). Eco-efficiency is hence a focus point for product design in companies that target the green segment of the market and have environmentally responsible behavior as part of their brand value [12]. To support eco-design, LCA can be used at a conceptual level to support strategic decisions on
3
Michael Z. Hauschild / Procedia CIRP 29 (2015) 1 – 7
development of product portfolios and new business areas and on a more detailed level to identify environmental focus points or hot spots in the life cycle of a concrete product under development and to benchmark alternative design options on their contribution to the product’s overall ecoefficiency [13]. Some companies have introduced life cycle management based on life cycle thinking and a life cycle perspective on all their activities from purchase over product development and production to sale and servicing, with the potential to optimize their overall eco-efficiency as a company [14]. In order to position their products stronger in the market, many companies document the eco-efficiency of the product with eco-labels or environmental product declarations, both of which must be based on a life cycle assessment, according to the ISO standards [15,16]. Ecoefficiency is influencing central processes in many companies like the product development, the purchasing or sourcing, and the choice of distribution system, and eco-efficiency is a core element of much environmental communication of companies. 4. What has the focus on eco-efficiency brought us? The quest for increased eco-efficiency leads industry in the direction of greener and more resource-efficient products, i.e. products that offer the user more functionality per caused environmental impact or resource consumption. An eloquent example is quoted in Gutowski’s keynote from the 2011 CIRP Conference on Life Cycle Engineering [17]. In a study of the development of lighting technologies over the last 150 years Ausubel and Marchetti [18] find an exponential increase over time in the energy efficiency of lamps, spanning more than two orders of magnitude from the paraffin candle to recent diode lamps. Even when factoring in the difference in energy used for manufacturing the lamps, this development allows us today to obtain a given lighting service with a minute fraction of the energy used 150 years ago. Nevertheless, Tsao et al. [19] show that over the same period of time, the share of our electrical energy generation per capita which is used for lighting has remained remarkably constant. In spite of a dramatic growth in electricity generation and the increase in the efficiency of lamps over the last centuries, we still use the same fraction of the electricity on lighting. The increase by more than two orders of magnitude in the energy-efficiency of lamps has not resulted in a reduced energy use. Reasons can be found in the rebound effect in the market, where increased energy-efficiency through reduced costs of lighting inspires an increase in the demand and use of the lamps. This counteracts the anticipated electricity saving. In the concrete case, it more than neutralizes the efficiency gains and in fact leads to an increased use of electricity for lighting, which is observed as a constant fraction of a growing electricity generation over time. In this case, dramatic increases in efficiency have not taken us in the direction of reductions in energy use and the associated environmental impact – on the contrary. Rather than being part of the solution, it seems that the improved efficiency here is part of the problem, driving an increased
demand for lighting in what environmental economists call a backfire effect [20]. The IPAT equation (Eq. 2) was developed to analyze the dependence of the environmental impact (I) on the driving factors represented by the human population (P), the human affluence (A, the value created or consumed per capita) and the technology factor (T) representing the environmental impact per created value (the reciprocal of the eco-efficiency defined in Eq. 1) [21,22]. ܫൌ ܲήܣήܶ
(Eq. 2)
With the foreseeable increases in the global population (P) and global average affluence (A), T must be reduced in proportion to keep the level of impact (I) constant. For an impact like climate change there is an emerging consensus that the current level of impact is not sustainable, and the Intergovernmental Panel on Climate Change, IPCC, estimates that emissions of CO2 must be reduced by approximately 60% in 2050 (and close to 100% in 2100) compared to 2000 to avoid disastrous climatic developments if global average atmospheric temperature increases and exceed 2°C [23]. If the current level of impact is unsustainable and must be reduced, this poses stronger requirements for reductions in T. Overall increases in our ecoefficiency by factors of 4, 10 or even as high as 50 have been proposed, reflecting different assumptions about the time horizon over which the development is observed, the developments in P and A and the required reduction in I [24,25,26,27]. These factor calculations assume that A and T are independent, but in the lighting example discussed here, this is not the case since the reduction in T (increased ecoefficiency) leads to a growth in A. While it is generally acknowledged that a strong increase in the eco-efficiency of products and technologies is a pre-requisite for the development of a global sustainable society [25], the example illustrates that a focus on eco-efficiency alone is not sufficient to bring us in the direction of a sustainable production and consumption. 5. The need for an absolute perspective Companies see environmental performance as important for their competitive edge and can report how their products get more eco-efficient or green, and offer a better functionality at a reduced environmental impact. In Europe, criteria for product eco labels have to be revised and tightened regularly to ensure that they remain obtainable only for a small fraction of the products in the market [28]. This is due to continued increases in eco-efficiency which improve the environmental performance of the average products. In spite of such indications of widespread improvements in the eco-efficiency of products, the overall trend that can be observed for most of the environmental impacts in Figure 2 does not indicate a sustainable development. The IPAT equation (Eq. 2) offers explanations in terms of growing population numbers and increasing levels of affluence and consumption in large parts of the world. A potential coupling
4
Michael Z. Hauschild / Procedia CIRP 29 (2015) 1 – 7
between consumption and eco-efficiency can also be part of the explanation. Overall, this questions how meaningful it is to talk about sustainability in relative terms. While products or services get more sustainable, the overall consumption and the associated production get less sustainable in terms of total impact on the environment. The question whether a product or a certain way of obtaining a service will ever be sustainable, meaning possible to sustain in the long run without undermining itself, is not addressed. Product A may be more environmentally sustainable than product B, while neither is sustainable in absolute terms, but this is not something that we can detect by looking at the eco-efficiency of the two products. The question should not be just whether product A is more ecoefficient than product B but also whether any of the products is eco-effective in the sense of fulfilling needs in a manner that is in accordance with the overall conditions that must be met by a sustainable society. But what are the conditions that must be met for a practice to be sustainable? 5.1. Brundtland Commission – the starting point The United Nations’ Brundtland Commission coined the now widely adopted definition of a sustainable development as a “development that meets the needs of the present without compromising the ability of future generations to meet their own needs” [29]. This definition emphasizes fulfilment of human needs and inter-generational equity. It is, however, based on very flexible and loosely defined elements. The first flexible element is human needs. There is no specification of which type of needs the definition refers to and this allows an interpretation to range from basic physiological needs like nutrition or shelter to more advanced needs like esteem and self-actualization (referring to Maslow’s hierarchy of needs [30]). The wide range of possible needs to be fulfilled by the development allows very large differences in resource use and environmental impact and uncertainties on how the higher levels of needs will be met. The second flexible element is the way in which future generations will meet their needs. Both the needs and the way in which they will be fulfilled in the future strongly depend on technological developments and are hardly possible to predict with any precision. At the same time they will have a strong influence on the environmental impacts associated with future fulfilment of human needs. These two elements of the Brundtland Commission’s definition concern the affluence (A) and the technology (T) factors of the IPAT equation, but also the size of the population (P) has a strong influence on the overall impact as reflected in Eq. 2. Consumption patterns that are environmentally sustainable in a world of 100 million people may not be so in a world with a population of 10 billion. The flexibility of the sustainability definition by the Brundtland Commission is probably part of the explanation why it is so broadly adopted but it makes it difficult to apply in an operational assessment of a specific activity or choice. While defining a sustainable development on a conceptual level, it is thus not useful for a more specific identification of the requirements that a technology must meet in order to be considered sustainable.
5.2. Cradle to cradle – a vision of a circular economy With their “waste equals food” principle, Braungart and McDonough [31] seek inspiration in nature’s endless cycling of nutrients cycles to develop a vision of a waste-free society where focus is on designing products and systems with outputs that can be taken up and utilized by other processes or systems (man-made or natural), so no materials are lost. This goes for process emissions during the life cycle of a product as well as for the product itself once it reaches the end of life stage, ensuring that what could have been the grave of the product becomes the cradle of a new product (hence the name Cradle to cradle). The authors stress the difference to the ecoefficiency thinking and argue that Cradle to cradle is about eco-effectiveness, about doing good rather than just doing less bad, and that rather than aim to do the things right (or less wrong), we should aim to do the right things [32]. Building on the cradle to cradle concept, the vision of a circular economy has evolved with focus on avoiding loss of resources and materials by closing society’s material loops and avoiding degradative downcycling of materials (e.g. [33]). With its explicit request for eco-effectiveness, Cradle to cradle presents itself as a vision of a sustainable society with very concrete requirements to products and technologies. There are, however, fundamental assumptions underlying the vision that have caused skepticism about whether it would indeed be sustainable if rolled out at full societal scale. One concern is that the thermodynamically based trade-off between recycling efficiency and energy use is ignored in the Cradle to cradle principles with a reference to the requirement that all energy should be produced from renewable sources (“current solar income”) [34]. Another concern is the claim that in a cradle to cradle society there is no conflict between sustainability and unlimited growth in consumption since resources are not lost but recycled while energy is supplied from current solar income. While this notion is appealing to many companies, it is seen as dangerously naive by others [35]. 5.3. Planetary boundaries – a top-down approach In contrast to the bottom-up approach proposed by the Cradle to cradle vision’s requirements to the design, production and consumption of products, the Planetary boundary concept developed by Rockström and colleagues [36] takes a top-down view. The authors note that according to geologists and environmental chemists we are leaving the Holocene epoch and entering the Anthropocene characterized by the ability of anthropogenic activities to cause a significant global impact on Earth’s ecosystems. The Holocene has been a geological epoch characterized by a very unusual stability of temperature and climatic conditions as the environmental foundation on which human civilization as we know it has evolved. The authors therefore express concern that manmade activities may cause the Earth system to move out of this stable state in the Anthropocene epoch. They identify nine planetary systems including the regulation of climate and nutrient cycling and propose indicators of man-made impacts and impact levels below which we must stay in order not to jeopardize the self-regulation of central planetary processes
Michael Z. Hauschild / Procedia CIRP 29 (2015) 1 – 7
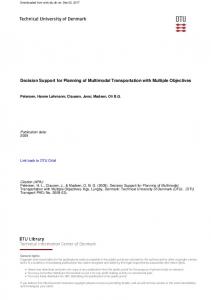
which ensure the stable environmental conditions that we have known throughout the Holocene. They identify these impact levels based on natural science and present them as the planetary boundaries or absolute limits for man-made impact on the environment that current and future societies must respect in order to stay within a safe operating space for humanity. The authors find that out of the nine planetary systems they propose, the boundaries have been exceeded for three and for two they have not been able to develop indicators or quantify boundaries (see Figure 3). The planetary boundary concept has inspired lively discussions of the concrete indicators and boundaries put forward for all the individual planetary systems, but the overall concept with its notion of absolute boundaries for sustainability has inspired both governments [37] and industries [38] to start gauging their activities against the yardstick of absolute sustainability that it offers.
Figure 3. Planetary systems and current status of impact according based on [36]
6. How can absolute assessments of products and technologies be made operational? The Planetary boundary methodology may help us define thresholds not to be exceeded in order to ensure a sustainable level of impact – now and in the future. Such thresholds delimit a “safe operating space” for pollution and resource use within which we need to stay with the total man-made activities, and hence define a yardstick that we can use to judge our activities and the technologies and products that we use to perform them. An important question is how we share this common safe operating space. Until now, it has largely been the “tragedy of the commons” – the pollution space in the atmosphere belongs to us all, and its management is thus the responsibility of nobody. In order to create a meaningful yardstick for evaluating the sustainability of an activity, we need to agree on how this safe operating space should be allocated between us and our different activities. This is not a simple task, and there is no objectively correct way to do it. It will be a matter of negotiation, and some of the inherent challenges have already been demonstrated by the distribution of national emission quota in the CO2 quota system: x Which criteria should we base the distribution on? – emissions in a baseline year? Population numbers? Areas? Who should decide?
x
What about the historical responsibilities – for many impacts a large part of the safe operating space that once was there has been filled by the activities of the developed nations leaving little space to developing nations? Taking the Planetary boundaries as basis, Nykvist and coworkers use population numbers to allocate the (remaining) safe operating space between the world’s nations for seven of the nine planetary systems where the methodology is operational (see Figure 3) [37]. They use the results to evaluate the extent to which the impacts of the Swedish nation stay within the safe operating space thus assigned to Sweden (correcting for impacts embodied in the Swedish imports and exports). Their study shows interesting variations in which boundaries are exceeded by the different nations, but it also gives an example of how the planetary boundaries can be made operational to develop absolute sustainability targets at national levels. Taking the approach to the corporate level does not make the allocation of the finite pollution spaces to individual entities more straightforward. How can we decide which part of the pollution space a company can claim for their activities? Should the space be allocated according to the value creation or the creation of employment? Should it simply be allocated according to impacts in a reference year as proposed by the 3% solution initiative, where all companies are committed to follow the overall reduction rate [39]? Or should we choose a people-centered approach where the total space is shared among the citizens (as in [37]) who then through their consumption assigns it to the companies that provide the consumed products? If so, which share follows which product - how large a share of the personal pollution space is allowed for food, for transport, for clothing? In the absence of answers to these questions, companies may as a start target not to increase their share of the safe operating space, keeping their environmental impacts constant by decoupling them from a growth in production output or turnover, as proposed in [40], where it is argued that an increase in product sales for a company’s new product models should at least be matched by the increase in the product’s eco-efficiency. Taking the approach further down to the product level to answer the question whether a product is sustainable in absolute terms is not meaningful unless the assessment is communicated together with the fundamental conditions like: x The assumed size of the safe operating space for each of the considered environmental impacts x The number of people assumed to share these spaces x The way in which the spaces have been divided between these people and the products that they consume 6.1. Introducing absolute sustainability measures in LCA Life cycle assessment is a very powerful tool for assessing the environmental impacts associated with products and systems. The life cycle perspective and the broad coverage of environmental impacts in LCA are essential and unique strengths of this tool, but its limitation to relative assessments of environmental sustainability makes it of little use for decision-making on sustainability strategies for societies or
5
6
Michael Z. Hauschild / Procedia CIRP 29 (2015) 1 – 7
companies. However, combination of LCA and absolute boundaries reflecting a sustainable level of environmental impact could be a promising approach. Operating at the level of midpoint impact categories, Bjørn and Hauschild use the normalization step of life cycle impact assessment to introduce absolute boundaries of environmental impact against which the product can be measured. With inspiration in the Planetary boundary concept they take the midpoint impact categories recommended by the European Commission as part of the International reference Life Cycle Data (ILCD) system [6] and develop impact thresholds for those categories where it is possible. First they determine the carrying capacity of exposed ecosystems to the impact. Then they apply the recommended characterization models to translate the thresholds to impact scores that represent the level of impact which will not exceed the threshold. These impact levels are then converted into person equivalents – annual per capita impacts – by dividing by the population number [41]. Person equivalents are frequently used for normalization purposes in LCA, to express the product’s impact as a fraction of the annual per capita impact, but normally the normalization references are derived from the current level of impact, representing our current practices [3]. With normalization references based on carrying capacity, the product’s impact is expressed as a fraction of the personal safe operating space (interpreted as a personal impact budget) in a sustainable society (assuming that all individuals share the total space equally), supporting assessments of whether this share of a person’s space is reasonable for the product in question to occupy and whether this would be possible in a sustainable society where all citizens stay within their safe operating space.
7. Conclusion Industry has a fundamental role to play in meeting the needs of the present in a sustainable manner. For economic growth to be green, it must take place within the finite boundaries of our planet. Industry must address this challenge – not just to perform better but to perform well enough. This requires setting and clearly communicating absolute requirements to the individual industry so it can benchmark its activities not just against its competitors and its own previous offerings but also against the space which will be available to it in a sustainable world. A bottom-up approach can create a vision of a sustainable society and develop guidelines for design of sustainable products in accordance with that vision. The vision needs to embrace predictable future growth in human population numbers and consumption to ensure that what is claimed to be sustainable at the individual product level is truly sustainable, also when the product is consumed by a growing global population. A top-down approach, on the other hand, can start in the determination of the carrying capacity of our global ecosystems towards environmental impact, and from here assess the safe operating space within which we need to operate in order not to exceed the limits for sustainability. To ensure that industry delivers its essential contribution to society and does it within the absolute boundaries of sustainability, we need to introduce a focus on ecoeffectiveness together with the traditional focus on ecoefficiency in our industrial development. First we have the challenge of identifying what are the right things to do and then we must do them right. References
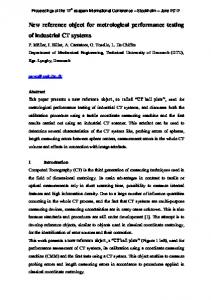
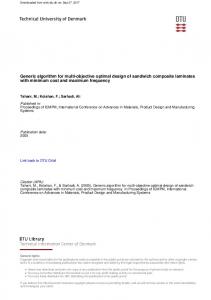
Figure 4 Life cycle impacts from four window frames over a 20-year life span expressed in person equivalents based on current global activities and on the pollution space defined by the carrying capacity of the global environment (b) (based on [42]).
[1] ISO 14045:2012. Environmental management - Eco-efficiency assessment of product systems -Principles, requirements and guidelines. International Organization for Standardization, Geneva. [2] Huppes, G., Ishikawa, M., 2005. Eco-efficiency and its terminology. J. (b) Ind. Ecol. 9(4), p. 43-46. [3] Wenzel, H., Hauschild M.Z., Alting, L., 1997. Environmental assessment of products. Vol. 1 - Methodology, tools and case studies in product development, Kluwer Academic Publishers, Hingham, MA. [4] Finnveden, G., Hauschild, M.Z., Ekvall, T., Guinée, J., Heijungs, R., Hellweg, S., Koehler, A., Pennington, D., Suh, S., 2009. Recent developments in Life Cycle Assessment. J. Environ. Manag. 91(1), p. 1– 21. [5] Hauschild, M. 2005. Assessing environmental impacts in a life cycle perspective. Environ. Sci. Technol. 39(4), p. 81A-88A. [6] Hauschild, M.Z., Goedkoop, M., Guinée, J., Heijungs, R., Huijbregts, M., Jolliet, O., Margni, M., De Schryver, A., Humbert, S., Laurent, A., Sala, S., Pant, R., 2013: Identifying best existing practice for characterization modelling in Life Cycle Impact Assessment. Int. J. LCA 18(3), pp. 683697. [7] Laurent, A., Olsen, S.I., Hauschild, M.Z., 2010. Carbon footprint as environmental performance indicator for the manufacturing industry. CIRP Annals - Manufacturing Technology 59(1), p. 37-40. [8] Laurent, A., Olsen, S.I., Hauschild, M.Z., 2012. Limitations of Carbon Footprint as Indicator of Environmental Sustainability. Environ. Sci. Technol. 46 (7), p. 4100–4108. [9] EC-JRC, 2011. Recommendations based on existing environmental impact assessment models and factors for life cycle assessment in European context. ILCD Handbook—International Reference Life Cycle Data System, European Union EUR24571EN. Available for download at http://publications.jrc.ec.europa.eu/repository/handle/JRC61049 (accessed 08 12 2014).
Michael Z. Hauschild / Procedia CIRP 29 (2015) 1 – 7 [10] ISO 14044:2006. Environmental management—life cycle assessment— requirements and guidelines. International Organization for Standardization, Geneva. [11] Duflou, J.R., Sutherland, J.W., Dornfeld, D., Herrmann, C., Jeswiet, J., Kara, S., Hauschild, M. and Kellens, K., 2012. Towards Energy and Resource Efficient Manufacturing: A Processes and Systems Approach. CIRP Annals - Manufacturing Technology 61(2), pp. 678-700. [12] Bhander, G.S., Hauschild, M. and McAloone, T., 2003. Implementing Life Cycle Assessment in product development. Environmental Progress, 2(4), pp. 255-267. [13] Hauschild, M., Jeswiet, J. and Alting, L., 2004. Design for environment – do we get the focus right? Annals of the CIRP, 53(1), pp. 1-4. [14] Remmen, A., Jensen, A.A., Frydendal, J., 2007. Life Cycle Management - A business guide to sustainability. UNEP-SETAC Life Cycle Initiative, Paris. [15] ISO 14024:1999. Environmental labels and declarations — Type I environmental labelling — Principles and procedures. International Organization for Standardization, Geneva. [16] ISO 14025:2006. Environmental labels and declarations — Type III environmental declarations — principles and procedures. International Organization for Standardization, Geneva. [17] Gutowski, T., 2011. Manufacturing and the Science of Sustainability. In Hesselbach, J. and Herrmann C. (eds.): Glocalized Solutions for Sustainability in Manufacturing. Proceedings of the 18th CIRP International Conference on Life Cycle Engineering, Technische Universität Braunschweig, Braunschweig, Germany, May 2nd-4th, 2011. Springer-Verlag, Berlin Heidelberg, pp. 32-39. [18] Ausubel, J.H., Marchetti, C., 1997. Electron: Electrical Systems in Retrospect and Prospect. Daedalus 125(3), pp.139-169. [19] Tsao, J.Y., Saunders, H.D., Creighton, J.R., Coltrin, M.E., Simmons, J.A., 2010. Solid-state lighting: an energy-economics perspective. J. Phys. D: Appl. Phys. 43, 354001. [20] Hertwich, 2005. Consumption and the rebound effect - an Industrial Ecology perspective. J. Indus. Ecol. 9(1-2), pp. 85-98. [21] Ehrlich, P. and J. Holdren., 1971. Impact of population growth. Science 171, pp. 1212–1217. [22] Commoner, B., 1972. The environmental cost of economic growth. In Ridker, R.G. (ed.) Population, Resources and the Environment, pp. 33963. U.S. Government Printing Office, Washington, DC. [23] Stocker, T.F., D. Qin, G.-K. Plattner, M. Tignor, S.K. Allen, J. Boschung, A. Nauels, Y. Xia, V. Bex and P.M. Midgley (eds.), 2013. Climate Change 2013: The Physical Science Basis. Contribution of Working Group I to the Fifth Assessment Report of the Intergovernmental Panel on Climate Change. Cambridge University Press, Cambridge, United Kingdom and New York. [24] Von Weizsäcker, E., Lovins, A.B., Lovins, L.H., 1998. Factor Four: Doubling wealth, halving resource use - a report to the Club of Rome. Earthscan, U.K. [25] Schmidt-Bleek, F., 2008. Factor 10: The future of stuff. Sustainability: Science, Practice, & Policy 4(1), p.1-4. [26] Factor 10 Club, 1994. Carnoules declaration. Wuppertal Institute for Climate, Environment and Energy, Wuppertal, Germany. [27] Reijnders, L., 1998. The Factor X debate: Setting targets for ecoefficiency. J. Ind. Ecol. 2(1), pp. 13–22. [28] Regulation (EC) No 66/2010 of the European Parliament and of the Council of 25 November 2009 on the EU Ecolabel. [29] World Commission on Environment and Development, 1987. Our common future. Oxford University Press, Oxford. [30] Maslow, A., 1954. Motivation and personality. Harper and Row Publishers Inc. U.S. [31] McDonough, W.; Braungart, M., 2002. Cradle to Cradle – Remaking the way we make things. North Point Press. New York. [32] Braungart, M., McDonough, W., Bollinger, A., 2007. Cradle-to-cradle design: creating healthy emissions - a strategy for eco-effective product and system design. J. Clean. Production 15(13-14), pp. 1337-1348. [33] Ellen MacArthur Foundation, 2013. Towards the circular economy. for download at Available http://www.ellenmacarthurfoundation.org/books-and-reports (accessed 08 12 2014) [34] Bjørn, A., Hauschild, M.Z., 2013. Absolute versus relative environmental sustainability – What can the Cradle to Cradle and eco-
efficiency concepts learn from each other? J. Ind. Ecol. 17(2), pp. 321332. [35] Bjørn, A., Hauschild, M.Z., 2011. Cradle to Cradle and LCA – is there a conflict? In Hesselbach, J. and Herrmann C. (eds.): Glocalized Solutions for Sustainability in Manufacturing. Proceedings of the 18th CIRP International Conference on Life Cycle Engineering, Technische Universität Braunschweig, Braunschweig, Germany, May 2nd-4th, 2011. SpringerVerlag, Berlin Heidelberg, pp. 599-605. [36] Rockström, J, et al., 2009. A safe operating space for humanity. Nature 461(7263), p. 472–475. [37] Nykvist, B., Persson, Å., Moberg, F., Persson, L., Cornell, S., Rockström, J., 2013. National Environmental Performance on Planetary Boundaries - A study for the Swedish Environmental Protection Agency. Report 6576, Stockholm. [38] World Business Council on Sustainable Development. Action2020 Overview, http://m.action2020.org/Action2020-24_03.pdf (accessed 08 12 2014) [39] Marsh, M., 2013. The 3% solution - Driving profits through carbon reduction. Carbon Disclosure Project and World Wildlife Fund (US). [40] Kim, S-J., Kara, S., 2014. A design assessment methodology for predicting the total environmental impact of product technologies. CIRP Annals - Manufacturing Technology 63(1), pp. 25-28. [41] Bjørn, A, Hauschild, M.Z., 2015. Introducing carrying capacity based normalization in LCA: framework and development of midpoint level references. Int. J. LCA. In review. [42]Bjørn, A., Hauschild, M.Z., 2014. Proposal for a new normalization reference in LCA based on “safe operating space”: presentation of framework and global factors at midpoint level. SETAC Europe 24th annual meeting: Science across bridges, borders and boundaries, Basel 11-15 May 2014.
7