Nov 23, 2016 - health problem of great importance [14, 13, 39]. Devices that help .... in 2015. The history of falls was determined with a single question: âhave you fallen within the past .... Figure 2: Timed Up and Go test (TUG) illustration using a ...... Patterns and Images Tutorials (SIBGRAPI-T), pages 1â10. IEEE, 2011. 22 ...
arXiv:1609.05339v1 [cs.CY] 17 Sep 2016
Feature Extraction from Double Task Timed Up and Go Signals Applied to the Identification of Elderly Fallers Moacir Ponti1 , Patricia Bet2 , Caroline L. Oliveira2 , and Paula C. Castro2 1
ICMC, Universidade de S˜ ao Paulo – S˜ ao Carlos/SP, Brazil — ponti@ usp. br 2 DGero, Universidade Federal de S˜ ao Carlos, S˜ ao Carlos/SP, Brazil
September 20, 2016 Abstract Devices and sensors for identification of fallers can be used to implement actions to prevent these falls and to allow the elderly to live an independent life while reducing the long-term care costs. In previous studies the feature extraction is often dependent on step detection, the collected datasets are often unavailable, and a large number of features are attempted in order to sufficiently represent the faller and non-faller classes. In this study we present results of feature extraction on accelerometer data with the aim of identifying fallers among a group of health elderly. The features are extracted from three different Timed Up and Go (TUG) tests combined with simultaneous manual and cognitive tasks. As a result, a set of features is described to discriminate fallers from non-fallers based on the segmentation of the TUG trials, in particular using TUG with cognitive task, while conventional functional tests fail to do so. In addition, we show that the features can be generalized for unseen subjects, demonstrating the relevance of the study. We concluded that features extracted from segmented TUG trials acquired with simultaneous tasks has potential to improve performance when identifying fallers via accelerometer sensors.
1
1
Introduction
The prevalence of elderly people suffering from falls reveals a serious public health problem. According to the World Health Organization [1], more than a third of the elderly have a least one fall per year. Half of those who fell once are likely to experience other falls in the following months, leading to pain, functional limitations, morbidities and cost increases with healthcare [32]. These factors put falls as a public-health problem of great importance [15, 13, 37]. Devices that help identify fallers can be used to develop programs and implement actions to prevent these falls and to allow the elderly to live an independent life while reducing the long-term care costs. Signals obtained by small wearable sensors are widely studied for biomedical purposes. Because those are designed to be comfortable to use, those signals can be acquired in high sampling rates and even for long periods, making them a suitable choice to assess aging in several applications, including fall risk and faller identification for ageing studies [36, 47]. Because of the strong appeal of the application, several papers report measures and features that can be extracted from inertial sensors — such as gyroscopes and accelerometers — and also laser, cameras and devices with multiple sensors [39, 48, 27]. In this context the accelerometers are specially valuable due to be small, cheap, easy to wear and with low power consumption when compared to more complex devices. In this study we are interested on the analysis of accelerometer data obtained from a single triaxial sensor to identify an elderly faller. Among the gait-related studies using accelerometer sensors, Pogorelc et al. [33, 34] focus on detecting health problems of the elderly such as Parkinsons disease and others, from human gait. Capela et al. [12] address activity identification on elderly. However, while the detection of fall events was extensively studied [5, 4], the identification of fallers and non-fallers via accelerometer data remains an open problem [19]. In a recent survey about fall risk, the authors pointed out the important role of the sitting and standing movements in the continuous monitoring of functional mobility [19]. Indeed, recent studies about fall and technology often apply Timed Up and Go (TUG) tests with one or more accelerometer sensors [18, 17, 25, 21] and also gyroscopes [22] in order to investigate gait behaviour and falls, often in hospitalized or disabled participants. One of the most interesting related studies uses of a pair of accelerometers to collect data freely in daily-life activities for 3 days in order to extract features related to fall risk [47]. However, it is based on the detection of steps, which we want to avoid in our study. 2
Machine learning methods were also shown to be useful on assisted-living tools for elderly [36, 24], by using classification [2], unsupervised analysis [48], anomaly detection [28, 14] or even systems involving complex data and classification methods [43]. Despite the recent efforts, some questions remain open such as the sampling rate and a measure of elderly activity [26], that were already studied for healthy adults but not yet stablished for elderly gait and fall patterns [29, 40]. Also, studies on fall risk and faller identification often do not release the dataset for reproducibility in those studies, and their sample are composed of non-stratified groups with respect to gender and age, often not providing information on functional mobility of the subjects [19]. Finally, as we show in the results, the identification of fallers among a sample of health elderly is challenging and conventional functional tests fail to provide a threshold for screening. In this paper, we present results of feature extraction on accelerometer data with the aim of identifying fallers among a group of health elderly (socially engaged, robust, active, non-obese, with preserved cognition). The fact that the sample is composed by health elderly makes it more difficult to identify fallers by using regular functional and screening tests such as the TUG time trial [3]. We study the sampling rate for the acquisition and also explore machine learning methods in order to investigate how well the extracted features can be generalized for unknown subjects. Our main contributions are: 1. the collection of an open dataset for faller identification, not currently available in the literature, allowing reproducibility and comparison with future studies; 2. the study of faller identification problem using: TUG single task, TUG manual task and TUG cognitive task, not yet explored in the literature; 3. the description of features based on TUGs and differences between TUGs using a single accelerometer sensor that can discriminate fallers from non-fallers while conventional functional tests cannot. As far as we know there is no previous study including the items 2-3 described above, i.e. that compares gait features using TUG variations for the purpose of elderly faller identification using a single accelerometer sensor, independently of step detection and investigating adequate sampling rates. The paper is organized as follows. In section 2 we provide the background for concepts such as sampling, feature extraction from accelerometer data and the Timed Up and Go tests used in the data acquisition. The method 3
for acquiring and analysing the data is described in Section 3. The feature analysis and discussion of results are given in Section 4. Concluding remarks are presented in Section 5.
2 2.1
Technical Background Timed Up and Go tests (TUG)
The Timed Up and Go Test (TUG) is widely used in both clinical and epidemiological studies; the time taken to complete the test is correlated to level of functional mobility and associated with a past history of falls [7]. The TUG is also used to assess the risk of falls and to select interventions for elderly individuals according to the updated guidelines of the American and British Geriatric Societies for the Prevention of Falls [23]. For Brazilian elderly individuals, the 12.47 seconds cut-off point is adopted as a predictive value for fall [3]. In this study, three variants of TUGs are used. The regular one we refer as single task or only TUG, requiring a participant to stand up from a chair, walk 3 meters, turn, walk back, and sit down, while the time taken to perform the task is recorded using a stopwatch. In addition the TUG double task is adopted in two different approaches: TUG Manual (TUG-M), following the same procedure as the regular TUG, but carrying a cup filled with water; and TUG Cognitive (TUG-C), in which participants are asked to respond to continuous simple subtraction questions while performing the TUG test [42] [41].
2.2
Feature extraction from accelerometer signals
Features extracted from accelerometer data often tries to capture the gait characteristics such as speed, stability and descriptive statistics; information theory features such as the information complexity and entropy; an frequency features such as peak frequencies and harmonics [39, 31]. In this study we choose to use only one accelerometer, as recommended by Ejupi et al. [19], and three TUGs (TUG, TUG-M and TUG-C). Therefore, it is possible to extract features considering the whole signal but also considering individually each TUG trial. Features of time, information theory and frequency are used in this study as described later in Section 3.4.
4
2.3
Sampling rate from human gait
By the Nyquist-Shannon sampling theorem, if a signal is bandlimited by a frequency B, a sampling rate of 2B samples per second is needed in order to perfectly reconstruct the signal [30]. Human gait on healthy adults can be well represented by frequencies up to 15Hz for walking, running and jumping [8]. There is still little evidence about the adequate bandwidth for acquiring accelerometer signals from elderly in activities such as walking, sitting, standing and free movement [19]. Nevertheless, commercial devices often have a maximum sampling rate of 100Hz and by default acquire data at 40Hz [9, 35]. After 2010, studies on elderly fall risk and fall detection used sampling rates ranging from 40Hz [25] to 100Hz [47, 17], and in one study at 200Hz [18]. Because frequency features are important to the investigation of fall in older adults, and since we want to extract features that take into account gait in old age with unknown bandwidth, it is desirable to sample at a higher rate to observe frequency features without the risk of aliasing, as described later. Acquisition triaxial data x, y, z TUG, TUG-M, TUG-C 2
Signal fusion p
s=
x2 + y 2 + z 2
Pre-processing (a) LP filter 100Hz (b) TUG segmentation
Feature extraction 32 features using: NTL,PSP,PSE,PSPF
Statistical test Mann-Whitney U-test using each feature
2.5
2 1
1.5
0
1
-1 0.5
-2
Sampling analysis
Machine learning
Relevant bandwidth for elderly gait
SVM feature ranking SVM classification
0 0
5000
10000
15000
0
5000
10000
15000
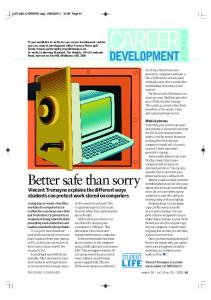
Figure 1: Overall picture of the methodology: the triaxial signal is collected and a fusion is performed to keep the methods orientation-independent; then the signal is filtered using Butterworth method, and each TUG is segmented, and 32 features are extracted; the signal is analysed with respect to the sampling rate, the extracted features are studied using a statistical test, a feature ranking and a classification experiment.
3
Method
The overall scheme is shown in Fig 1, in which the two first steps are related to the data acquisition; the following two are signal pre-processing and feature extraction, and highlighted in darker blue shade are the results obtained using signal analysis, statistical tests and machine learning.
5
3.1
Study Subjects
This section describes the subjects sampling, not to be confused with the accelerometer sampling rate (for which we give details in Section 3.2). This study enrolled 41 community-dwelling elderly divided as: 19 fallers and 22 non-fallers volunteer participants’ residents in S˜ao Carlos/SP, Brazil, in 2015. The history of falls was determined with a single question: “have you fallen within the past year?”. Data from five participants were lost due to acquisition issues; thus, this study final sample is 18 fallers and 18 non-fallers. The study protocol (482.306/2013) and informed consent form received ethics approval from the UFSCar Ethic Committee on Human Experimentation. The project was advertised at Third Age groups, for a population of 468 elderly and the volunteers received a written informed consent concerning conduct of the survey. Participation was voluntary and it was explained that the volunteer could leave the study whenever he/she wanted without suffering any loss or consequence. In the open dataset, only the raw accelerometer signal, the gender and the label (faller or non-faller) are available, while the remaining variables are not available in order to assure complete anonymity of participants. All the participants were refer to free Physical Therapy and Gerontology intervention after this study. The eligibility criteria for the study included participants being older than 60 years; possessing the ability to stand up from a chair with arms without other person’s help and to walk independently, without aid device. The exclusion criteria were: amputation and/or use of lower limb prosthesis or other device that modifies the gait pattern; risk of cognitive impairment confirmed by the mini-mental state examination (MMSE) [10], since it increases fall risk [15] and presence of any important risk factor that compromises safety, perceived by the evaluator, such as blood pressure lower than 90/60 or higher than 140/100 mmHg or angina. All the participants were eutrophic and none of them was obese [46]. The Table 1 summarizes the demographic and functional mobility characteristics of this study participants: MMSE (mini-mental state examination), FES (Falls Efficacy Scale—Brazil), the three TUGs: (i) single task, (ii) TUG-M (double task manual), (iii) TUG-C (double task cognitive). The TUG results are shown in seconds. The groups were compared using the t-test for all variables, except for the Gender, for which a Fisher’s exact test was used. The groups Faller and Non-faller are paired to allow comparison. However, the groups do not have significant differences considering the demographic characteristics. This contrasts with the literature in which fall prevalence increases with age [13] and that, as they age, women are more likely to 6
Table 1: Sample description, including the results of MMSE, FES-1-Brazil, TUG, TUG-M, TUG-C and p-values for statistical tests comparing the groups: non-faller and faller. non-faller faller p-value n 18 18 Age µ±σ 70.94 ± 6.69 75.25 ± 8.20 0.102a 10 (56%) 15 (83%) Female 0.146b Gender Male 8 (44%) 3 (17%) 26.46 ± 4.35 23.75 ± 3.93 0.117a MMSE µ±σ FES µ±σ 24.62 ± 7.74 21.00 ± 6.55 0.222a 9.026 ± 2.376 10.395 ± 2.713 0.094a TUG (s) µ±σ TUG-M (s) µ ± σ 9.790 ± 3.016 10.974 ± 2.713 0.232a TUG-C (s) µ ± σ 13.806 ± 5.962 17.016 ± 6.250 0.130a a — p-values for t-test; b — p-value for Fisher’s exact test.
become fallers and to experience negative outcomes from a fall episode than men [37]. Both groups are similar also regarding the functional mobility variables. According to the Falls Efficacy Scale—Brazil (FES-I-Brazil) [11], participants from both groups feel little concern with the possibility of falling when carrying out functional activities. Moreover, while it is expected that the fallers conduct the TUG single task in more than 12.47 seconds [3], this particular group of Fallers equates to non-fallers for TUG execution time. Even for TUG Manual and TUG Cognitive times, both groups can be considered similar. Considering only the functional mobility tests would not be possible to discriminate between fallers and non-fallers. This is probably because the participants are involved in regular physical and cognitive activities and can be considered in successful aging [38]. In addition, the control variables addressed by the exclusion criteria are related to increases in fall [15] [44]. Therefore, other methods are needed to identify fallers in this scenario.
3.2
Signal acquisition and preprocessing
A single triaxial accelerometer sensor (Analog Devices ADXL362) was used to acquire the signal using a datalogger. Each participant was ask to wear the sensor using an elastic belt around his/her waist (in front of the mass centre).
7
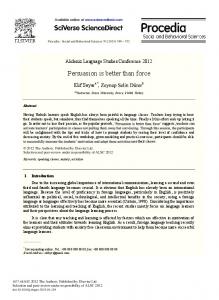
(a) non-faller
(b) faller
Figure 2: Examples of raw signals s(t) acquired from (a) non-faller and (b) faller, as used in our study. The time axis represents the points obtained by an acquisition at a 200Hz sampling rate. Sampling rate the data was acquired using a 200Hz sampling rate. As mentioned in Section 2.3, related studies in general samples at some rate between 40Hz [25] and 100Hz [47, 17], or also at 200Hz but removing higher frequencies afterwards using a low pass filter on 20Hz [18]. However, we believe it is adequate to use the higher sampling rate as possible due to the arguments discussed also in Section 2.3. Signal fusion all feature extraction and measurements are obtained from s(t), which is computed as: p s(t) = x(t)2 + y(t)2 + z(t)2 ,
where x(t), y(t) and z(t) are the accelerometer data acquired from the axis x, y and z, respectively. Because we do not assume a fixed position of the sensor, the squared sum of each axis allows comparing different outputs regardless the sensor orientation. Note that the discrimination between fallers and non-fallers is not trivial by looking only at the signals s(t), as the examples shown in Fig 2. Therefore, pre-processing and frequency analysis are needed to extract discriminative features, as we will describe in the following sections.
Low-pass filter in studies with accelerometers it is common to apply a Butterworth low-pass filter in order to supress noise using bandwidth values such as: 50Hz [22], 20Hz [18] and 5Hz [17]. Human gait for healthy adults 8
was found to be well characterized by frequencies up to 15Hz for walking, running and jumping [8, 26], but there is not enough evidence on the elderly specially when doing tasks such as sitting and standing (as in a TUG test). Since the use of an arbitrary low pass filter may hamper the analysis, we use a Butterworth filter of 100Hz as an anti-aliasing filter for frequencies higher than (200/2)Hz, because it has the least attenuation over the desired frequency range [6].
3.3
Signal segmentation
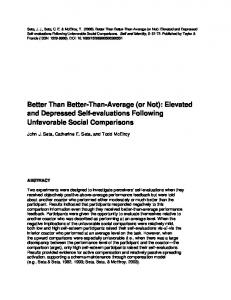
Because one of the contributions of this study is to acquire data from 3 TUGs, each one with an additional task, we have to separate those trials by segmenting the signal before the feature extraction step. Although it is possible to consider other segmentation methods, we present a simple algorithm to segment the consecutive TUG trials. The segmentation is described in Algorithm 1, which basically computes the mean to be subtracted from the input signal (lines 1-2), applying a rolling median filter in order to reduce variance within each TUG (line 3) and then, for each half second, sums the values contained in the processed signal (lines 4-5), then it thresholds the data by using this sum (lines 6-9). Finally, each segment is labelled and this result is returned (lines 12-13). This algorithm succeeded to segment all but two signals, for which the segmentation had to be corrected manually. Algorithm 1 Signal segmentation Require: k to compute the rolling median filter 1: s ¯ ← mean(s) 2: s ← s − s ¯ 3: u ← rollingMedianFilter(s, k) 4: for each half second h in u do P 5: g(h) ← h u(h) 6: if g(k) > s¯ then 7: l(k) = 1 8: else 9: l(k) = 0 10: end if 11: end for 12: assign distinct labels to each segment in l 13: return l An example of segmentation is shown in Fig 3, in which the regions of 9
Figure 3: Signal segmentation example of a faller subject. The grey overlaid regions represent the segmented TUG signals. the signal outside the grey regions will be ignored in the feature extraction step.
3.4
Features
Let n be the size of a given signal s, and its power spectrum S(ω) = |F(s)|2 . Five types of features are used: one time domain feature, and four frequency domain features as follows. 1. Power Spectral Entropy (PSE): the entropy of the power spectrum of the signal. It represents a measure of energy compaction in transform coding [20], in our case how much acceleration energy the signal contains. X f1 = − S(ω) · log(S(ω) + �), (1) ω
where � = 0.001 to avoid log(0);
2. Power Spectrum Peak (PSP): computed by finding the three highest values of S. This third feature represents the amplitudes of the funda-
10
mental frequencies of the gait: f2,1 = max S(ω);
(2)
f2,2 = max S(ω) − f2,1 ;
(3)
f2,3 = max S(ω) − f2,2 .
(4)
ω
ω
ω
3. Power Spectrum Peak Frequency (PSPF): computed by finding the frequency related to the higher value of S. This feature represents the first harmonics of the gait, which is related to the overall movement speed: f3,1 = argmax S(ω);
(5)
ω
f3,2 = argmax S(ω) − f3,1 ;
(6)
ω
f3,3 = argmax S(ω) − f3,1 − f3,2 .
(7)
ω
4. Weighted Power Spectrum Peak (WPSP): computed using the PSP values weighed by the PSPF values f4,1 = f2,1 · f3,1 ; f4,2 = f2,2 · f3,2 ; f4,3 = f2,3 · f3,3 .
(8) (9) (10) (11)
5. Number of Steps (NS): counted both manually and by a accelerometerbased pedometer. Each feature described above is extracted from the following signals: s) The whole signal (containing the three TUG trials); t) The first TUG trial (TUG); m) The second TUG trial (TUG-M); c) The third TUG trial (TUG-C). Thus, we have a total of 44 features, i.e. 11 features extracted from each one of the 4 signals, that compose the final feature vector
11
s s s xi = {f1s ; f2,(1:3) ; f3,(1:3) ; f4,(1:3) ; f5s ; t t t f1t ; f2,(1:3) ; f3,(1:3) ; f4,(1:3) ; f5t ; m m m f1m ; f2,(1:3) ; f3,(1:3) ; f4,(1:3) ; f5m ; c c c f1c ; f2,(1:3) ; f3,(1:3) ; f4,(1:3) ; f5c }
Because we are also interested in understanding how the TUGs with additional tasks are different from the regular one, we also computed the Euclidean distance dj (., .) for each feature j related to the full signal (s) and the first TUG (t), to the two other TUGs — (m) motor task, (c) cognitive task: q� �2 fjs − fjt , q� �2 fjs − fjm , dj (s, m) = q� �2 dj (s, c) = fjs − fjc , q� �2 dj (t, m) = fjt − fjm , q� �2 fjt − fjc , dj (t, c) = dj (s, t) =
(12) (13) (14) (15) (16)
for each feature j = 1 · · · 11. We then test the distances in order to see if they showed significant different between the groups.
3.5
Feature analysis
In order to look for the best features we use two approaches. Statistical test — Mann-Whitney U-test is carried out in each feature in order to compare the faller and non-faller groups. The U test was chosen because we do not have information about the distribution of the variables. We individually evaluate each variable/feature to look for the ones that are able to discriminate fallers from non-fallers, i.e. rejects the null hypothesis of equal means. Machine learning — we used the SVM classifier method with a radial basis function (RBF) kernel, using a 6-fold cross validation experimental setup. The fallers are considered as belonging to the positive class, and nonfallers to the negative class. Because we have 36 subjects, for each fold it will train with 30 and test with the six (6) remaining subjects. The use of 6 12
folds is a good compromise between the estimator quality while keeping the division exact [16]. The metaparameters for the SVM training were found by a leave-one-out cross validation grid search inside the training set of each experiment. Our study is not focused on classifier methods, but rather on discussing sampling rate and features extracted from TUG signals. Therefore, SVM is a fair choice since it is the one to provide the stronger learning guarantees according to the Empirical Risk Minimization Principle, considering the empirical risk (error inside training set) as an estimator for the expected risk [45]. The classification results provide insights about the quality of the feature space by investigating if a model obtained with the training data can be generalized for unlabelled ones on the test set.
3.6
Reproducibility
Upon the publication of the paper, the raw collected data and the code used to produce the results will be available at a public repository1 .
4
Results and Discussion
4.1
U-tests in individual features
By using the statistical test, we can assess the capability of a given feature to reject the null hypothesis of equal means between the faller and non-faller groups. The mean of each group (µ+ fallers, µ− non-fallers) and the p-value for the statistical significant features (for p ≤ 0.05) are shown in Table 2. The only variables showing significance were those computed using only the TUG-C (c), namely the features PSE and WPSP. In addition, we could find other variables by using the distances between features; the significant ones were: PSE and PSP between the whole signal (s) and the TUG-C (c), PSPF between the TUG (t) and the TUG-M (m), and finally the WPSP between the TUG-M (m) and the TUG-C (c). Note that non-fallers in average completed the TUGs faster than fallers (see Table 1), but there was no significance between the means. In previous works speed gait only was also shown to be insufficient to identify fallers [35]. We believe that the sequence of activities in a TUG test (standing, walking, turning, walking, sitting) carries a richer composition of frequencies, which 1
The code is currently available at gait-analysis-for-faller-identification
13
http://bitbucket.org/moacirponti/
we believe was captured by both PSE and WPSP. According to our results, by pre-processing the TUG signals and extracting both individual frequencies features (PSE, WPSP) and other comparative features, it is possible to obtain a set of features with significant difference between the fallers and non-fallers. Table 2: Features that produced statistical difference when comparing the means of the faller and non-faller groups µ+ (fallers) µ− (non-fallers) p-value PSE-c 9.52 ± 2.5 11.95 ± 2.9 0.014 1.00 ± 0.7 1.73 ± 0.9 0.022 WPSP-c,2 WPSP-c,3 1.61 ± 0.6 2.30 ± 0.8 0.009 dPSE (s, c) 5.37 ± 2.48 3.55 ± 2.10 0.029 dPSP (s, c) 0.024 ± 0.01 0.013 ± 0.01 0.014 dPSPF (t, m) 6.22 ± 2.50 6.13 ± 4.28 0.050 dWPSP (m, c) 0.444 ± 0.32 0.901 ± 0.70 0.043
5
Conclusions
In this paper, we address the problem of faller identification in a sample of active elderly that cannot be classified into fallers and non-fallers by using only conventional tests. While the features extracted from the whole signal are not discriminative (from both the statistical test and the machine learning perspectives), features extracted from a double (cognitive) task TUG, and comparative features based on the distance between TUGs shows statistical difference. A limitation of the study is the sample size (36 participants). In addition, due to the intra-class variability of the data, it is not possible to generalize this result for a broader population. However, the results does indicate that features based on double-task TUGs are able to better discriminate faller and non-fallers, even in a scenario when all standard tests and measures were insufficient to show significant differences. Our methods could be used within a free gait data collection study by first detecting sitting and standing activities, which are present in TUG tests, and processing those signals in order to extract the features. Future studies can also explore orientation detection and consider each axis separately to obtain more information for the gait analysis.
14
References [1] World Health Organization. Ageing and Life Course Unit. WHO global report on falls prevention in older age. World Health Organization, 2008. [2] M.V. Albert, K. Kording, M. Herrmann, and A. Jayaraman. Fall classification by machine learning using mobile phones. PLoS ONE, 7(5), 2012. [3] Tiago S Alexandre, D´ebora M Meira, Nat´alia C Rico, and Simone K Mizuta. Accuracy of timed up and go test for screening risk of falls among community-dwelling elderly. Brazilian Journal of Physical Therapy, 16(5):381–388, 2012. [4] Moeness G Amin, Yimin D Zhang, and Boualem Boashash. Highresolution time-frequency distributions for fall detection. In SPIE Defense+ Security, pages 94611B–94611B. International Society for Optics and Photonics, 2015. [5] Fabio Bagal`a, Clemens Becker, Angelo Cappello, Lorenzo Chiari, Kamiar Aminian, Jeffrey M Hausdorff, Wiebren Zijlstra, and Jochen Klenk. Evaluation of accelerometer-based fall detection algorithms on real-world falls. PloS one, 7(5):e37062, 2012. [6] Bonnie C Baker. Anti-aliasing, analog filters for data acquisition systems. AN699, Microchip Technology Inc, 1999. [7] Olivier Beauchet, B Fantino, Gilles Allali, SW Muir, M Montero-Odasso, and C Annweiler. Timed up and go test and risk of falls in older adults: a systematic review. The journal of nutrition, health & aging, 15(10):933– 938, 2011. [8] A Bhattacharya, EP McCutcheon, E Shvartz, and JE Greenleaf. Body acceleration distribution and o2 uptake in humans during running and jumping. Journal of Applied Physiology, 49(5):881–887, 1980. [9] JM Broderick, J Ryan, DM O’Donnell, and J Hussey. A guide to assessing physical activity using accelerometry in cancer patients. Supportive Care in Cancer, 22(4):1121–1130, 2014. [10] Sonia MD Brucki, Ricardo Nitrini, Paulo Caramelli, Paulo HF Bertolucci, and Ivan H Okamoto. Sugest˜oes para o uso do mini-exame do estado mental no Brasil. Arq Neuropsiquiatr, 61(3B):777–81, 2003.
15
[11] Fl´avia FO Camargos, Rosˆangela C Dias, Jo˜ao Dias, and Maria TF Freire. Cross-cultural adaptation and evaluation of the psychometric properties of the falls efficacy scale-international among elderly brazilians (FES-I-BRAZIL). Brazilian Journal of Physical Therapy, 14(3):237–243, 2010. [12] N.A. Capela, E.D. Lemaire, and N. Baddour. Feature selection for wearable smartphone-based human activity recognition with able bodied, elderly, and stroke patients. PLoS ONE, 10(4), 2015. [13] Christine T Cigolle, Jinkyung Ha, Lillian C Min, Pearl G Lee, Tanya R Gure, Neil B Alexander, and Caroline S Blaum. The epidemiologic data on falls, 1998-2010: more older americans report falling. JAMA internal medicine, 175(3):443–445, 2015. [14] G.B.P. Costa, M. Ponti, and A.C. Frery. Partially supervised anomaly detection using convex hulls on a 2d parameter space. In Partially Supervised Learning, pages 1–8. Springer, 2013. [15] K. Delbaere, J.C.T. Close, H. Brodaty, P. Sachdev, and S.R. Lord. Determinants of disparities between perceived and physiological risk of falling among elderly people: cohort study. BMJ, 341, 2010. [16] Luc Devroye, L´aszl´o Gy¨orfi, and G´abor Lugosi. A probabilistic theory of pattern recognition, volume 31. Springer, 2013. [17] Emer P Doheny, Cathal Walsh, Timothy Foran, Barry R Greene, Chie Wei Fan, Clodagh Cunningham, and Rose Anne Kenny. Falls classification using tri-axial accelerometers during the five-times-sit-tostand test. Gait & posture, 38(4):1021–1025, 2013. [18] Takehiko Doi, Soichiro Hirata, Rei Ono, Kota Tsutsumimoto, Shogo Misu, and Hiroshi Ando. The harmonic ratio of trunk acceleration predicts falling among older people: results of a 1-year prospective study. J Neuroeng Rehabil, 10(7), 2013. [19] Andreas Ejupi, Stephen R Lord, and Kim Delbaere. New methods for fall risk prediction. Current Opinion in Clinical Nutrition & Metabolic Care, 17(5):407–411, 2014. [20] J.D. Gibson. What is the interpretation of spectral entropy? In Proceedings of the IEEE Int Symp on Information Theory, page 440, 1994.
16
[21] Matthias Gietzelt, Gerhard Nemitz, Klaus-Hendrik Wolf, Hubertus Meyer Zu Schwabedissen, Reinhold Haux, and Michael Marschollek. A clinical study to assess fall risk using a single waist accelerometer. Informatics for health and social care, 34(4):181–188, 2009. [22] Barry R Greene, Alan O Donovan, Roman Romero-Ortuno, Lisa Cogan, Cliodhna Ni Scanaill, Rose Kenny, et al. Quantitative falls risk assessment using the timed up and go test. Biomedical Engineering, IEEE Transactions on, 57(12):2918–2926, 2010. [23] RA Kenny, Laurence Z Rubenstein, Mary E Tinetti, Kathryn Brewer, Kathleen A Cameron, Liz Capezuti, David P John, Sallie E Lamb, Finbarr Martin, Paul H Rockey, et al. Summary of the updated american geriatrics society/british geriatrics society clinical practice guideline for prevention of falls in older persons. Journal of the American Geriatrics Society, 59(1):148–157, 2011. [24] D.T.H. Lai, R.K. Begg, and M. Palaniswami. Computational intelligence in gait research: A perspective on current applications and future challenges. IEEE Transactions on Information Technology in Biomedicine, 13(5):687–702, 2009. [25] Ying Liu, Stephen James Redmond, Ning Wang, Fernando Blumenkron, Michael R Narayanan, and Nigel H Lovell. Spectral analysis of accelerometry signals from a directed-routine for falls-risk estimation. Biomedical Engineering, IEEE Transactions on, 58(8):2308–2315, 2011. [26] Andrea Mannini, Stephen S Intille, Mary Rosenberger, Angelo M Sabatini, and William Haskell. Activity recognition using a single accelerometer placed at the wrist or ankle. Medicine and science in sports and exercise, 45(11):2193–2203, 2013. [27] Alexandre Millecamps, Kristin A Lowry, Jennifer S Brach, Subashan Perera, Mark S Redfern, and Ervin Sejdi´c. Understanding the effects of pre-processing on extracted signal features from gait accelerometry signals. Computers in Biology and Medicine, 62:164–174, 2015. [28] Masud Moshtaghi, Ingrid Zukerman, and R Andrew Russell. Statistical models for unobtrusively detecting abnormal periods of inactivity in older adults. User Modeling and User-Adapted Interaction, 25(3):231– 265, 2015.
17
[29] Susan L Murphy. Review of physical activity measurement using accelerometers in older adults: considerations for research design and conduct. Preventive medicine, 48(2):108–114, 2009. [30] H. Nyquist. Certain topics in telegraph transmission theory. Transactions of theAmerican Institute of Electrical Engineers, 47(2):617–644, 1928. [31] Irena Orovi´c, Srdjan Stankovi´c, and Moeness Amin. A new approach for classification of human gait based on time-frequency feature representations. Signal Processing, 91(6):1448–1456, 2011. [32] Mika Palvanen, Pekka Kannus, Maarit Piirtola, Seppo Niemi, Jari Parkkari, and Markku J¨arvinen. Effectiveness of the chaos falls clinic in preventing falls and injuries of home-dwelling older adults: A randomised controlled trial. Injury, 45(1):265–271, 2014. [33] B. Pogorelc and M. Gams. Diagnosing health problems from gait patterns of elderly. Conference proceedings : ... Annual International Conference of the IEEE Engineering in Medicine and Biology Society. IEEE Engineering in Medicine and Biology Society. Conference, pages 2238– 2241, 2010. [34] B. Pogorelc and M. Gams. Detecting gait-related health problems of the elderly using multidimensional dynamic time warping approach with semantic attributes. Multimedia Tools and Applications, 66(1):95–114, 2013. [35] M Ponti, CL Oliveira, P Bet, and PC Castro. Learning features on acceleration data for fall risk computer-aided diagnosis. In Gerontologist, volume 55, pages 45–45. Oxford Univ, 2015. [36] Parisa Rashidi and Alex Mihailidis. A survey on ambient-assisted living tools for older adults. IEEE Journal of Biomedical and Health Informatics, 17(3):579–590, 2013. [37] T´abada Samantha Marques Rosa, Anaelena Bragan¸ca de Moraes, Ang´elica Peripolli, Santos Filha, et al. Epidemiologic profile of elderly people who died because of falls in rio grande do sul state, brazil. Revista Brasileira de Geriatria e Gerontologia, 18(1):59–69, 2015. [38] JW Rowe and RL Kahn. Successful aging 2.0: conceptual expansions for the 21st century. The Journals of Gerontology Series B: Psychological Sciences and Social Sciences, 70(4):593–596, 2015. 18
[39] Ervin Sejdic, Kristin Lowry, Jennica Bellanca, Mark S Redfern, Jennifer S Brach, et al. A comprehensive assessment of gait accelerometry signals in time, frequency and time-frequency domains. Neural Systems and Rehabilitation Engineering, IEEE Transactions on, 22(3):603–612, 2014. [40] M Sekine, T Tamura, T Fujimoto, and Y Fukui. Classification of walking pattern using acceleration waveform in elderly people. In Engineering in Medicine and Biology Society, 2000. Proceedings of the 22nd Annual International Conference of the IEEE, volume 2, pages 1356–1359. IEEE, 2000. [41] Anne Shumway-Cook, Sandy Brauer, and Marjorie Woollacott. Predicting the probability for falls in community-dwelling older adults using the timed up & go test. Physical therapy, 80(9):896–903, 2000. [42] Patima Silsupadol, Ka-Chun Siu, Anne Shumway-Cook, and Marjorie H Woollacott. Training of balance under single-and dual-task conditions in older adults with balance impairment. Physical therapy, 86(2):269–281, 2006. [43] Erik E Stone and Marjorie Skubic. Fall detection in homes of older adults using the microsoft kinect. IEEE Journal of Biomedical and Health Informatics, 19(1):290–301, 2015. [44] KS van Schooten, M Pijnappels, SM Rispens, Petra JM Elders, P Lips, and JH van Die¨en. Ambulatory fall-risk assessment: amount and quality of daily-life gait predict falls in older adults. The Journals of Gerontology Series A: Biological Sciences and Medical Sciences, 70(5):608–615, 2015. [45] Vladimir Vapnik. The nature of statistical learning theory. Springer, 2013. [46] F Vasconcelos, B Cordeiro, C Rech, and E Petroski. Sensitivity and specificity of the body mass index for the diagnosis of overweight/obesity in elderly. Cadernos de Sa´ ude P´ ublica, 26(8):1519–1527, 2010. [47] Aner Weiss, Marina Brozgol, Moran Dorfman, Talia Herman, Shirley Shema, Nir Giladi, and Jeffrey M Hausdorff. Does the evaluation of gait quality during daily life provide insight into fall risk? a novel approach using 3-day accelerometer recordings. Neurorehabilitation and neural repair, 27(8):742–752, 2013.
19
[48] Mitchell Yuwono, Steven W Su, Ying Guo, Bruce D Moulton, and Hung T Nguyen. Unsupervised nonparametric method for gait analysis using a waist-worn inertial sensor. Applied Soft Computing, 14:72–80, 2014.
20


![Better secure than sorry. [PDF]](https://m.moam.info/img/260x300/better-secure-than-sorry-pdf_647a5b08098a9ee8368b465b.jpg)