Jun 17, 2014 - of the set of all power loss characteristics in soft magnetic composite ... Reduction of independent variables bases on definition of h.f.g.s. F(f ...
Binary relations between magnitudes of different dimensions used in material science optimization problems. Pseudo-state equation of Soft Magnetic Composities Krzysztof Z. Sokalski
arXiv:1406.4442v1 [cond-mat.mtrl-sci] 17 Jun 2014
Institute of Computer Science, Cz¸estochowa University of Technology, Al. Armii Krajowej 17, 42-200 Cz¸estochowa, Poland
Bartosz Jankowski and Barbara Ślusarek Tele and Radio Research Institute, Ratuszowa 11 Street, 03-450 Warszawa, Poland New algoritm for optimizing technological parameters of soft magnetic compozites has been derived on the base of topological structure of the power loss characteristics. In optimization processes of magnitudes obeying scaling it happen binary relations of magnitudes having different dimensions. From mathematical point of view in general case such a procedure is not permissible. However, in a case of the system obeying the scaling law it is so. It has been shown that in such systems binary relations of magnitudes of different dimensions is correct and has mathematical meaning which is important for practical use of scaling in optimization processes. Derived here structure of the set of all power loss characteristics in soft magnetic composite enables us to derive a formal pseudo-state equation of SMC. This equation constitutes a realation of the hardening temperature, the compaction pressure and a parameter characterizing the power loss characteristic. Finally, the pseudo-state equation improves the algoritm for designing the best values of technological parameters. PACS numbers: 75.50.-y, 75.50.Bb, 89.75.Da, 81.40.Rs Keywords: soft magnetic composities, scaling, binary relations, pseudo-state equation
I.
INTRODUCTION
Recently novel concept of technological parameters’ optimization has been applied in Soft Magnetic Composities (SMC) by Ślusarek et al., [1]. This concept bases on assumption that SMC is a self-similar system where function of loss of power obeys the scaling law [2]-[4]. The scaling is very useful tool due of the three reasons: α • it reduces number of independent variables f and Bm to the effective one f /Bm ,
• and determines general form of loss of power characteristic in a form of homogenous function in general sense (h.f.g.s.), • as well as enables us to use binary relations between magnitudes of different dimensions. Reduction of independent variables bases on definition of h.f.g.s. F (f, Bm ) is h.f.g.s. if: ∃{a, b, c} ∈ R3 : ∀λ ∈ R+ F (λa f, λb Bm ) = λc F (f, Bm ).
(1)
According to the assumtion concerning λ we are free to substitute any positive real −1 number, for instance λ = Bm b , then we get: � � F (f, Bm ) f =F ,1 (2) β α Bm Bm where f and Bm are frequency and pik of magnetic inductance, respectively. F (·, 1) is an arbitrary function, α = ab and β = bc are scaling exponents.
2 Choice for the F (·, 1) depends on the power loss characteristics of investigated materials. In [1] we have modified the Bertotti decomposition rule [5]-[6] which led to the following form for Ptot (·) = F (·, 1): Ptot (f, Bm ) β Bm
= Γ1
f + Γ2 α Bm
�
f α Bm
�2
+ Γ3
�
f α Bm
�3
+ Γ4
�
f α Bm
�4
,
(3)
where Γn have been estimated for different values of the technological parameters [1] (pressure and temperature). For purpose of this paper we take into account only one family of power loss characteristics which is presented in Fig. 1 and Fig. 2. The corresponding estimated values of the model parameters are presented in TABLE I. For all other details concerning SMC material and measurement data we refer to [1]. Now we are ready to formulate the goals of this paper. Main goal is to minimize the power loss in SMC by optimal using model density of power loss (3) and corresponding From the first row of TABLE I we can see that dimensions of the Γi coefficients depend on the values of the α and β exponents. Therefore, the power loss characteristics presented in Fig. 1 and Fig. 2 are different dimensions. So, we have to answer to the following quastion: are we able to relate them in the optimisation process which has been described in [1]? In this paper we will prove that if the considered characteristics obey the scaling, then the binary relation between them is invariant with respect to this transformation and comparison of two magnitudes of different dimensions has mathematical meaning. Reach measurement data of power losses in Somaloy 500 have been transformed into parameters of (3) v.s. hardening temperature and compaction pressure Table I in [1]. Informations contained in this Table enable us to infer about topological structure of set of the power loss characteistics and finally to construct pseudo-state equation for SMC, and derive supplementary algoritm for the best values of technological parameters to that one published in [1]. II.
SCALING OF BINARY RELATIONS
Let the power loss characteristic has the form determined by the scaling (2). It is important to remain that α and β are defined by initial exponents a, b and c (see after formula (2)): α=
a c , β= . b b
Let us concentrate our attention at the point on the
(4) f α Bm
axis of Fig. 1 or Fig. 2:
f1 f2 f4 f = α1 = α2 = · · · = α4 α Bm Bm 1 Bm 2 Bm 4
(5)
Let us take into account the two characteristics and let us assume that Ptot 1 β1 Bm 1
>
Ptot 2 β2 Bm 2
.
(6)
Therefore, the considered binary relation is the strong inequality and corresponds to natural order presented in Fig. 1 and Fig. 2. The most important question of this research is whether (6) is invariant with respect to scaling: ′ Ptot 1 ′β1 Bm 1
>
′ Ptot 2 ′β2 Bm 2
.
(7)
3 Let λ > 0 be an arbitrary positive real number. Then, the scaling of (7) goes according to the following algoritm: • Let us perorm the scaling with respect to λ of all independent magnitudes and the dependent one : fi′ = λai fi , ′ bi Bm i = λ Bm i , ′ ci Ptot i = λ Ptot i ,
(8)
where i = 1, 2 · · · 4 labels the considered characteristics. • Substituting apropriate relations of (8) to (7) we derive: Ptot 1 β1 Bm 1
λc1 −b1 β1 >
Ptot 2 β2 Bm 2
λc2 −b2 β2 .
(9)
• Collecting all powers of λ on the left-hand side of (9) and taking into account (4) we derive the resulting power to be zero and: λc1 −c2 −b1 β1 +b2 β2 = 1.
(10)
Therefore (6) is invariant with respect to scaling. This binary relation has mathematical meaning and constitutes the total order in the set of characteristics.
III.
BINARY EQUIVALENCE RELATION
The result derived in Section II can be supplement with the following binary equivalence relation. Let ! fi,j Ptot i,j Xi,j = , βj (11) α Bmji,j Bm i,j be i-th pont of the j-th characteristic. Two points are related if they belong to the same characteristic: Xi,j R Xk,j .
(12)
Theorem: R is equivalence relation. (The proof is trivial and can be done by checking out that the considered relation is: reflexive, symmetric and transitive.) Therefore, R constitutes division of the positive-positive quarter of plane spanned by (11). The characteristics do not intersect each other except in the origin point which is excluded from the space. The result of this section implies that the power loss characteristics (2) and (3) are invariant with respect to scaling. Structure of derived here the set of all characteristics of which some examples are presented in Fig. 1 and Fig. 2 enables us to derive a formal pseudo-state equation of SMC. This equation constitutes a realation of the hardening temperature, the compaction pressure and a parameter characterizing the power loss characteristic corresponding to the values of these technological parameters. Finally, the pseudostate equation will improve the algoritm for designing the best values of technological parameters.
4 TABLE I. Somaloy 500. Values of scaling exponents and coefficients of (3) v.s. compaction pressure and hardening temperatures, a selection from [1] Γ3
Γ4
[m T α−β ] [ ms T 2α−β ] s2
[m2 T 3α−β ]
[m2 s T 4α−β ]
0.171
3.606 · 10−5
1.953 · 10−8
−2.255 · 10−12
-1.383 -0.125
0.153
3.328 · 10
−9
9.254 · 10
−1.177 · 10−12
-1.735 -0.517
0.156
2.393 · 10−5
2.309 · 10−9
−8.075 · 10−14
900
-1.395 -0.082
0.101
6.065 · 10
800
-1.473 -0.28
0.183
1.347 · 10−5
450
800
-1.596 -0.123
0.145
2.482 · 10−5 −1.218 · 10−9
6.120 · 10−14
550
800
-2.034 -1.326
0.106
1.407 · 10
−8
4.541 · 10−13
600
800
-1.608 -0.232
1.220
8.941 · 10−4 −5.302 · 10−8
1.664 · 10−11
Temperature Pressure
α
β
[−]
[−]
[o C]
[MP a]
500
500
-1.312 -0.011
500
600
500
700
500 400
Γ1 2
Γ2 2
−5
−5
−4
−8.031 · 10
−9
3.689 · 10−9 −1.066 · 10
7.877 · 10−13 1.185 · 10−13
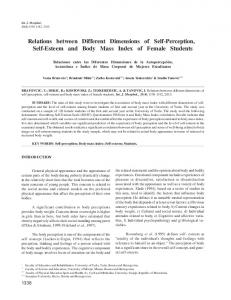
β α FIG. 1. Selection of the power loss characteristics Ptot /Bm vs. f /Bm calculated according to (3) and Table I for Somaloy 500 [1]. Corresonding hardening temperature was 500o C.
IV.
PSEUDO-STATE EQUATION OF SMC
Let C˜ be set of all possible power loss characteristics in considered SMC. Each � � α β plane which corresponds to a point characteristic is smooth curve in f /Bm , Ptot /Bm in [T, p] plane. In order to derive the pseudo-state equation we transform each power loss characteristic into a number V corresponding to (T, p) point. By this way we obtain a function of two variables: (T, p) −→ V.
(13)
This function must satisfy the following condition. Let us concentrate our attantion at the two following points: f1 f α1 = α Bm B m 1 f2 f . α2 = α Bm B m 2
(14)
5
β α FIG. 2. A selection of the power loss characteristics Ptot /Bm vs. f /Bm calculated according to (3) and Table I for Somaloy 500 [1].
FIG. 3. Pseudo-Isotherm T = 500o C of the Low-losses phase, according to data of Table II .
β2 β1 Let us consider the two characteristics Ptot 1 /Bm 1 and Ptot 2 /Bm 2 of the two samples composed under T1 , p1 and T2 , p2 values of temperature and pressure, respectively. While, the other technological parameters powder compositions and volume fraction are constant. Let us assume that for (14) the following relation holds:
Ptot 1 β1 Bm 1
>
Ptot 2 β2 Bm 2
.
(15)
6 TABLE II. V measure v.s. hardening temperature and compaction pressure. Temperature Pressure h [K] [MP a]
V W kg T β
723,15
800
40,6
773,15
900
43,75
773,15
700
47,25
673,15
800
50,3
773,15
600
57,12
823,15
800
81,5
773,15
500
89,28
742,15
764
492,3
753,15
780
509,2
804,15
764
528,5
711,15
764
547,0
873,15
800
720,0
i
It results from the derived structure of C˜ that (15) holds for each value of (14). Therefore we have to assume the following condition of sought V (T, p): If the relation (15) holds for T1 , p1 , T2 , p2 then the following relation has to be satisfied for V (T, p): (16)
V (T1 , p1 ) > V (T2 , p2 ).
Moreover, V (T, p) has to indicate place of coresponding characteristic in the ordered ˜ The simplest choice satisfying these requirements is the following average: C. 1 V (T, p) = φmax − φmin
Z
φmax
φmin
Ptot ( Bfα ) m
β Bm
d(
f ), α Bm
(17)
where the integration domain is common for the all characteristics. We have selected the common domain of Fig. 1 and Fig. 2: φmin = 0, φmax = 4000[ s T1 α ]. Using (3) we transform (17) to the working formula for the measure V : V (T, p) =
1 φmin − φmax
Z
φmax
x (Γ1 + x (Γ2 + x (Γ3 + x Γ4 ))) dx,
(18)
φmin
where, x = Bfα . α, Γi are coefficients dependent on T and p, see TABLE I. The values m of V (T, p) are tabulated in TABLE II. TABLE II enables us to draw pseudo-izotherm. It is presented in Fig. 3. However, in order to derive the complete pseudo-state equation we must create a mathematical model. On basis of Fig. 3 we start from the classical gas state-equation as an initial approximation: pV = 1, kB T
(19)
where kB is pseudo-Boltzmann constant. In order to extent (19) to a realistic equation we apply again the scaling hypothesis (2) [2]-[4]: ! � � � �γ T T p p Tc V , (20) = , ·Φ T c pc pc ( ppc )δ where Φ(·) is an arbitrary function to be determined. γ, δ and Tc , pc are scaling exponents and scaling parameters respectively, to be determined. For our conveniences
7 TABLE III. Somaloy 500, low-losses phase. Values of pseudo-state equation’s parameters and the Pad e aproximant’s coefficients of (22). γ
δ
Tc
pc
G0
G1
G2
0,1715 1,2812 21,622 37,729 370315315 -47752251 1734952 G3
G4
D1
D2
-1,3764 -678,26 170,80 6243,8
D3
D4
-
386,96
-28,699
-
TABLE IV. Somaloy 500, high-losses phase. Values of pseudo-state equation’s parameters and the Pad e aproximant’s coefficients of (22). γ
δ
Tc
pc
G0
G1
G2
0,1810 1,5550 22,949 30,197 365210688 -47714207 1762773 G3
G4
D1
D2
-1,3763 -683,38 170,77 5739,9
D3
D4
-
387,81
-22,514
-
we introduce the following variables: T
τ=
τ p T , π = , X = pTc δ = δ . Tc pc ( pc ) π
(21)
In order to extent (19) to a full state-equation we apply Padé approximante by analogy to virial expantion derived by Ree and Hoover [7]: V (τ, π) = π γ
G0 + G1 X + G2 X 2 + G3 X 3 + G4 X 4 , 1 + D1 X + D2 X 2 + D3 X 3 + D4 X 4
(22)
where G0 , . . . , G4 , D1 , . . . , D4 are parameters of the Padé approximante. All parameters have to be determined from the data presented in TABLE II. V.
ESTIMATION OF THE PSUDO-STATE EQUATION’S PARAMETERS
At the beginning we have to notice that the data collected in TABLE II reveal sudden change of V between two points: [773, 15; 500, 0] and [742, 15; 764, 0]. This suggests existence of a crossover between two phases: low-losses phase and highlosses phase. We take this effect into account and we divide the data of Table II into two subsets corresponding to these two phases, respectively. Since the crossover consists in changing of characteristic exponents for the given universality class it is necessary to perform estimations of the model parameters for each phase separately. Minimizations of χ2 for both phases have been performed by using MICROSOFT EXCEL 2010, where � N � 2 3 4 2 X γ G0 + G1 Xi + G2 Xi + G3 Xi + G4 Xi 2 V (τi , πi ) − πi χ = , (23) 1 + D1 Xi + D2 Xi2 + D3 Xi3 + D4 Xi4 i=1
where N = 7 and N = 5 for the low-losses and high-losses phases, respectively. Table III and Table IV present estimated values of the model parameters for the low-losses and for high-losses phases, respectively. VI.
OPTIMIZATION OF TECHNOLOGICAL PARAMETERS
Function V (T, p) serves a power loss measure versus the hardening temperature and compaction pressure. In order to explain how to optimize the technological parameters
8
FIG. 4. Phase diagram for Somaloy 500.
with the pseudo-state equation (22) we plot the phase diagram of considered SMC Fig. 4. Note that all losses’ characteristics collapsed to a one curve for the each phase. Taking into account the Low-losses phase we determine the lowest losses at τ · π −δ = 19, 75. This gives the following continous subspace of the optimal points: T Tc ( ppc )δ
= 19, 75.
(24)
(24) represents the minimal iso-power losse curve. All points satisfying (24) are solutions of the optimization problem for technical parameters of SMC.
VII.
CONCLUSIONS
By introducing the binary relations we have revealed twofold. The power loss characteristics do not cross each other which makes the topology’s set of this curves very useful and effectively that we can perform all calculations in the one-dimension space spanned by the scaled frequency [1]-[4] or here in the case of pseudo-state equation in the scaled temperature. For general knowledge concerning such a topology we refer to the papers by Egenhofer [8] and by Nedas et al. [9]. However, to our knowledge this paper is the first one about the binary relations between magnitudes of different dimensions in the sense of different physical magnitudes. The efficiency of scaling in solving problems concerning power losses in soft magnetic composities has already been confirmed in recent paper [1]. However, this paper is the first one which presents an application of scaling in designing the technological parameters’ values by using the pseudo-state euation of SMC. The obtained result is the continuous set of points satisfying (24). All solutions of this equations are equivalent for the optimization of the power losses. Therefore, the remaining degree of freedom can be used for optimizing magnetic properties of the considered SMC. Ultimately, one must say that the degree of success achieved when applying the scaling depends on the property of the data. The data must obey the scaling.
9 ACKNOWLEDGMENTS
The work has been supported by National Center of Science within the framework of research project Grant N N507 249940.
[1] B. Ślusarek, B. Jankowski, K. Sokalski, J. Szczygłowski, Characteristics of power loss in Soft Magnetic Composites a key for designing the best values of technological parameters, Journal of Alloys and Compounds 581 699-704 (2013), doi: http://dx.doi.org/10.1016/j.jallcom.2013.07.084, ((For preprint see arXiv:1304.6380v1 [cond-mat.mtrl-sci] 20 Apr 2013.)). [2] K. Sokalski, J. Szczygłowski, M. Najgebauer and W. Wilczyński, Losses scaling in soft magnetic materials, COMPEL: Int. J. Comput. Math. Electr. Electron. Eng.,26, 640-649 ( 2007). [3] K. Sokalski, J. Szczygłowski, Acta. Phys. Pol. A, 115, 920-924 (2009). [4] K. Sokalski, J. Szczygłowski, and W. Wilczyński, Scaling conception of power loss’ separation in soft magnetic materials, International Journal of Condensed Matter, Advanced Materials, and Superconductivity Research (NOVA), 12. Nr. 4, (2013). (For preprint see arXiv:1111.0939v1 [cond-mat.mtrl-sci] 3 Nov 2011.) [5] G. Bertotti, J. Mag. Mag. Mater. 41, 253 (1984). [6] G. Bertotti, IEEE Trans. Magn. 24, 621 (1988). [7] F.H. Ree, W.G. Hoover, J.Chem.Phys. 40, 474 (1964). [8] M. Egenhofer, A formal definition of binary topological relationships, in: W. Litwin and H.- J. Schek, eds., Proceedings of the Third International Conference on Foundations of Data Organization and Algorithms (FODO), Paris, France, Lecture Notes in Computer Science, Vol. 367 (Springer-Verlag, New York, 1989) 457Ű472. [9] K. A. Nedas, M.J. Egenhofer and D. Wilmsen, Definitions of Line-Line Relations, Int. J.Geo. Inf. Sc. Vol. 21, Nos. 1-2 (2007), 21-48. .